Grade 12 Data Management Exam Review
1/196
There's no tags or description
Looks like no tags are added yet.
Name | Mastery | Learn | Test | Matching | Spaced | Call with Kai |
|---|
No analytics yet
Send a link to your students to track their progress
197 Terms
Probability is
a measure of the likelihood of an outcome occurring
An outcome is
1 possible result of an experiment
Outcomes are
All of the possible results of an experiment
A probability experiment is
An action that has a minimum of 2 possible outcomes
A trial is a
step in probability experiment in which an outcome is produced & tallied
Experimental probability is
the probability of an outcome found using P(A)= n(A)/n(T)
The formula P(A)= n(A)/n(T) is for
experiment probability
In the formula P(A)= n(A)/n(T)
n(T) shows
the number of total trials
In the formula P(A)= n(A)/n(T)
n(A) shows
the number of times event ‘A’ happened
In the formula P(A)= n(A)/n(T)
P(A) shows
the probability of outcome A happening
Subjective Probability is
an estimate that is based on opinion & is ranged from 0 to 1
A sample space is
a collection of all possible outcomes
A sample space can also be known as
a sample set
An even is
a set of outcomes that have a common characteristic
A simple event is
an event that has exactly 1 outcome
Theoretical probability is
the ratio of the number of outcomes to the total number of outcomes possible
The formula for theoretical probability is
P(A) = n(A)/n(S)
In the formula P(A) = n(A)/n(S)
n(A) shows
the number of ways even A can happen
In the formula P(A) = n(A)/n(S)
P(A) shows
the probability of even A happening
In the formula P(A) = n(A)/n(S)
n(S) shows
the total number of possible outcomes in the sample space
In a deck of 52 cards there are _ types of suit cards
4 suits (Heart, Diamond, Spade, Clover)
In a deck of 52 cards there are _ red cards
26 red cards
In a deck of 52 cards there are _ black cards
26 black cards
In a deck of 52 cards there are _ card in each suit
13 cards of each type of suit
In a deck of 52 cards there are _ face cards cards
12 face cards (Jack, King, Queen)
How many possible outcomes are there for the sum of 2 on 2 six-sided dice?
1 (1+1)
How many possible outcomes are there for the sum of 3 on 2 six-sided dice?
2 (1+2) & (2+1)
How many possible outcomes are there for the sum of 4 on 2 six-sided dice?
3 (2+2) & (3+1) & (1+3)
How many possible outcomes are there for the sum of 5 on 2 six-sided dice?
4 (1+4) & (4+1) & (2+3) & (3+2)
How many possible outcomes are there for the sum of 6 on 2 six-sided dice?
5 (1+5) & (5+1) & (2+4) & (4+2) & (3+3)
How many possible outcomes are there for the sum of 7 on 2 six-sided dice?
6 (1+6) & (6+1) & (2+5) & (5+2) & (3+4) & (4+3)
How many possible outcomes are there for the sum of 8 on 2 six-sided dice?
5 (2+6) & (6+2) & (3+5) & (5+3) & (4+4)
How many possible outcomes are there for the sum of 9 on 2 six-sided dice?
4 (3+6) & (6+3) & (5+4) & (4+5)
How many possible outcomes are there for the sum of 10 on 2 six-sided dice?
3 (5+5) & (6+4) & (4+6)
How many possible outcomes are there for the sum of 11 on 2 six-sided dice?
2 (5+6) & (6+5)
How many possible outcomes are there for the sum of 12 on 2 six-sided dice?
1 (6+6)
A complementary even is
all of the outcomes that are not part of A & are A’
A’ means
A prime
The formula for A Prime is
P(A’)= 1-P(A)
The ratio for odds in favour of A is
favourable outcomes : unfavourable outcomes
The ration for odds against A is
unfavourable outcomes “ favourable
There are _ numbers in the roulette wheel
36 numbers & 2 zeros
There are _ red slots in the roulette wheel
18
There are _ black slots in the roulette wheel
18
A simulation is
an experiment that models an actual event
A simulator is
a tool that can be used to give a real-life experiment
A Venn Diagram is
a diagram that is represented by shaded or coloured shapes
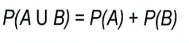
Mutually exclusive events are
events that can’t happen at the same time
Non-mutually exclusive events are
events that can happen at the same time
The symbol for ‘and’ is

The symbol for ‘or’ is

The formula for non-mutually exclusive events is
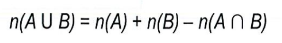
The formula for non-mutually exclusive events is
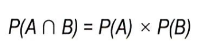
Independent events are
2 events where 1 event does not influence the other event
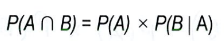
Dependent events are
2 events where 1 event does influence the other event
Compound events are
multiple events in a probability experiment
A conditional probability is
a probability of the second event happening after the first
A tree diagram is
a diagram used to show all the possible outcomes
The formula for the probability of 2 independent events is
The formula for the probability of 2 dependent events is
The fundament counting principle
the total number of outcomes for many events
The formula for the fundamental counting principle is
n(S) = n(A) * n(B)
The formula for the fundamental counting principle with more than 2 events is
n(S) = n(A)*n(B)*n(C)
The formula for the fundamental counting principle that are dependent events are
n(S) = n(A)*n(A-1)*n(A-2)
A factorial is
a product of a sequential natural numbers
n factorial can be written as
n! = n*(n-1)*(n-2)
An arrangement is
an ordered list of items
A permutation is
an arrangement of objects in a definite order
The notation for permutations for the same object is
nPn = n!
The notation for permutations for different objects are
nPr = n!/(n-r)! where n is bigger
The indirect method/restrictions for permutations is
n(A)=n(S)-n(A’)
The formula for permutations with some identical items is
n!/p!*q**r!
The formula for permutations with objects in a fixed order is
n!/p!
A combination is
a selection from a group of objects where order does not matter
A combination on a calculate can be wrote as
nCr
A subset is
a set whose elements are also subsets of another set
The formula for subsets are
2n
A null set is
a set with no elements that equals 1
The pascals triangle is
an array of numbers in a triangular pattern where each term is the sum of the 2 numbers above it
A royal flush has
a 10, Jack, King, Queen, & Ace or the same suit
A straight flush has
5 consecutive cards of the same suit
A 4 of a kind has
4 cards that have the same number
A full house is
3 cards of a rank & 2 cards of another rank
A flush
has 5 cards with the same suit
A straight has
5 consecutive cards of any suit
A 3 of a kinds has
3 cards of the same rank
A 2 pair has
2 cards with 1 rank & 2 other cards of another rank
A 1 pair has
2 cards of the same rank
The measure of central tendency is
a set id data where the mean, median, & mode can be found
Deviation is
the difference between a data value & the mean which should =0
An outlier is
a value in a set of data that is very different
Mean is
a measure of central tendency where the sums are added & then it is divided by the number of values
The formula for mean is
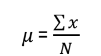
The formula for the sample mean is

The median is
the middle value of a set of data after it is put in order
The mode is
the number that is repeated the most
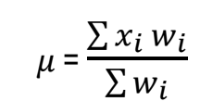
The formula for weighted mean is
A mound-shaped & symmetrical shaped graph is
a graph that is symmetric & the mean, median & mode are the same
A right-skewed graph
is where the mean is to the right side of the median
A left-skewed graph is where
the mean is to the left side of the median