Unit 2-1: Population and Migration - AP Outline
1/29
Earn XP
Name | Mastery | Learn | Test | Matching | Spaced | Call with Kai |
|---|
No analytics yet
Send a link to your students to track their progress
30 Terms
Age Structure
Distribution of individuals within a population based on age groups; shows the proportion of people in different age categories
Typically three age groups:
0-14 (Youth dependents)
15-64 (Working age)
65-older (Elderly dependents)
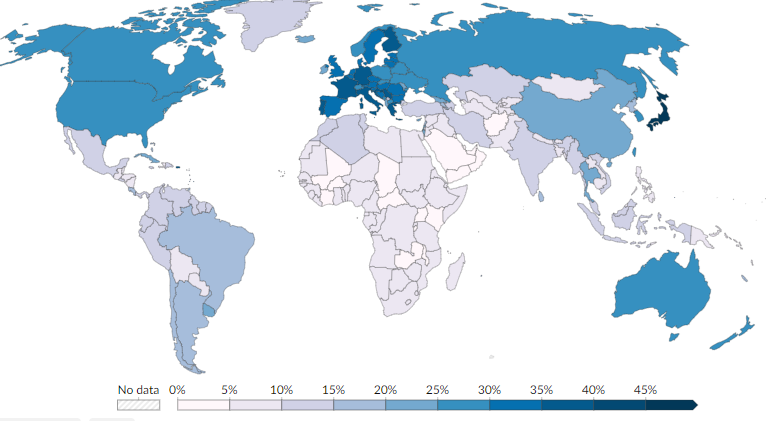
Aging Population
Demographic trend where the proportion of older individuals within a population increases relative to the younger, working-age population
Primary Causes:
Decreased Fertility Rates
Increased Life Expectancy
Challenges:
Increased Dependency Ratio
Strain on Social Services
Labor Shortages and Economic Slowdown
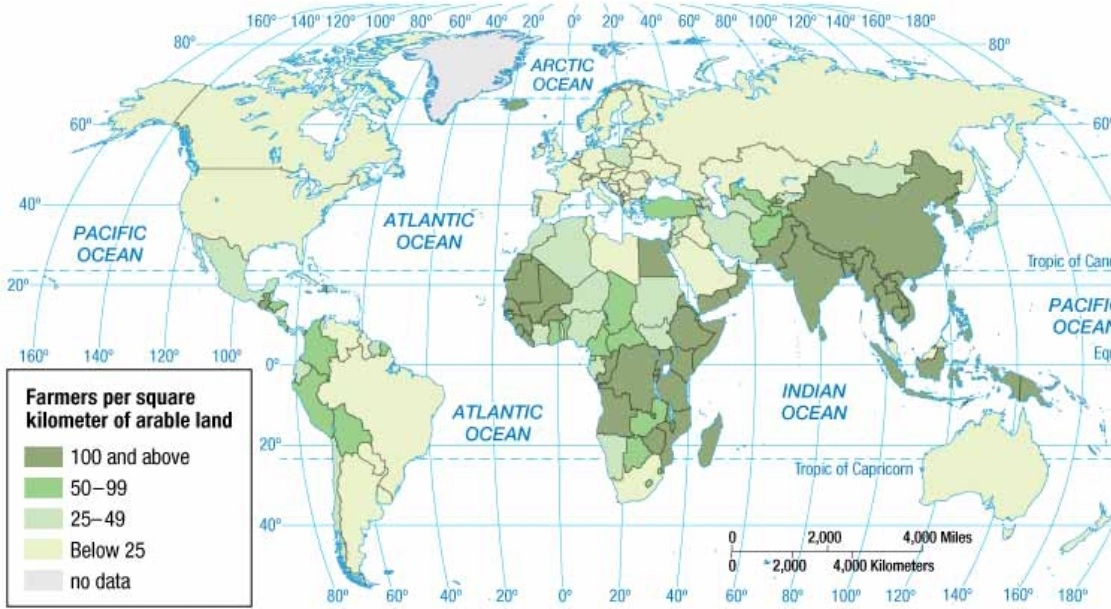
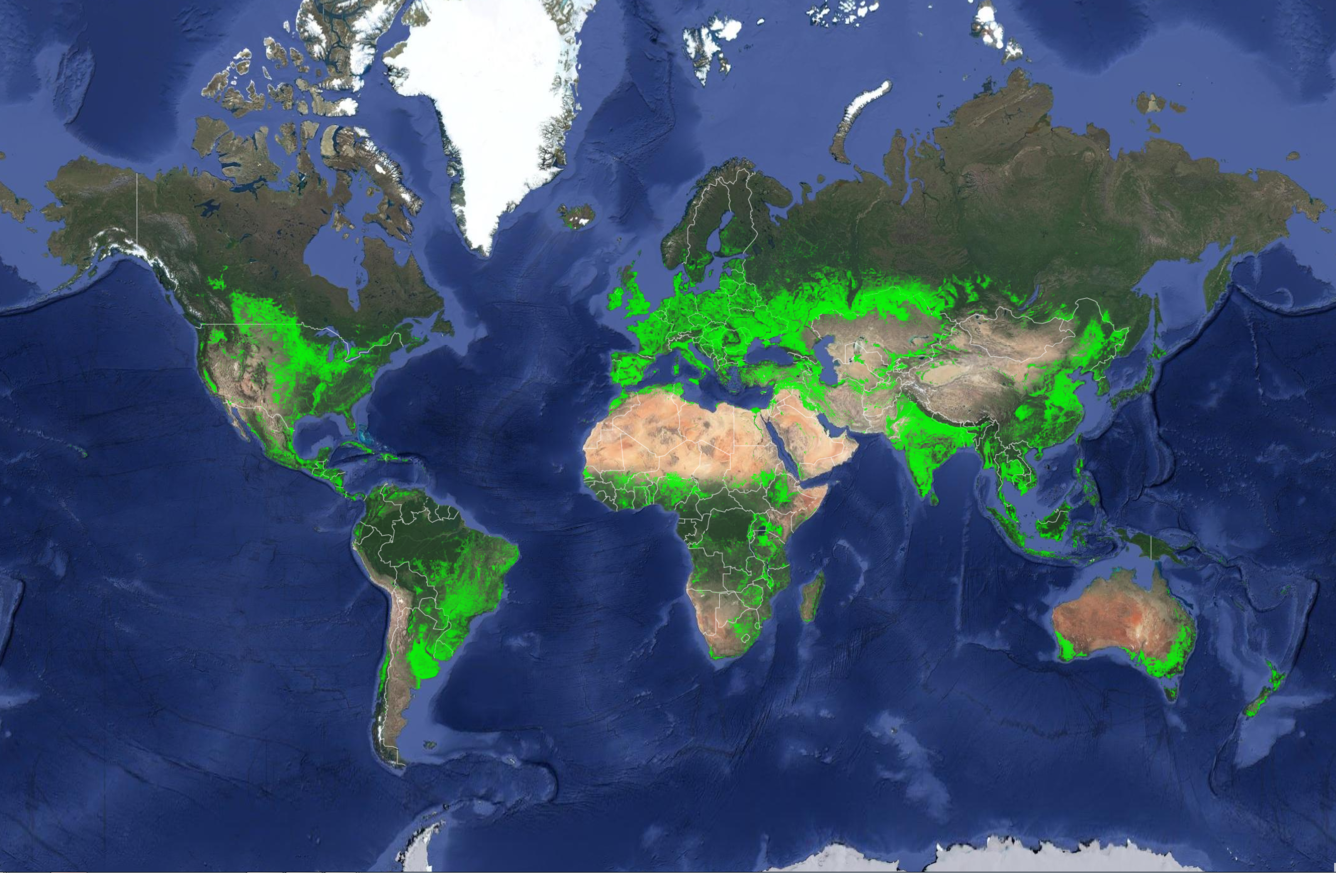
Agricultural Density
Number of farmers per unit area of arable land
Provides insight into a country’s level of economic development and agricultural efficiency
High Agricultural Density = high number of farmers typically in LDCs with labor-intensive methods and less technology and mechanization (tech/mech)
Low Agricultural Density = low number of farmers typically in MDCs with a highly mechanized and commercial agricultural system
Antinatilist Policies
Government strategies designed to decrease birth rates and slow population growth; often seen in countries with rapidly growing populations (LDCs); policy could be voluntary or coercive
EX - China's One-Child Policy
Effects of Antinatalist Policies
Demographic Changes - reduced fertility (birth) rates, gender imbalance, and increased aging population
Social and Economic Impacts - strain on social services, labor shortages and human rights concerns
Arable Land
Land that is suitable for farming, meaning it can be plowed and used to grow crops
Factors that determine arable land -
Climate
Soil Quality
Topography
Water Access
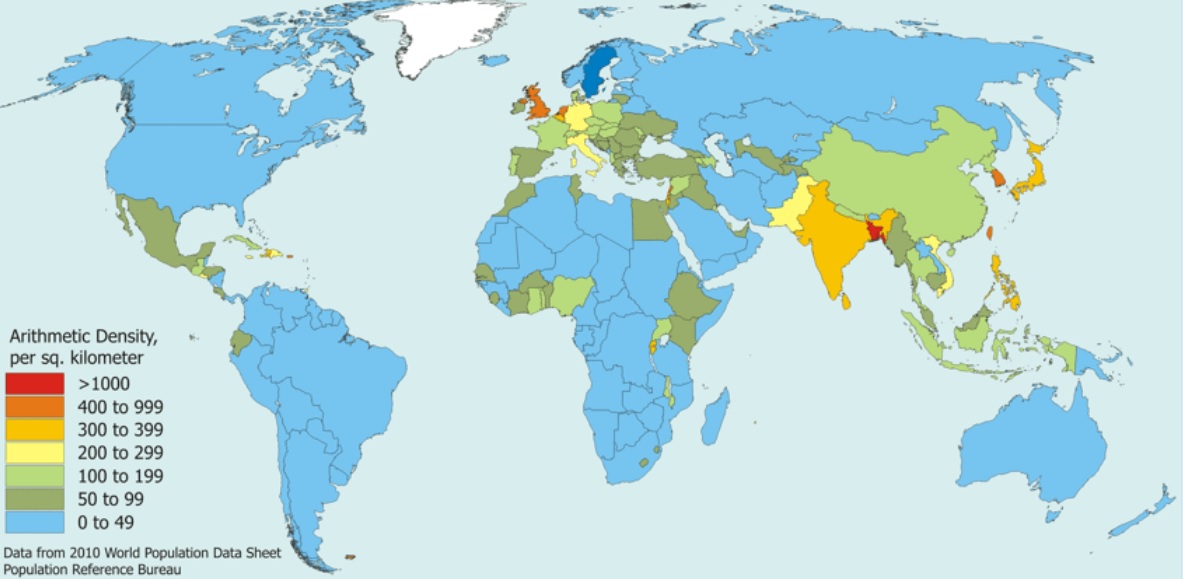
Arithmetic (Crude) density
Number of people per unit of land area (usually per square mile or kilometer)
Higher the number = greater the pressure (strain) on the land for resources (water, timber, minerals, non-renewable resources)
Increased amounts of pollution and waste/sanitation
Carrying Capacity
The maximum number of individuals a particular environment can sustainably support without degrading the environment or depleting resources
EX - food, fresh water, building materials, sanitation, energy
Factors Influencing Carrying Capacity
Natural Resources - food, fresh water, energy
Technology - agricultural practices, water management, renewable energy sources
Economic Systems - MDCs can import needed materials
Waste Absorption - environment’s ability to absorb waste and pollution
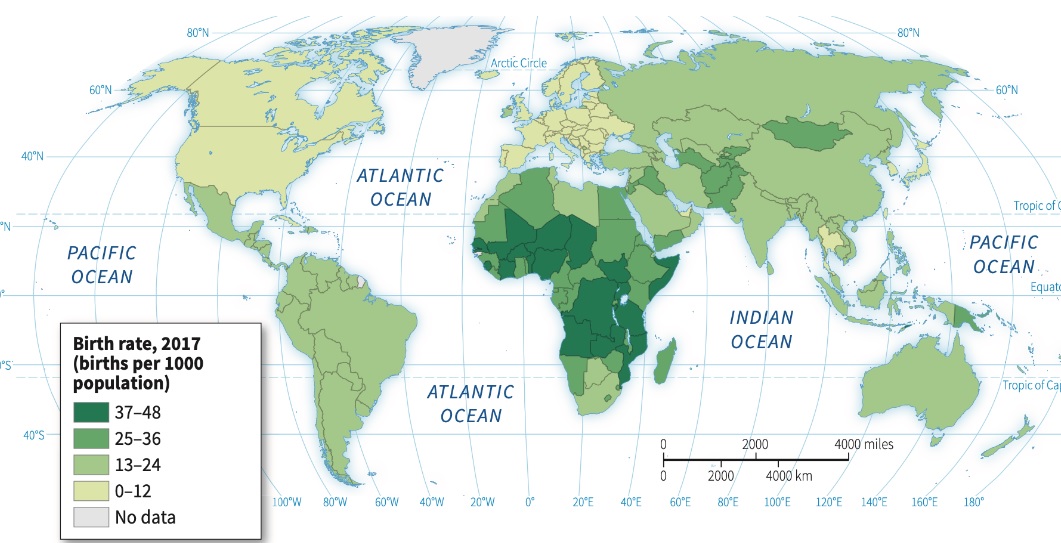
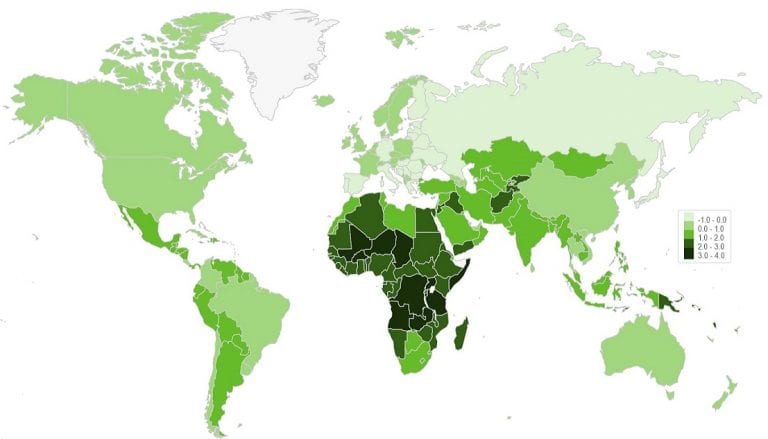
Crude Birth Rate (CBR)
Number of live births per 1,000 people in a given year
High CBR - LDCs - large number of babies due to lack of access to contraception and education for women, as well as societal or economic need for large families (farming)
Low CBR - MDCs - fewer babies due to high levels of education and employment for women, increased urbanization, high-cost of raising children, and access to family planning
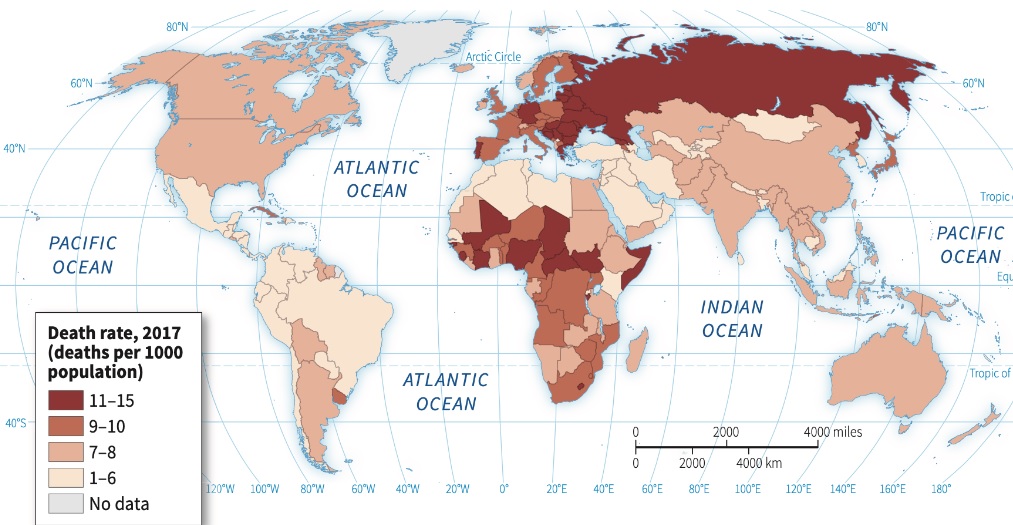
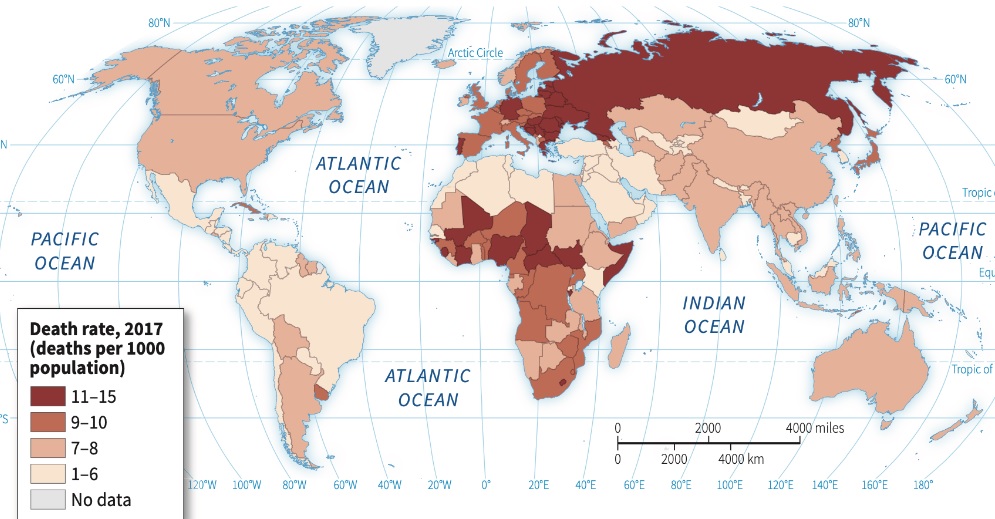
Crude Death Rate (CDR)
Number of deaths per 1,000 people in a population in a given year
Factors influencing population health, such as healthcare access, nutrition, and sanitation, significantly affect death rates in different regions.
NO direct connection with development!!
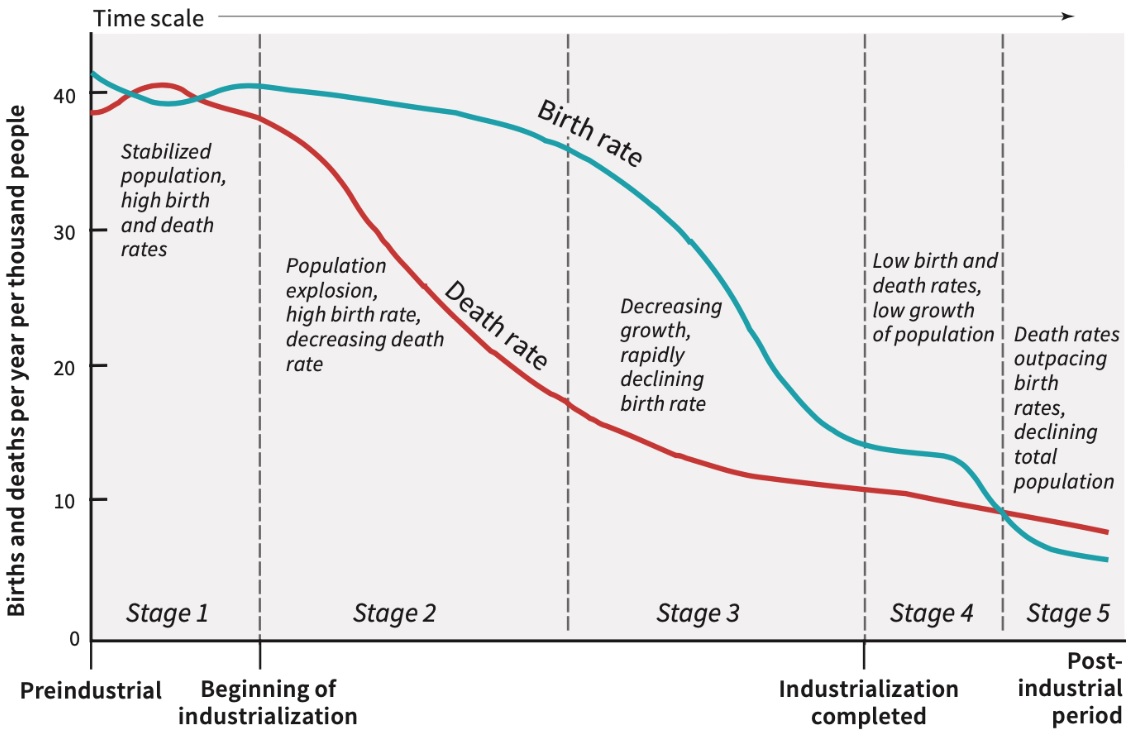
Demographic Transition Model (DTM)
How crude birth rate (CBR) and crude death rate (CDR) as well as the resulting rate of natural increase (RNI) change over time as countries go through industrialization and urbanization
Framework that describes the shift of a country’s population from high birth and death rates to low birth and death rates, resulting in population growth and changes in society.
KNOW THE 5 STAGES!!
Dependency Ratio
The proportion of a population that is considered dependent (too young or too old to work) compared to the working-age population
Dependent = 0-14, 65 and older
Youth Dependency Ratio (0-14) - higher in LDCs; puts strain on working class related to resources for education, health care, and other services
Elderly Dependency Ratio (65-older) - higher in MDCs; puts strain on working class and government for social security, pensions, and health care
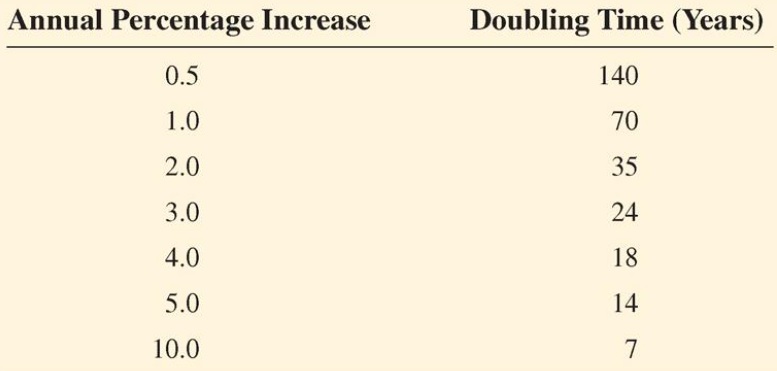
Doubling Time
The number of years it takes for a population to double in size, assuming a constant growth rate
Rule of 70 - calculate doubling time by dividing 70 by a country’s rate of natural increase (RNI)
Higher RNI (LDCs) = shorter doubling time
Lower RNI (MDCs) = longer doubling time
Epidemiological Transition Theory
Theory that explains the shift in a country's main causes of death and disease as it undergoes economic development
5 Stages of the Epidemiological Transition Theory
Age of Pestilence and Famine - high mortality (death) rates and infectious diseases (plague, malaria, ebola, cholera) as the primary causes of death
Age of Receding Pandemics - death rate drops significantly, and life expectancy increases as improvements in sanitation, nutrition, public health, and medicine diffuse
Age of Degenerative Diseases - chronic diseases (heart disease, cancer, stroke) become the primary causes of death as lifestyle changes (sedentary, lifestyle, high-fat diets, smoking) occur and life expectancy continues to rise
Age of Delayed Degenerative Diseases - declining mortality rates due to advanced medical technology and health care, leading to increased life expectancy and a higher proportion of elderly in the population
Age of Re-emerging Infectious Diseases - a resurgence of infectious diseases previously thought to be under control, often driven by factors like antibiotic resistance, globalization, and changes in health care practices
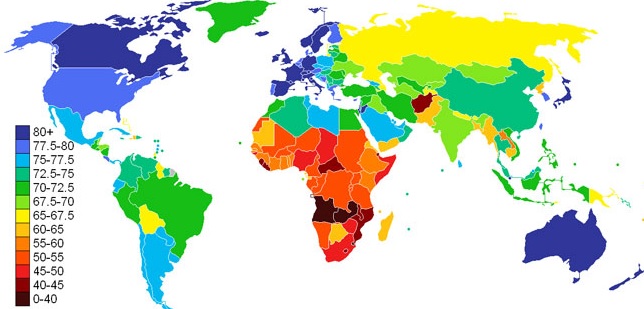
Life Expectancy
The average number of years a person is expected to live, given current conditions, including social, economic, and medical factors
Higher in MDCs (Core) due to advanced healthcare, clean water, proper sanitation, and high standards of living
Lower in LDCs (Periphery) due to lack of access to medical care, high prevalence of infectious diseases, poor nutrition, and high infant mortality rate (IMR)
Factors Influencing Life Expectancy
Health care and sanitation
Nutrition and food security
Economic Development
Social and Political Stability
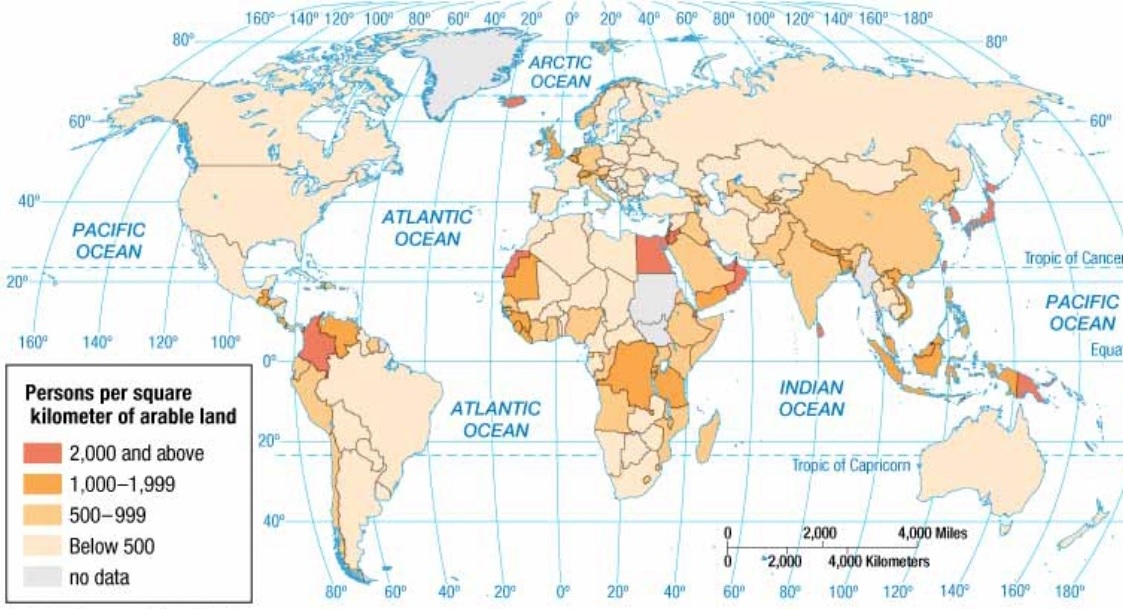
Physiological Density
The average number of people per unit area (square mile or kilometer) of arable land
Helps understand how densely populated an area is relative to its agricultural capacity, highlighting pressures on food production and land use
High Physiological Density - strain on the land to produce food - large number of people must be supported by small amount of farmland - leads to challenges such as food insecurity, heavy reliance on food imports, and a need for intensive farming practices
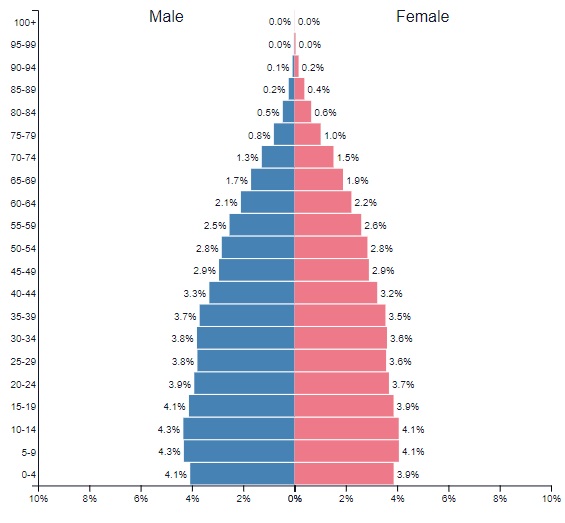
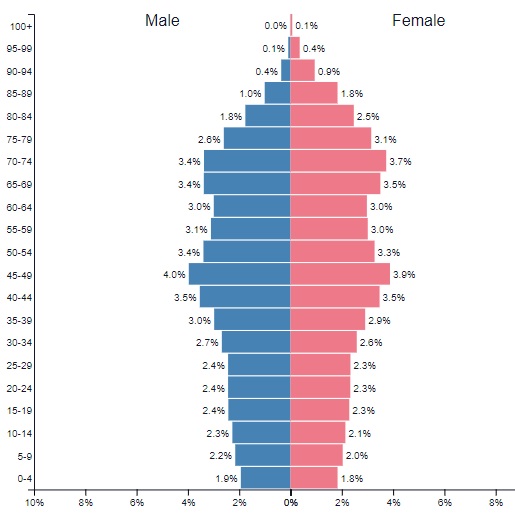
Population Pyramid
Graphical representation of the distribution of a population by age and gender
Focus on differences between male/female or the THREE different age groups (0-14), (15-64), (65 and older) - Typically illustrates the proportion of dependents (ages 0-14 and 65+) versus the working-age population (ages 15-64)
THREE Types of Population Pyramids
Expansive (Rapid Growth) - very wide base and narrow top * High crude birth rate and lower life expectancy
Stationary (Slow or Zero Growth) - rectangular or columnar shape * Population relatively evenly distributed
Constrictive (Declining or Negative Growth) - base is narrower than the middle, resembling an upside-down pyramid or beehive * indicates an aging population with low birth rates.

Pronatalist Policies
Government actions or societal norms that encourage or promote population growth by increasing the birth rate or fertility rate of an area
Usually implemented by MDCs (core) - stage 4 or 5 of the demographic transition model
Common Examples of Pronatalist Policies
Financial incentives (cash bonuses, tax breaks)
Parental leave (maternity and paternity leave)
Childcare support (free or subsidized childcare services)
Public campaigns (public awareness promotion campaign)
Rate of Natural Increase (RNI)
Percentage by which a population grows or declines in a year, solely based on births and deaths NOT migration
Typically higher in LDCs (periphery) and lower in MDCs (core)
Formula - CBR-CDR/10
Sex Ratio
Number of males for every 1,000 females in a population - influenced by cultural preferences, mortality rates, and migration patterns
Consequences of an Unbalanced Sex Ratio
Social Instability - increased competition for partners, increased crime rates, and social unrest
Gender-Based Violence and Trafficking - higher risks of violence and exploitation against women and girls
Economic Impact - can lead to labor shortages and affect economic growth negatively
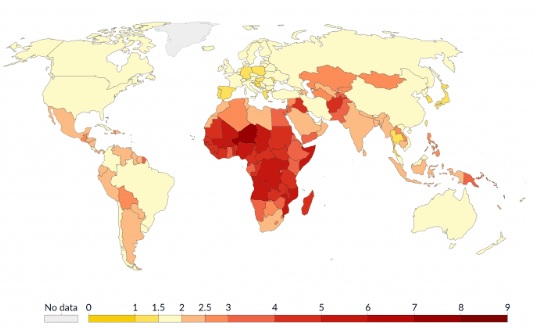
Total Fertility Rate (TFR)
The average number of children born per women during her reproductive lifetime, considered to be from 15 to 49 years of age
Typically higher in LDCs (periphery) and lower in MDCs (core)
Key indicator of population growth or decline
Human Factors - Population Distribution
Social, economic, and political elements that attract or repel people from living in certain areas - resulting from human activity and can change over time
Economic Factors
Employment and industry (job opportunities)
Infrastructure (transportation networks, communication systems and access to utilities)
Urbanization (rural to urban migration for better economic opportunities)
Political Factors
Political stability (stable governments, low crime rates, and peace)
Government policies (housing, immigration, or development can influence population)
Safety and security (Low crime rates and a strong sense of personal security)
Social/Cultural Factors
Amenities and services (high-quality education, healthcare, and social services attract people)
Cultural and historical ties (similar cultural background, language, or religion or important historical events)
Social networks (family, friends, and strong community)
Physical Factors - Population Distribution
Climate, landforms, and water bodies influence where population settle
People tend NOT to settle in areas that are TOO dry, cold, wet, high
Climate - people more likely to live in temperate zones with moderate weather conditions
Landforms (topography) - lowlands and river valleys good due to fertile soil to grow crops, while mountains and highlands are difficult to access and grow crops
Water Bodies - access to freshwater resources like rivers and lakes is crucial for sustaining populations, providing water for drinking, agriculture, and transport
Soil and Resources - fertile soil for agriculture and natural resources (coal, oil, minerals) can support settlements
Immigration Policy
Immigration policy refers to a country's laws and regulations that govern the movement of people across its borders. These policies determine who can enter, stay, and become a citizen, and are shaped by a variety of factors, including economic needs, national security, and humanitarian concerns
Mortality Rate
Number of deaths per 1,000 people in a population in a given year
Factors influencing population health, such as healthcare access, nutrition, and sanitation, significantly affect death rates in different regions.
NO direct connection with development!!
Population Distribution
Describes how people are spread across the Earth's surface. This distribution is highly uneven, with certain areas being densely populated and others being sparsely inhabited. The patterns of population distribution are shaped by two main sets of factors: physical factors and human factors
Scale of Analysis
The geographical area or level of organization used to study and analyze data:
Global: Encompasses the entire world and ignores borders of countries
Regional: Focuses on large geographic areas or regions (e.g., West Africa, North America) where data is clumped
National: Focuses on a single country (France, Japan, Botswana)
Local: Focuses on a specific location within a country (e.g., a city, state, province).
Replacement Rate
Total fertility rate (TFR) needed for a population to maintain its size over time
A TFR of 2.1 children per woman is generally considered the replacement level, as it accounts for the fact that not all children survive to reproductive age, and there's a slightly higher number of males born than females
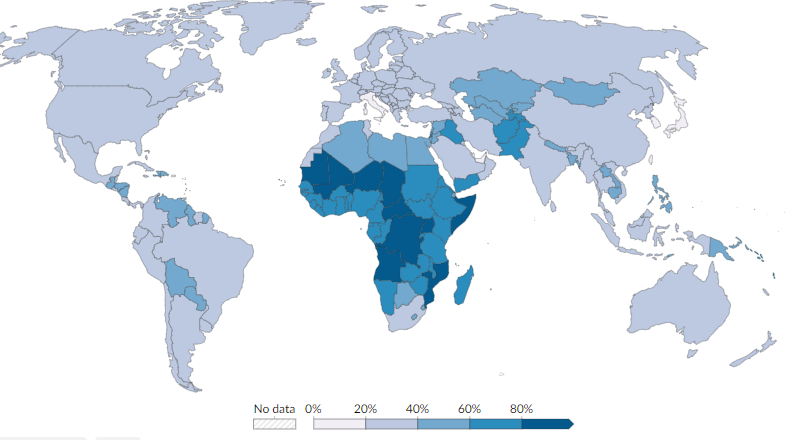
Infant Mortality Rate (IMR)
Number of deaths of infants under one year of age per 1,000 live births in a given year
Factors Influencing IMR
Access to Healthcare - countries with a high IMR lack sufficient medical facilities, skilled birth attendants, and access to prenatal and postnatal care for mothers and infants
Nutrition and Sanitation - malnutrition is both mothers and infants leading cause of death; poor sanitation and lack of access to clean drinking water are also a major cause
Socioeconomic Status - poverty is strongly correlated with a high IMR; lower-income families lack resources for proper nutrition, sanitation, and healthcare
Education - higher maternal education levels correlate with lower IMR, as educated mothers are more likely to seek healthcare and understand nutrition
Youth Dependency Ratio
Youth dependency ratio measures the number of young dependents (aged 0-14) for every 100 people in the working-age population (aged 15-64)
Economic Impact - working-age population must support a large number of children, which can strain resources and limit investment in economic development. Funds are often diverted to social services like education and healthcare for the young
Social and Political Impacts - high youth dependency ratio can create pressure on governments to provide more schools, teachers, and healthcare services
Elderly Dependency Ratio
The elderly dependency ratio measures the number of elderly dependents (aged 65 and older) for every 100 people in the working-age population (aged 15-64)
Economic Impact - creates a significant economic burden on the working population - can lead to increased taxes to fund social security, pensions, and healthcare services for the elderly
Strain on Social Services - An aging population puts immense pressure on a country's healthcare system and long-term care facilities
Labor Shortages - As a large segment of the population retires, there can be a shortage of skilled labor, which can impact productivity and innovation