Part 1: Inferential Statistics
1/19
There's no tags or description
Looks like no tags are added yet.
Name | Mastery | Learn | Test | Matching | Spaced |
|---|
No study sessions yet.
20 Terms
Inferential Statistics
Draws conclusion from data analyzed to make predictions or generalizations about a larger population.
Does the sample fully represents the population?
False, the sample does not truly represent the population because if you are given samples of a population, those population have different means, variances, standard dev, and etc.
But the aim of Inferential Statistics is to correct that statement, even it does not fully represent the population, we manipulate the data in a manner that is close enough to the true values of the population.
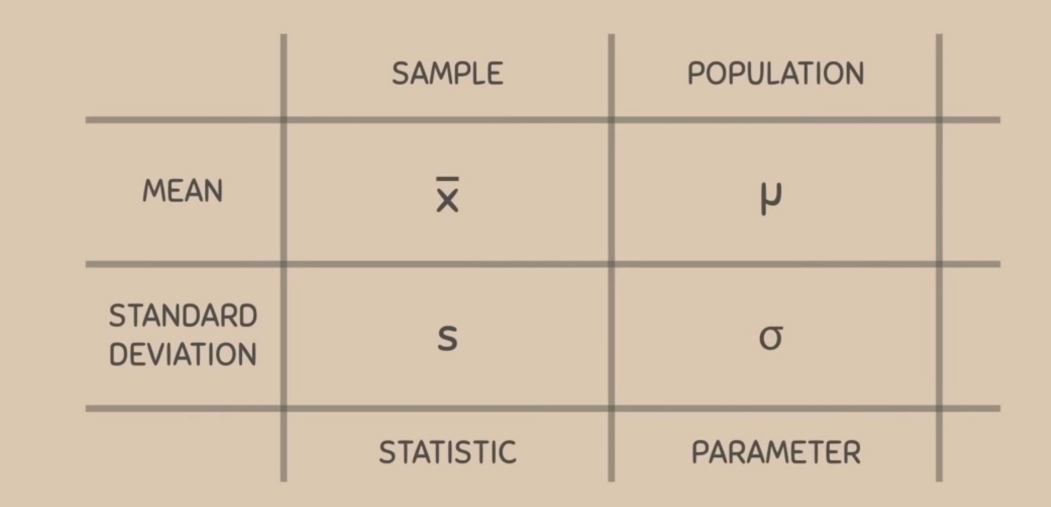
Parameter
A number that describes the data from a population
Statistic
A number that describes the data from a sample
Important Symbols
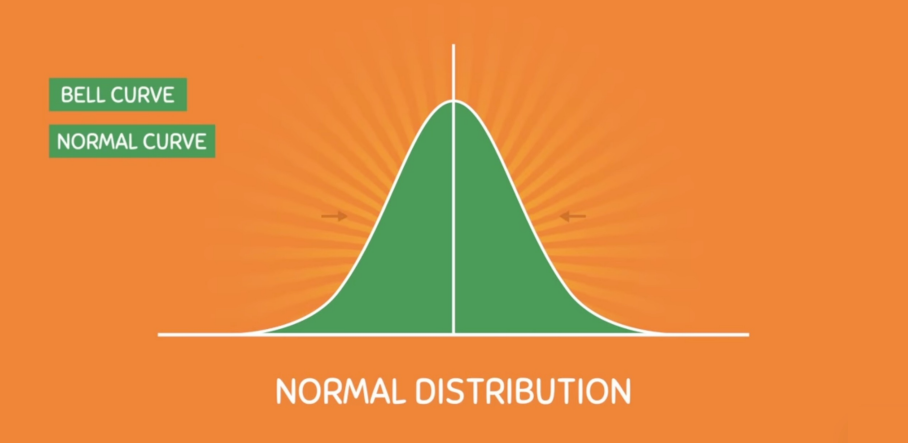
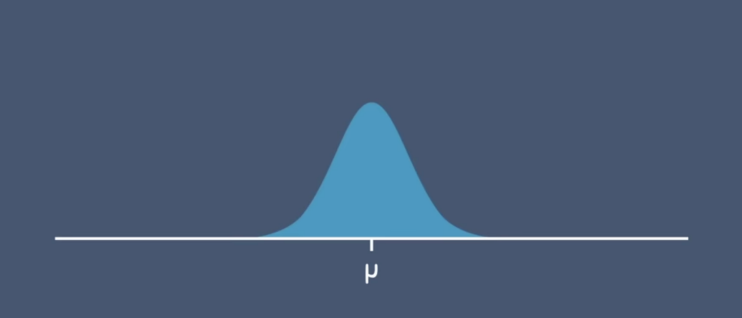
Normal Distribution
Where do you think the mean, median, mode are located?
What is the criteria for a normal or perfect curve?
Your mean, median, and mode must be equal.
They are located at the center vertical line, why?
If you recall, a number line that has -3, -2, -1, 0 1 2 3 , the 0 is always mean median mode, if you sum up all the positive and negative integers.
Now if your mean, median, mode are located there, where is the mode? aside from placing it at 0, where is it located?
Your mode is at the peak.
Because the peak of the curve tells you if your curve is, unimodal, bimodal or trimodal.
Question, this is a unimodal curve (picture), if we add another mountain or curve, what do you call the curve?
It becomes Bimodal.
Now, where is the mean median and mode located? assuming that your bimodal curve is symmetrical.
It is between the 2 modes.
But what if the curve is asymmetrical, where do you think is the median located? Supposing that our curve is positively skewed? (Right)
Mean median and mode are always equal, they will not separate, they are still in the same position. So it is still located in between the 2 modes.
Continuation
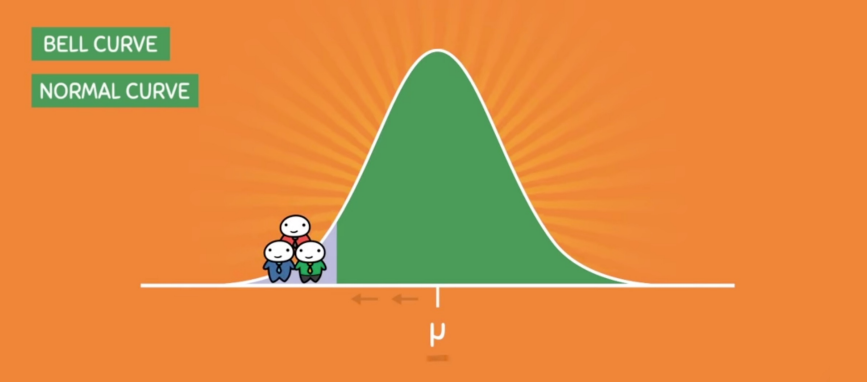
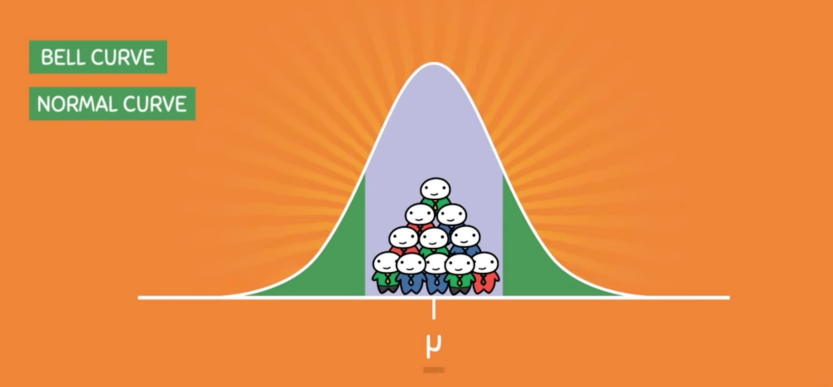
So when you divide your curve into 2, the curve is symmetric, because the sides are equal, now when you see data clustering at either ends of the curve, what do you call this data?
In the picture, where do you think are they located? In or out? Out, when you say area inside or under the curve, this is the big portion, when you look at this data, they are now on both ends, they are outside.
They are called as Outliers.
Area under the curve
This is the Area under the curve, it is always at the middle
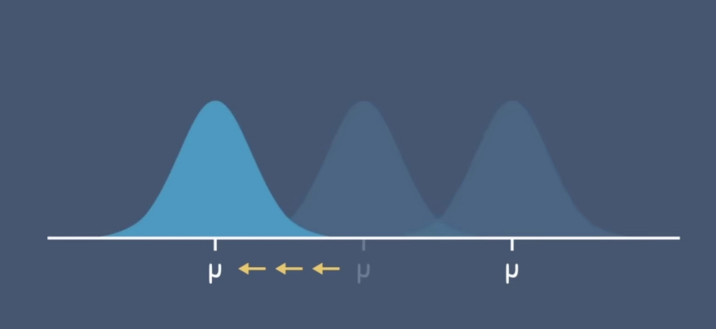
Population Mean
Characterizes the position of the normal distribution.
It is relative to the positiveness and negativeness of the number line.
Take note your population mean is always located at where 0 is located.
Continuation
But when you see this one, your population mean moved to the left, so what side is it on?
Negative (Less than)
Or on the right (Positive) (Greater Than)
Your true population mean is lying at the middle
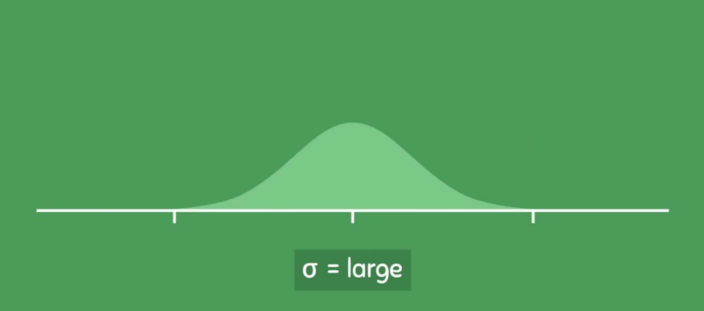
Population Standard Deviation
Characterizes the spread of the normal distribution
Continuation
This is a curve with a larger sigma (population standard deviation)
We can see that it is much wider
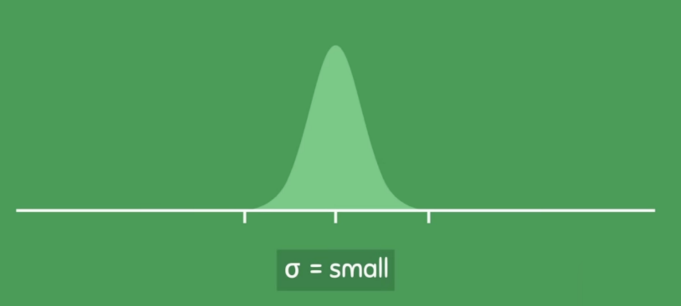
Continuation
This is a curve with a smaller sigma (PSD)
It became narrower
So what relationship that can we establish with this one?
The Larger the SD, the Wider the curve.
The Smaller the SD, the Narrower the curve.
Therefore, we can say sigma is proportional to the width.
Continuation
Now if this is our normal curve, and our total area is said to be 100% equivalent to 1.0.
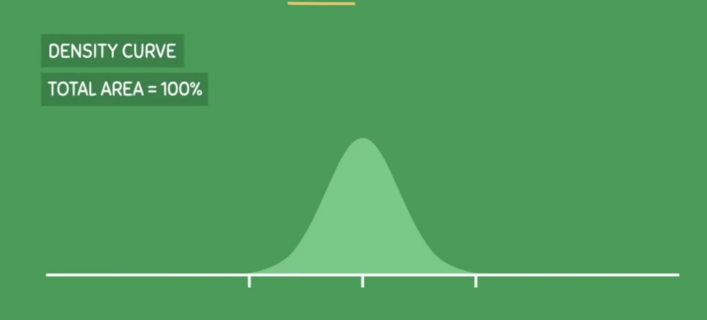
Criteria for perfect curve
The normal distribution is unimodal
Unimodal because, it only has one mode.
And are always equal MMM
The normal curve is symmetric about its mean
The parameters μ (population mean) and σ (population standard deviation) are completely characterize the normal distribution.
How do they characterize the normal distribution?
Population mean characterizes = position
Population standard deviation characterizes = spread
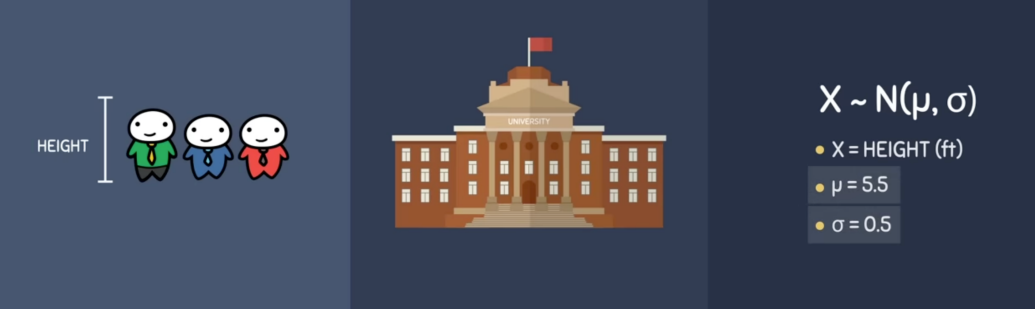
X ~ N (μ, σ)
X follows a normal distribution with a mean (μ) and a standard deviation (σ).
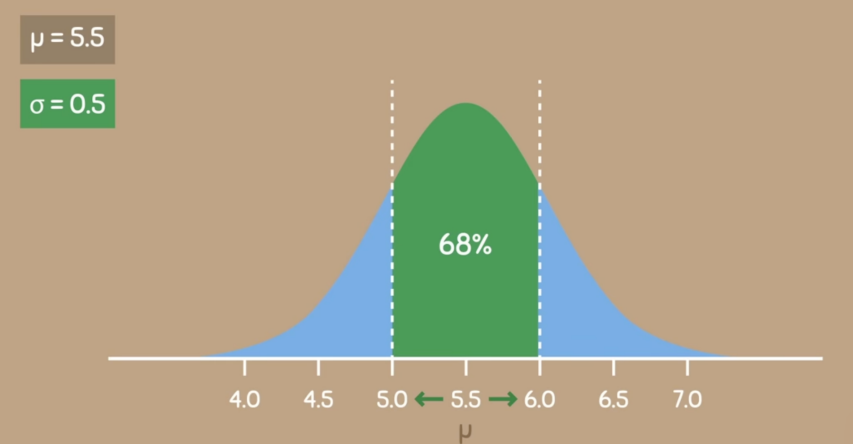
68-95-99 Rule
Supposed that you are asked to determine the average height of all students in RTR.
And you found out the mean height of all students is 5.5 ft, and you are able to calculate that they have a standard deviation of 0.5 ft
Continuation
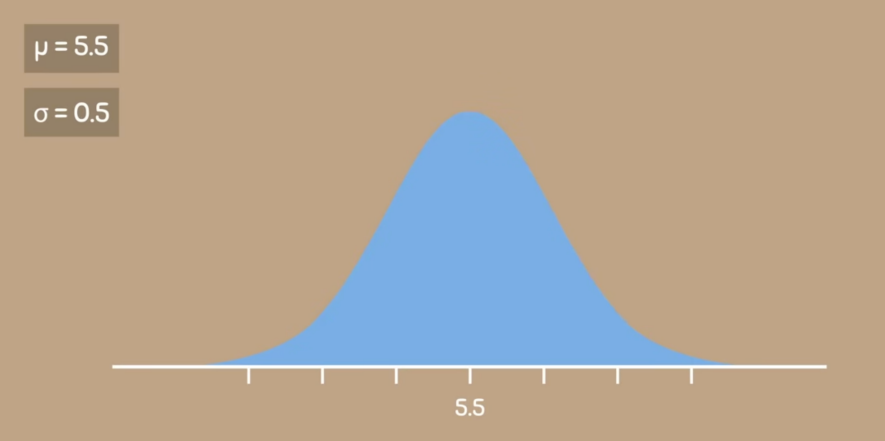
Let us make a curve, in making a curve, you only make use of two values;
Mean
Standard Deviation
we may use population mean if we are talking about population, but this time we are talking about all students, therefore we will use population.
You will make a standard curve using a sample mean if your talking about the sample mean, but make sure you are using the sample standard deviation, because you are talking about the sample.
Based on this curve, where is the Mean located?
Always at the front
Continuation
If your mean is 5.5 and your SD is 0.5, you will be able to draw this, what did you observe? What happened to 0.5, what is the significance of 0.5?
it is the one that adds up to the right and minus at the left.
If there is like a +1 +2 +3 or -1 -2 -3 numbers, you call them as Deviations from the SD.
When you say deviation, it tells you how far your values are from the SD.
Our SD here is 0.5
Continuation
If we are talking about the Area under standard deviation it is 99.
Total area under the curve is 1.0.
the 1 remaining is called the outlier
68,95,99 rule is also known as?
Empirical rule
Read
For the practice questions please refer to the youtube video