Notations
 Call Kai
 Learn
Learn Practice Test
 Spaced Repetition
 Match
Match Flashcards
 Knowt Play
 Podcast
1/32

There's no tags or description
Looks like no tags are added yet.
Name | Mastery | Learn | Test | Matching | Spaced | Call with Kai | Chat |
|---|
No analytics yet
Send a link to your students to track their progress
33 Terms
Notations (Symbols)
Notation is simply a set of symbols or letters that statisticians use as a shorthand way to represent numbers, values, or ideas. Instead of writing out "the average of the sample" every time, they use a symbol like x. Notation makes formulas shorter, easier to read, and easier to work with. For example:
n usually means the sample size (the number of people or observations in your sample).
N means the population size.
xˉ means the sample mean (average).
p often represents a population proportion.
Think of statistical notation like mathematical abbreviations: once you learn what the symbols mean, you can read and understand statistical formulas much more quickly. There are many in statistics, but they can be grouped into a few common categories.
Sample Notation (Different Types)
These describe a sample taken from the population.
n = Sample size
xˉ = Sample mean (average)
p^ = Sample proportion
s = Sample standard deviation
s2 = Sample variance
Example: If you survey 100 students from the university, 100 is n.
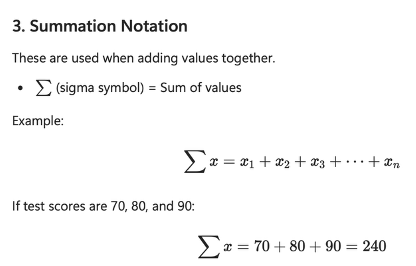
Summation Notation
These are used when adding values together.
∑ (sigma symbol) = Sum of values.
∏ = Product of terms.
Probability Notation
Standard mathematical way of writing probabilities and events.
P(A) = Probability of event A occurring.
If a weather forecaster says there is a 30% of rain, this is a 30% chance of probability.
P(A∣B) = Probability of A given B.
Conditional probability that measures the chance of something else happening after we know something has happened.
P(A∩B)= Probability of A and B. Events that are happening at the same time.
P(A∪B)= Probability of A or B, or both happen.
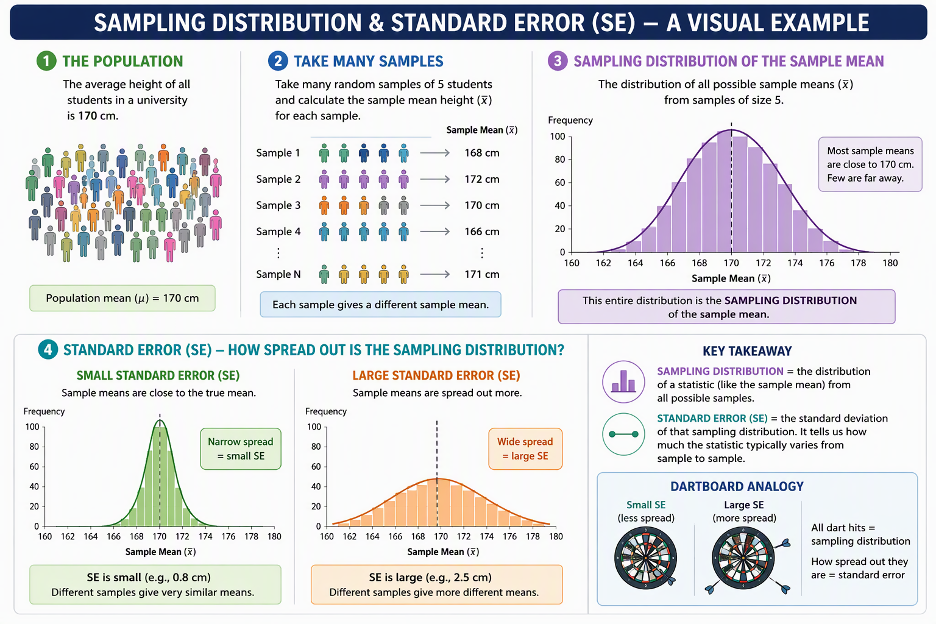
Standard Distribution and Sampling Error Real World Example
Suppose a poll asks 100 people whether they support a policy.
One sample might give: 52% support, another 48% support, another 55% support.
The percentage changes because different people were selected.
The collection of all possible poll results forms the sampling distribution.
The typical amount those poll results vary is the standard error.
Remember it like:
Sampling Distribution: If I kept taking samples over and over, what results would I get?
Standard Error: How spread out would those results be?
Standard Error and Sampling Distribution Notation
Sampling distribution means the distribution of a statistic across all possible samples. A sampling distribution shows all the values a statistic (such as a sample mean or sample proportion) could take from repeated samples.
Standard error (SE) means the standard deviation of that sampling distribution. Tells us how much a statistic usually changes from sample to sample (small or large), within that surveyed sample.
SE = Standard Error
μxˉ= Mean of the sampling distribution
σx = Standard deviation of the sampling distribution
These are used when studying how sample statistics vary from sample to sample.
Hypothesis Testing Notation
Specific symbols are used to represent hypotheses, test statistics, significance levels, and decision rules. Helps statisticians state assumptions clearly, organize calculations, and make decisions using data.
Null Hypothesis (H0): The null hypothesis represents the status quo or no effect.
α = Significance level (often 0.05)
p-value = Probability used to evaluate evidence against H0
z = Z-test statistic
t = T-test statistic
x2 = Chi-square statistic
Trick to Remember Different Notations
A common trick is (GR):
Population = Greek letters
μ, σ, p
Sample = Roman letters
xˉ, s, p^, n
10 Important Symbols
x = value
xˉ = sample mean
μ = population mean
s = sample standard deviation
σ = population standard deviation
n = sample size
N = population size
p^= sample proportion
p = population proportion
∑ = summation
P(A) = probability of event A
Population Notation (Various Types)
These describe the entire population you're interested in. Often we do not know the entire population mean, so we use the sample sizes.
N = Population size
n = Sample size
μ (mu) = Population mean (average)
p = Population proportion
σ (sigma) = Population standard deviation
σ2 = Population variance
Example: If you're studying all 5,000 students at a university, 5,000 is N.
Symbol | Meaning |
|---|---|
N | Population size |
μ | Population mean |
σ | Population standard deviation |
σ2 | Population variance |
P | Population proportion |
N =
Population Notation
Population notations describe the entire size of the population that someone is interested in looking at and studying.
Capital N represents the size of the population, or the total number of individuals/items in the population.
Examples:
A school has 1,200 students. Then N = 1200.
A company has 85 employees. Then N = 85.
Easy way to remember
Population = everyone you're interested in studying.
N = how many members are in that population.
μ
Population Notation
The population mean, which is the average of the entire population. Population average (mean). The center (average).
Suppose the ages of everyone in a small population are: 10, 12, 14, 16, 18.
Add them up 10 + 12 + 14 + 16 + 18 = 70
Divide them by the total number of people (N = 5)
So the μ = 14
σ
Population Notation
The population standard deviation. σ tells you how spread out the data are from the population average (μ). The spread (how far values are from the average).
Suppose the test scores are: 50, 50, 50, 50, 50
The average (μ) is 50.
Everyone has the same score.
There is no spread.
So σ = 0
Or supposed that the scores are 10, 30, 50, 70, 90.
The average (μ) is still 50.
But the scores are spread out much more. So the σ is larger.
σ2
Population Notation
Means the population variance. Can also be called variability or variance. To measure how spread out the population data are around the average, helping us understand consistency and differences within the population.
σ² = population variance
σ = population standard deviation
The relationship is: σ2 = (σ)2. So variance is simply the standard deviation squared.
If the population standard deviation is: σ = 4
Then the population variance is: σ2 = 4(2) squared = 16
P
Population Notation
P most commonly stands for population proportion. A proportion is the fraction or percentage of the population that has a certain characteristic.
Suppose a school has N = 1,000 students.
600 students play sports.
The population proportion is:
P = 600 divided by 1000 = 0.60 (or 60%)
P = 0.60 means 60% of the population has the characteristic being studied (they play sports).
n
Sample Notation
This means sample size. Looking at how many people or units are in your sample over the entire population.
Example you survey 100 students. n= 100.
Can remember it from
n = number in the sample.
x̄ (x-bar)
Sample Notation
This refers to a sample size mean. So the average of a specific sample size.
Example: Five students scored 70, 80, 90, 60, 100.
The average is 70 + 80 + 90 + 60 + 100 divided by 5 = 80.
x̄ = 80
Memory trick: x̄ = sample average
p̂ (p-hat)
Sample Notation
This means the percentage or fraction of the sample size with a certain characteristic. Sample proportion, using a specific segment of people (e.g. playing sports, age, eye colour, ethnicity, etc).
Example: You survey 100 students. 40 play sports.
p = 40 divided 100 = 0.40 (or 40%).
Memory trick: Proportion in the sample.
s
Sample Size
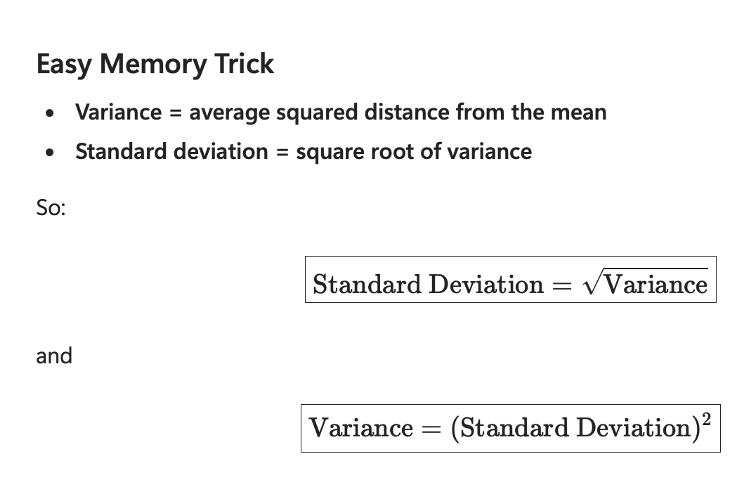
Sample standard deviation, is the typical distance from the mean. Understanding how spread out the sample values are around the sample average. It is the squared root of variance. Standard deviation is usually the final answer that people care about.
Example:
Scores: 78, 79, 80, 81, 82 → small spread → small s
Scores: 20, 50, 80, 110, 140 → large spread → large s
Easy memory trick: s = spread of the sample
s²
Notation Sample
Sample variance, which is another measure of spread. The average squared difference from the mean.
Think of variance like the working calculation, and standard deviation as the final answer.
For example, if heights are measured in centimeters:
Variance = 25 cm
Standard deviation = 5 cm
Saying people are typically 5 cm from the average height makes much more sense than saying 25 cm².
It is simply:
It is s2=(s)2
If s=4
Then s2=16
Easy memory trick: s² = spread squared
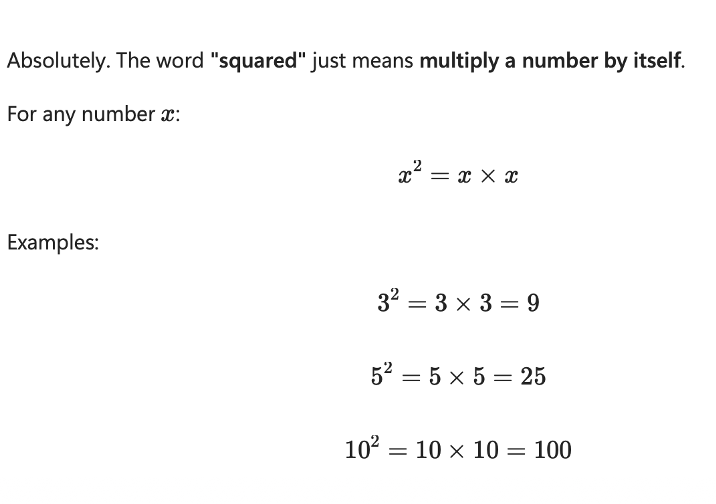
What does squared s2 mean?
This simply mean that the number is multiplied by itself (squared).
P(A)
Probability Notation
What the probability of event A occurring is.
Example:
Event A = "It rains tomorrow"
P(A) = 0.30
There is a 30% chance it will rain tomorrow.
P (A | B)
Probability Notation
The probability of A given B. The chance that A happens if you already know that B happened.
A = "A person has brown eyes"
B = "The person is a student"
P (A |B) means: What is the probability a person has brown eyes, given that they're a student?
P(A ∩ B)
Probability Notation
The symbol ∩ means "and." The chance that both events happen. ∩ looks like two groups overlapping = AND. Count only the overlap in the set that appears.
To satisfy A and B, a number must be in both sets at the same time. Find the numbers that appear both times in the set that are meeting the conditions asked for.
Example:
A = "Rolling an even number"
B = "Rolling a number greater than 3"
The numbers on the die are 1, 2, 3, 4, 5, 6
Even numbers are 2, 4, 6
Numbers greater than 3 (4, 5, 6)
Both conditions (4, 6)
A={2,4,6}
B={4,5,6}
This was done by looking for the numbers (events that appear in both sets).
So P(A∩B) = 2/6 = 1/3
P(A ∪ B)
Probability Notation
Probability of A or B. The change that A happens, B happens or both happen. For OR, a number only has to be in at least one of the sets. Count everything in either set.
The symbol ∪ means "or." ∪ looks like a cup holding both groups together = OR Example:
A = "Rolling an even number"
B = "Rolling a number greater than 4"
Even numbers: 2, 4, 6
Greater than 4: 5, 6
A or B: 2, 4, 5, 6
That is 4 outcomes out of 6.
P(A∪B) = 4/6 =0.667 2/3
Sample Deviation Calculator Steps
Click Mode. Click 1 (for stat), Click 2 for SD (Standard Deviation).
Enter Data (e.g. 2 M+, 4 M+, 8 M+, 10 M+, 16 M+). Click M+ after every number.
Click the blue RCL (recall) button.
Click what you are looking for (x, sx, n).
For n click RCL n. You would get 5.
After click RCL, ˉx and you get 8.
Then RCL sx and get 5.48.
To clear the data for a new question click 2nd F and CA (or mode to clear).
Check it is cleared through clicking RCL n again.
Fraction Calculator Steps
Input a number (4).
Click a b/c grey button. r will show up for fraction.
Click another number (5).
Click = to get the most simplified fraction number.
H0
Hypothesis Testing Notation
This is a null hypothesis, which is the statement that you assume is true at the beginning.
Example a candy company claims that the average weight of a candy bar is 50g.
So the H0: μ = 50
This means that “We believe the average candy bar weight is 50 g until evidence suggests otherwise."
α
Hypothesis Notation Testing
This is the significance level that tells us how much evidence that we need before we rejects the H0 (null hypothesis).
The most common value is:
α=0.05. This means that we are willing to be wrong 5% of the time.
Imagine you're a judge.
H0 = "The defendant is innocent."
α = 0.05
You need strong evidence before declaring them guilty.
p-value
Hypothesis Testing
A number that helps you decide whether the results of a study or experiment are likely due to chance or whether there is evidence of a real effect.
Measures how surprising are my results if the null hypothesis is actually true?
Small p-value = strong evidence against H0
Large p-value = weak evidence against H0
For example: Suppose that the p = 0.02.
"If H0 were true, there would only be a 2% chance of getting results this extreme."
0.02 < (less than) 0.05.
We reject the H0, because the evidence is strong enough.
z-Statistic
Hypothesis Testing
A z-score tells us how far a sample result is from what the null hypothesis predicts. The farther z is from 0, the stronger the evidence against H0. Tells you how many standard deviations a value is away from the mean.
Used when the population standard deviation (σ) is known.
Claimed average = 50g
Sample average = 55g
The z-statistic measures “How unusual is 55 compared to 50?”
Suppose z = 0.5. That is close to the claim, not much evidence.
But if z = 4.5 that is very far away, so there is lots of evidence against the H0.
t-statistic
Hypothesis Testing
The t-statistic works very much like the z-statistic. However, t uses the sample standard deviation s, z uses the population standard deviation σ. sed when the population standard deviation is unknown and must be estimated from the sample.
The sample size is small.
The population standard deviation is unknown.
Example:
Suppose that t = 0.8 Not much evidence.
Suppose that t = 3.5. Stronger evidence against the H0.
Easy Memory Trick
Big sample → often use z
Small sample → often use t
Chi-Square Statistic (x2)
Chi-square is used when we're working with:
Categories
Counts
Frequencies
It helps answer “are these differences due to random change, or is the due unfair?”
A large x2 value means the observed results are very different from what was expected.