Chapter 16 Community Structure....Chapter 17 – Factors Influencing the Structure of Communities...Chapter 18 Community Dynamics....
Community
A group of species inhabiting a given area and interacting, directly or indirectly.
Biotic community
Naturally occurring assemblages of multiple species occupying the same environment/habitats and interacting (directly/indirectly).
Community attributes
Diversity, productivity, and trophic structure.
Diversity (in reference to attributes of community)
# of species, relative abundance
Productivity (in reference to attributes of community)
Primary = Autotrophs (plant)
Secondary = Heterotrophs (animal, microbe)
Trophic Structure (in reference to attributes of community)
# levels, food webs
Communities can be characterized by…
Species
2 components of diversity
Species richness and relative abundance
Species richness (in reference to diversity)
#’s of species
Relative abundance (in reference to diversity)
Represents the % each species contributes to the total # of individuals of all species
Represented by pi = ni/N
pi = ni/N
Relative abundance equation used to calculate the proportion of each species' individuals relative to the total number of individuals in a community.
pi = ni/N… what’s pi?
proportion of individuals of species i in relation to the total number of individuals in the community.
pi = ni/N… what’s ni?
number of individuals of species i.
pi = ni/N… what is N?
total number of individuals of all species
Species are listed by rank abundance…
most to least
Comparing patterns of species richness and abundance is to…
plot the relative abundance (x-axis) of each species against rank abundance (y-axis)
Rank-abundance diagram
Indication of species evenness
Species eveness
indicates the distribution of individuals among the total species.
With rank abundance curves… the _ the curve, the _ the species richness in the community
longer, greater
With rank abundance curves…the _ gradual the slope, the _ the species evenness in this community.
more, greater
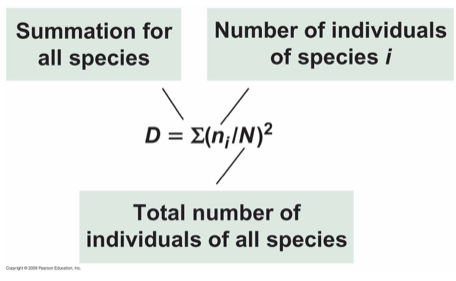
Simpson’s Diversity Index (D)
Is a measure of the relationship between the number of different species in a habitat (species richness) and the number of individuals within each species (species evenness).
-Higher values indicate lower diversity.
-Lowest value is zero, highest is 1.
Simpson’s Diversity Index (D) Equation
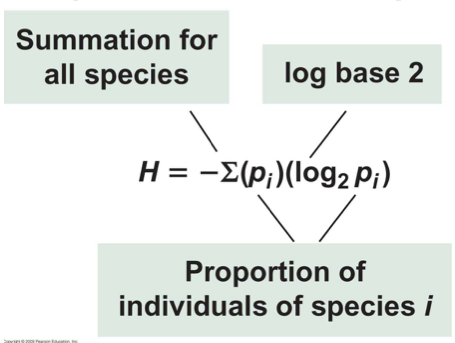
Shannon-Weiner Diversity Index (H) equation
Is a measure of diversity in a community, taking into account both the number of species present (richness) and how evenly distributed individuals are among those species (evenness).
-Higher values of "H" indicate greater diversity, while a value close to zero suggests a community dominated by a single species.
Evenness (EH)
describes the similarity of species’ abundances… does each species have similar # individuals within the community?
Equation for Evenness (EH)
EH = H/Hmax
EH represents the "Shannon's Evenness" (or equitability) which is calculated by dividing the Shannon diversity index (H) by the maximum possible Shannon diversity value for a given number of species (Hmax)
Dominants
Single or few species predominant in a community. Has the most #’s (abundance), occupies the most space, and has the greatest biomass.
The basic Simpson index, D, is often used to measure…
dominance
-D = 1, only one species is present, so there is no species diversity in the community
Keystone Species
Species of low biomass or abundance that disproportionately influence the community.
Their effect is much greater and disproportionate to their numerical abundance.
Food chain
a descriptive diagram representing the flow of energy from the prey (consumed) to the predator (consumer)
Food Web
a diagram representing the complex interactions of predators and prey.
-characterized by the number of links relative to the number of nodes (species)
Linkage Density
# links / nodes (species)
Trophic Levels
Broader categories that represent general feeding groups, based on the source from which they derive energy.
(Autotrophs/primary producers and heterotrophs/secondary producers)
Guilds
Groups of species that exploit a common resource - potential for strong interactions.
Ex: Nectar-feeding or seed-eating birds
Functional Type
Group of species based on their common response to the environment.
Ex: Plants grouped into C3, C4, and CAM.
Zonation
Communities with multiple vertical/horizontal structures that can change. Is the spatial distribution of species in a specific habitat
Terrestrial zonation is determined by…
life forms of plants
Aquatic zonation is determined by…
by physical/chemical features
Ex: lentic vs. lotic, Heterotrophic layer (carbon utilization), Autotrophic layer (photosynthesis)
Association
A type of community with:
-Relatively consistent species composition
-A uniform, general appearance (physiognomy)
-A distribution that is characteristic of a particular habitat.
Organismal Concept
Community = integrated unit (super-organism)
-Each species is a component of the whole
-Is due to strong evolved interactions of species
-Development of a community was viewed as similar to development of the organism.
Individualistic Concept
-Organisms are independent from one another.
-Transitions are gradual and hard to identify
-Co-occurrence of species is due to similarity in requirements and tolerances.
Sorensen’s Coefficient of Community (CC)
Is based on species presence or absence
-Requires a list of species for two sites or sample plots getting compared.
Sorensen’s Coefficient of Community (CC) equation
CC = 2c/(s1 + s2)
2c =. number of species common to both sites
s1 = number of species in community 1
s2 = number of species in community 2
Fundamental niche
Range of environmental conditions define a species.
Realized niche
Constraints (e.g., competition) will limit distribution and abundance.
Direct Interactions
Occur immediately between 2 species, such as predator and prey.
Indirect Interactions
Require a third species as an intermediate between the 2 species.
Apparent Competition
a type of indirect competition that occurs when two species that don't directly compete for resources affect each other through a shared predator
Muller and Godfray (1997)
Explored the concept of "apparent competition" between two aphid species, demonstrating how shared natural enemies can indirectly influence the population dynamics of different aphid species within an ecosystem, even if they don't directly compete for resources.
Grass fertilization benefitted grass aphids and ladybugs predators, but reduced nettle aphids through apparent competition
As environmental conditions change so does…
time and space
Trophic cascades affect community structure from the…
top-down
Succession
Progressive changes in community structure through time in response to the environment.
As the environmental conditions change (time and space), how does it impact species?
-Changes in distribution and abundance
-Shifts to more tolerant species
-Shifts in various species interactions
Sere
the sequence of communities seen in succession, from grass to shrub to forest.
Seral Stages
vegetative zones in time
Climax stage
Last stage of succession; mature community. Some systems never reach the climax stage.
Early successional species/Pioneer species
are species that commence the succession process by first colonization (opportunistic). Often have: high growth rates, small, high degree of dispersal and colonization, and high rates of per capita population growth.
Late succesional species
Are not the first to colonize, and require other species to facilitate their own colonization in a community. Often have: longer lifespan, larger size, lower rates of dispersal and colonization, and lower rates of per capita population growth.
Primary Succession
occurs at a location that was not previously occupied by a community; a newly exposed surface… caused by volcanic activity, glaciers, etc.
Secondary Succession
Occurs at a location that was previously occupied by a community. Ex: abandoned farmland, after wildfires, etc.
R (ruderal)
species that can rapidly colonize disturbed sites. Small, short-lived, resources allocated mainly to reproduction.
C (competitive)
species that live in predictable habitats with abundant resources. Resources are allocated mainly to growth, favoring resource acquisition and competitive ability.
S (Stress)
species that are stress-tolerant. Resources are allocated mainly to maintenance, characteristic of habitats with limited resources. Can survive harsh conditions with low resource availability
Autogenic
Results from organism activities. Ex: Tree growth reduces light availability.
Allogenic
Independent of organisms. Ex: decline in temperature with increased elevation.
Intermediate disturbance hypothesis
The highest species diversity is seen at intermediate frequencies of disturbance.
Hydrarch Succession
Involves a switch from open lake to forest over long time periods.
All ecosystems consist of 3 basic components
Autotrophs, heterotrophs, and abiotic matter… the driving force is the sun’s energy.
First law of thermodynamics
Energy cannot be created or destroyed, but is converted from one form to another.
Second law of thermodynamics
Every energy transformation results in a reduction of the usable (free) energy of the system.
Gross primary productivity (GPP)
is the total rate of photosynthesis (energy assimilated) by autotrophs – also referred to as total photosynthesis.
Net Primary Productivity (NPP)
is the rate of energy storage as organic molecules after energy is expended for cellular respiration (R)
NPP = GPP - R
Productivity (or rate of production)
is usually expressed in units of energy per unit area per unit time. kilocalories per square meter per year (kcal/m2/yr)
Biomass
amount of organic matter present
Standing Crop Biomass
total amount of biomass per unit area
(expressed as grams of organic matter per square meter (g/m2)
Net Primary Productivity commonly measured by estimating the change in…
standing crop biomass (SCB) over a given time interval.
NPP = ∆SCB = SCB(t2) – SCB(t1)
Error in Estimate
losses during the time interval
NPP = ∆SCB + D + C
Death of plants (D)
Consumption by consumer (C)
Secondary production and productivity
Growth and reproduction (e.g., g / m2 / yr)
Fate of energy (from plants) varies once consumed by…
-Passes from the body as waste products
-Spent on maintenance (respiration)
-Allocated to growth and reproduction
-Some lost to metabolic heat
NPP (Net Primary Productivity) increases with…
mean annual precipitation and temperature (directly related to annual solar radiation)
Temperature and precipitation influence each other how?
-Warm temperatures = increased evaporation/transpiration rates (highest NPP)
-Low temperatures = Productivity low
Actual Evapotranspiration (AET)
The combined value of surface evaporation and transpiration.
Assimilation Efficiency
Ratio of assimilation to ingestion (A/I)
Ingested (I) Assimilated (A) and Expelled (W)
Production Efficiency
Ratio of production to assimilation (P/A)
Assimilated (A) Respiration (R) and Biomass Production (P)
Assimilation Efficiency (A/I) measures…
measures the efficiency of extracting energy from food
Production efficiency (P/A) measures…
how efficiently assimilated energy is incorporated into secondary production
Production Efficiency (P/A), why do ectotherms have more efficient energy use over endotherms?
Ectotherms rely on external heat sources to regulate their body temperature. Not internal metabolic processes.
Endotherms are having to maintain homeostasis
-Also, smaller body sizes have lower P/A due to higher proportional losses to metabolism
Assimilation Efficiency (A/I) ectotherms vs endotherms
Endotherms > ectotherms
Endotherms must have higher (A/I) to support faster metabolic rates (to generate heat). Often associated with complex guts.
-Animal tissue is easier to digest and assimilate compared to plant tissue.
Feeding relationships are defined in terms of…
trophic or consumer levels
Grazing Food Chain
Source of energy for the herbivores is living plant biomass (NPP).
Detrital Food Chain
Source of energy for the decomposers is dead organic matter or detritus
Ex: earthworms, fungi, bacteria
Processes involved in secondary production
consumption, ingestion, assimilation, respiration, and production
Energy available to a given trophic level (Pn) is…
the production of the next-lower level (Pn-1)
Trophic Efficiency (TE)
Measures the transfer to energy between trophic levels.
TE = Pn/Pn-1
-Generally, trophic transfer efficiency is 10%.
Nutrient Cycling
the process by which nutrients move between living and non-living parts of an ecosystem
Ecosystem energy flow
the movement of energy through an ecosystem, starting from the primary producers
Oxidation State
Loss of electrons
Mineralization
Is the breakdown (i.e. oxidation) of organic compounds by microbial decomposers, whereby the elements (C, N, etc.) in those compounds are released as their inorganic forms.
Immobilization
-Mineralization is the opposite
-Inorganic compounds are taken up and incorporated (i.e. reduced) into organic compounds
Humus/soil organic matter
dark homogenous organic matter; humus embedded in the soil matrix.
Particulate Organic Matter, POM
Dead organisms and other organic material, drifts towards the bottom