Spreadsheet Applications 📈
1/35
Earn XP
Description and Tags
GCSE CCEA Specification GCSE Digital Technology Unit 1: Digital Technology (Core)
Name | Mastery | Learn | Test | Matching | Spaced | Call with Kai | Chat |
|---|
No analytics yet
Send a link to your students to track their progress
36 Terms
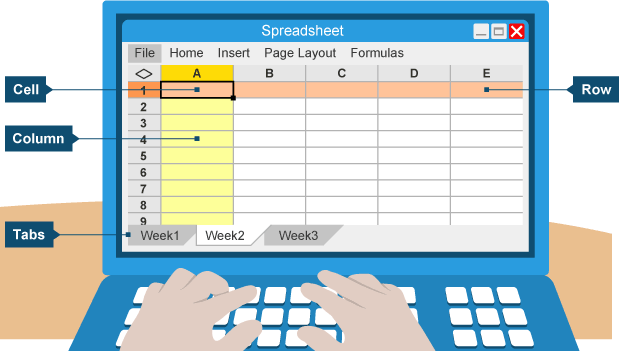
Spreadsheet
application containing worksheets, presented as a grid of cells that are arranged in columns (letters) and rows (numbers)
Use of spreadsheets
perform calculations and recalculations automatically using formulas or functions to process and display information
Data types
text, number, date, formula, boolean
Formulas
mathematical equation or expression to perform calculations on data within cells
Data formatting
structuring data according to guidelines so it’s easier to analyse, understand and present correctly
How can formatting affect appearance of cells
aligning text, font, borders, background colours, merge and centre, text wrapping

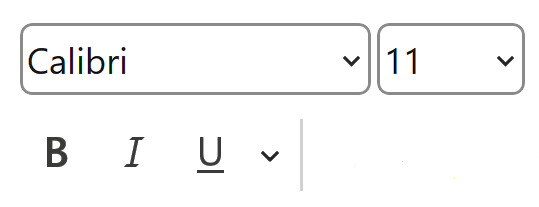
Font
allow changing of font type, size and style
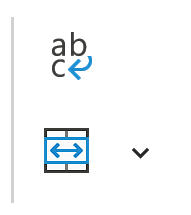
Text wrapping
ensure text fits within its cell and does not overflow (multiple lines)

Merge and centre
combine one or more cells and align the text in the middle
Sheet tabs
able to insert, rename or move sheet tabs

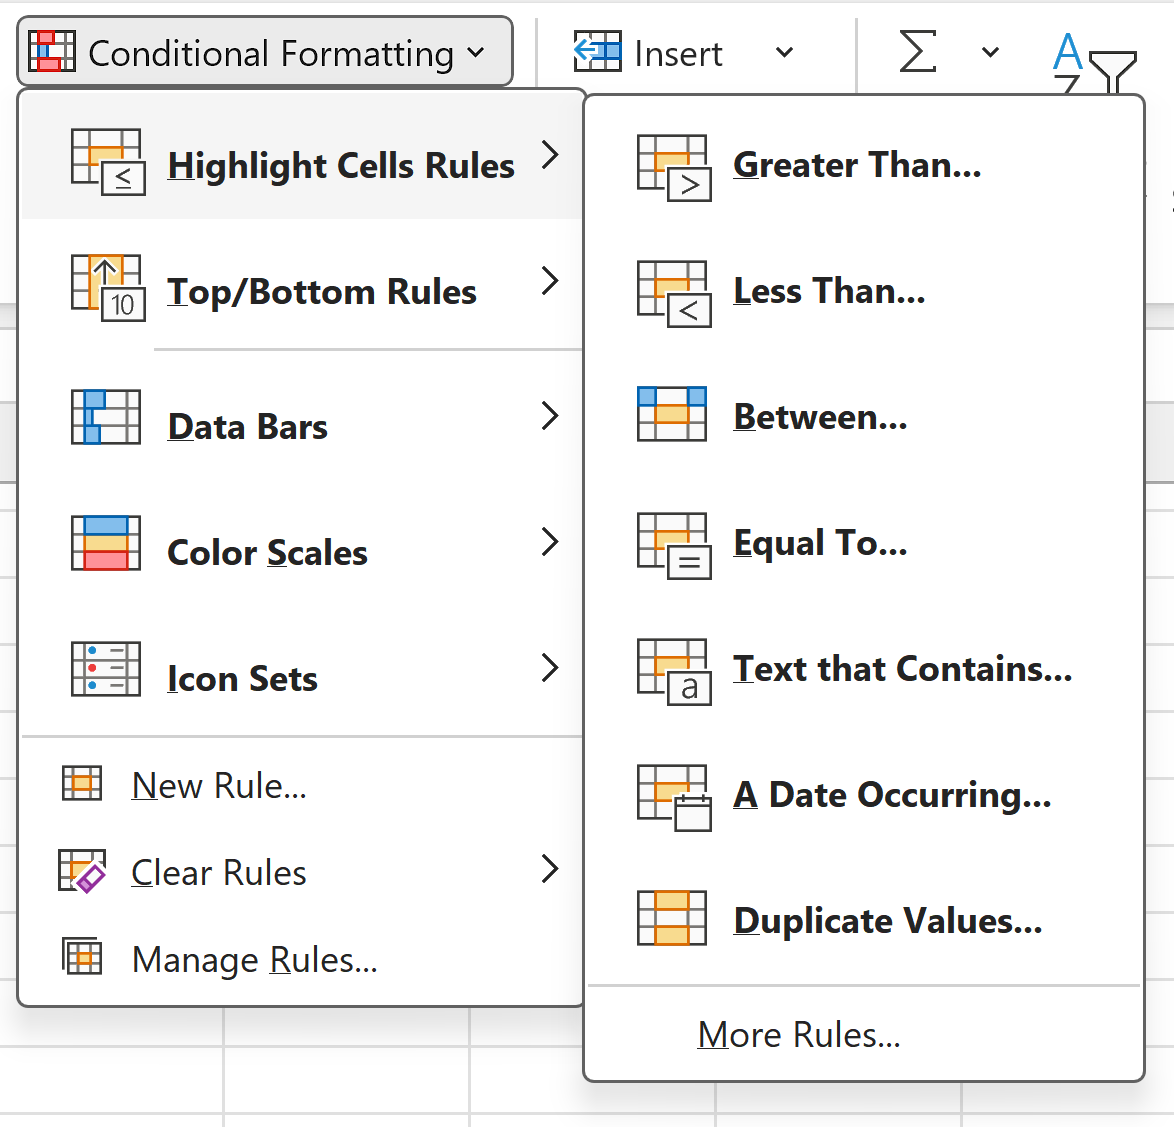
Conditional formatting
allows changing of cell appearance if specific condition is met
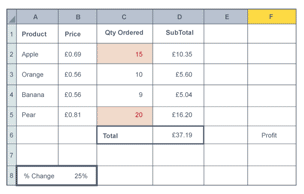
e.g conditional formatting > highlight cell rules > greater than > 60 > style
Template
document preformatted with a layout to serve as a starting point

Importing data
allows data from other applications to be used in spreadsheets
Headers and footers
improves presentation worksheets by adding page numbers, filenames or dates
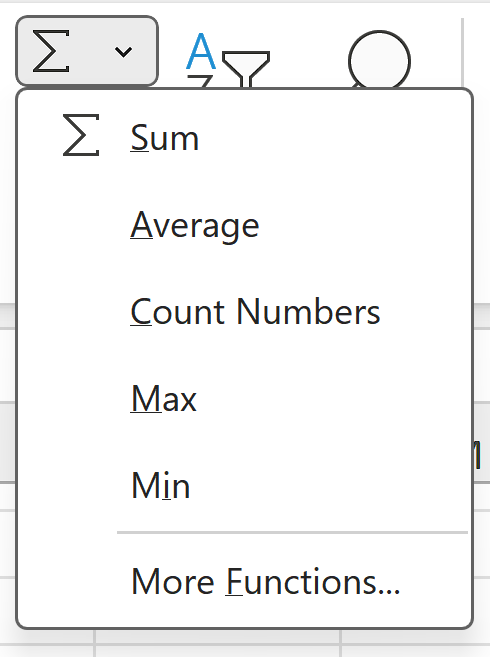
Functions
used in formulas to perform specific tasks and return a value e.g
Referencing cell ranges
must be contained within brackets and use a colon e.g (A1:A5)
Autosum
adds a range of cells e.g
=SUM(A1:A10)
Average
finds the average from range of cells e.g
=AVERAGE(A1:A10)
Maximum/ minimum
find the highest or lowest value from a range of cells e.g
=MAX(A1:A10)
=MIN(A1:A10)
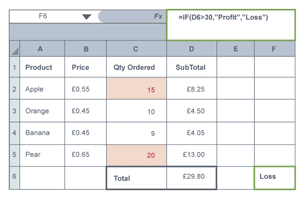
IF statement
examines a condition to see if it’s true or false and returns value e.g
=IF(Evaluate Condition, Return this if true, Return this if false)
=IF(A1>60,”PASS”,”FAIL”)
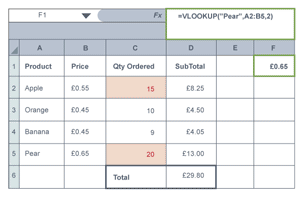
Vlookup function
uses value in selected cell to ‘lookup’ match in a table and return corresponding value from the same row
e.g =VLOOKUP(value, range with match, column with return value)
Replicating cells (fill function)
allows data in cells to be easily and quickly copied down columns or across rows, usually dragging corner
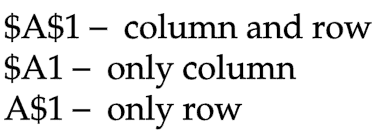
Relative cell reference
will adjust and change cell reference when replicating/ copying down depending on location when replicated
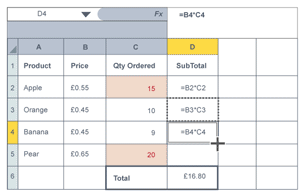
Absolute cell reference
will keep cell reference the same when replicating/ copying down so it refers to correct cells
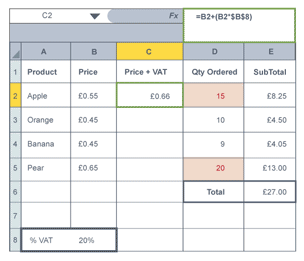
Using absolute cell references
Place a $ before value that will not change
Charts
communicate information as visual representation, easier to understand
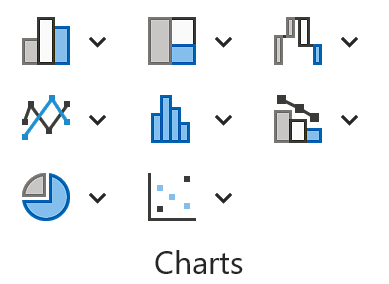
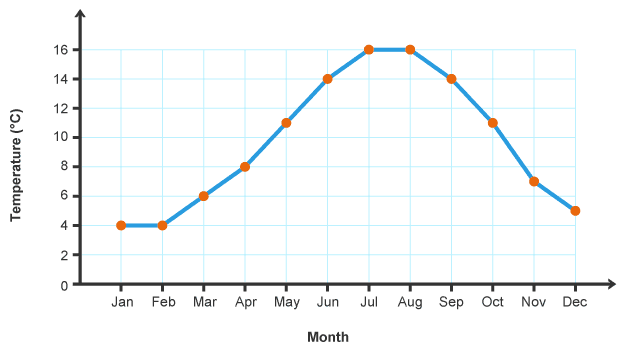
Line graph
show a change over time
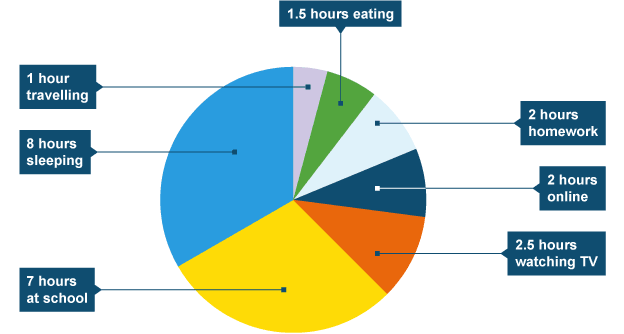
Pie chart
show individual parts that make up a whole
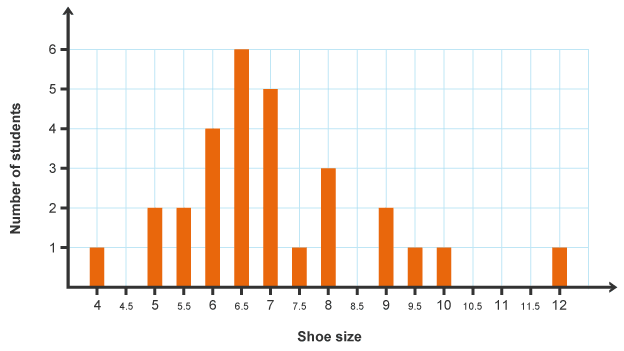
Bar chart
compare things that aren’t directly related
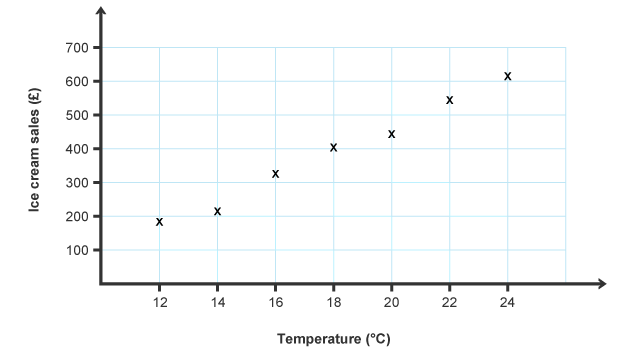
Scatter graph
look for pattern/ link between two sets of data
Using macros
eliminates need to repeat steps e.g adding a date to a worksheet
Creating macros
write code using the script editor
use recorder to store each step you take to play back/ repeat the commands
Data modelling
controlled by a set of rules defined by formulas which can be changed to predict future outcomes
Use of data modelling
ability to answer ‘what if’ questions so organisations can make better informed decisions e.g how much profit an increase in price will return
Limitations of data modelling
mistake in the rules made or not every situation considered/ other factors
Selecting areas for printing
highlight the data you want to print and choose ‘print selection’