ch 11 population growth and regulation
1/25
There's no tags or description
Looks like no tags are added yet.
Name | Mastery | Learn | Test | Matching | Spaced |
|---|
No study sessions yet.
26 Terms
demography
the study of populations
growth rate
in a population, the number of new individuals that are produced in a given amount of time minus the number of individuals that die
intrinsic growth rate
the highest possible per capita growth rate for a population. denoted as r
exponential growth model
a model of population growth in which the population increases continuously at an exponential rate
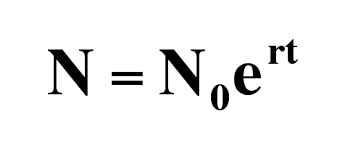
J-shaped curve
the shape of exponential growth when graphed
geometric growth model
a model of population growth that compares population sizes at regular time intervals
doubling time
the time required for a population to double in size
density independent
factors the limit population size regardless of the population’s density
density dependent
factors that affect population size in relation to the populations density
negative density dependence
when the rate of population growth decreases as population density increases
positive density dependence
when the rate of population growth increases. also known as inverse density dependence or the allee effect
self thinning curve
a graphical relationship that shows how decreases in population density over time lead to increases in the mass of each individual in the population
carrying capacity, K
the maximum population size that can be supported by the environment
logistic growth model
a growth model that describes slowing growth of populations at high densities
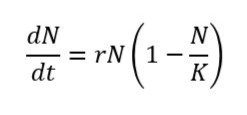
s-shaped curve
the shape of the curve when a population is graphed over time using the logistic growth model. or, sigmoidal
inflection point
the point on a sigmoidal curve at which the population achieves its highest growth rate
age structure
in a population, the proportion of individuals that occurs in different age classes
type I survivorship curve
depicts a population with low mortality early in life and high mortality in life
type II survivorship curve
occurs when a population experiences relatively constant mortality throughout its lifespan
type III survivorship curve
depicts a population with high mortality early in life and high survival later in life
life tables
tables that contain class-specific survival and fecundity data. the actual population is twice as large as that estimated by a life table
stable age distribution
when the age structure of a population does not change over time
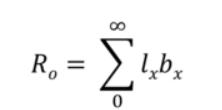
net reproductive rate
the total number of female offspring that we expect an average female to produce over the course of her life
generation time (T)
the average time between the birth of an individual and the birth of its offspring
cohort life table
a life table that follows a group of individuals born at the same time from birth to the death of the last individual
static life table
a life table that quantifies the survival and fecundity of all individuals in a population during a single time interval