Production possibility curve (PPC)
1/12
There's no tags or description
Looks like no tags are added yet.
Name | Mastery | Learn | Test | Matching | Spaced |
|---|
No study sessions yet.
13 Terms
What does a Possibility production frontier (PPF) show?
It depicts the maximum productive potential of an economy of two goods/ services when resources are used fully and efficiently
How do PPFs show trade offs?
By producing more of one good, the opportunity cost is the second good which you use, this presents a trade off
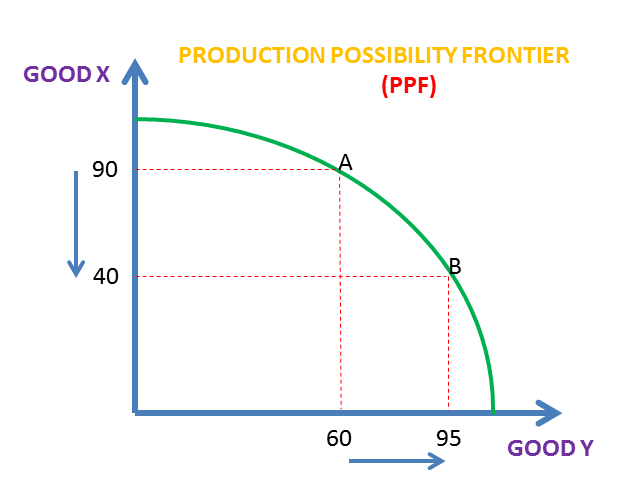
What is the opportunity cost of moving from point A to B on this PPF?
50 Of good X is lost, but gain 35 of good Y
Why is the graph a curve?
Due to the law of diminishing returns
Law of diminishing returns - definition
As additional increments of resources are added to a certain purpose, the marginal benefit from those additional increments will decline.
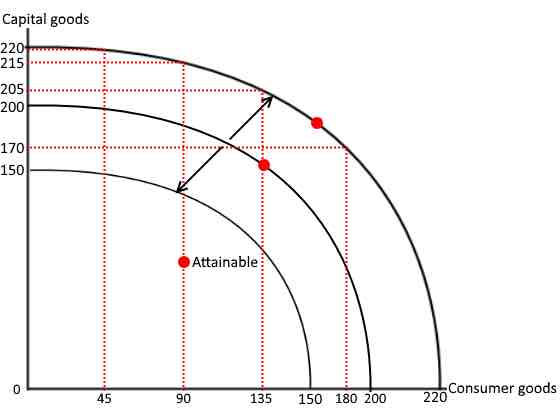
What does points on the curve show?
That production is productively efficient
Productive efficiency definition
Maximum output from the available factors of production
No wastage of scarce resources
What do points underneath the curve show?
Inefficiency as more could be produced with available resources
What do points outside the curve show?
Unattainable with current factors of production
Allocative efficiency - definition
Or pareto efficiency
Making best use of scarce resources to produce the combination of two goods/ services that are optimal for a society’s demand
How many points on a graph are allocatively efficient?
Just one, as only one point is an optimum, but this changes over time and in different societies.
What happens during economic growth/ decline to these curves?
They shift outwards/ inwards as the factors of production change meaning productive potential of the economy will also change
How is moving along the curve different to the curve shifting?
Curve shifting demonstrates a using more or less resources, or resources of higher/ lower quality, which change production potential
Moving along the curve indicates using the same amount of resources, but what good those resources are allocated to changes