Probability Distributions
1/40
There's no tags or description
Looks like no tags are added yet.
Name | Mastery | Learn | Test | Matching | Spaced | Call with Kai |
|---|
No analytics yet
Send a link to your students to track their progress
41 Terms
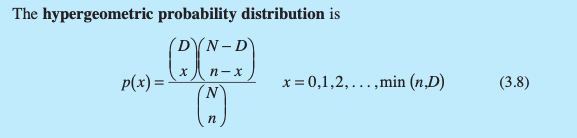
What is the probability distribution for Hypergeometric data?
sample of n items without replacement from a lot of N items of which D are non- conforming or defective.
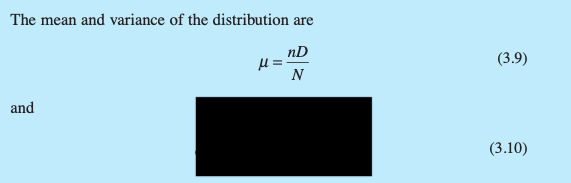
How is the mean calculated for a Hypergeometric Distribution?
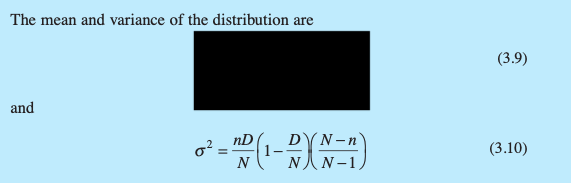
How is the variance calculated for a Hypergeometric Distribution?
What is a Hypergeometric Distribution used for?
The hypergeometric distribution is the appropriate probability model for selecting a random sample of n items without replacement from a lot of N items of which D are non- conforming or defective.
What is the probability distribution for Binomial data?
the probability of “success” on any trial = p
“successes” = x
n = Bernoulli trials

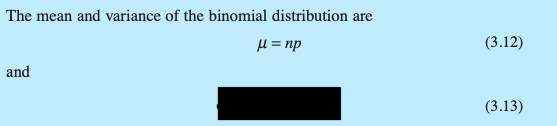
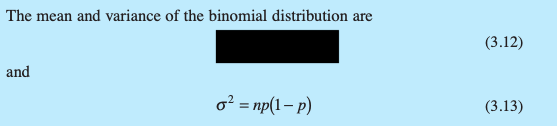
How is the mean calculated for a Binomial Distribution?
How is the variance calculated for a Binomial Distribution?
What is a binomial distribution?
Consider a process that consists of a sequence of n independent trials. By independent trials, we mean that the outcome of each trial does not depend in any way on the outcome of previ- ous trials. When the outcome of each trial is either a “success” or a “failure,” the trials are called Bernoulli trials. If the probability of “success” on any trial—say, p—is constant, then the number of “successes” x in n Bernoulli trials has the binomial distribution with parameters n and p.
What is the probability distribution for Poisson data?

How is the mean calculated for a Poisson Distribution?
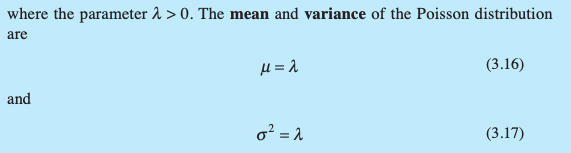
How is the variance calculated for a Poisson Distribution?

What is the Poisson distribution used for?
Any random phe- nomenon that occurs on a per unit (or per unit area, per unit volume, per unit time, etc.) basis is often well approximated by the Poisson distribution.
What is the probability distribution for Negative Binomial data?
probability of success = p
x denote the trial on which the r th success occurs.

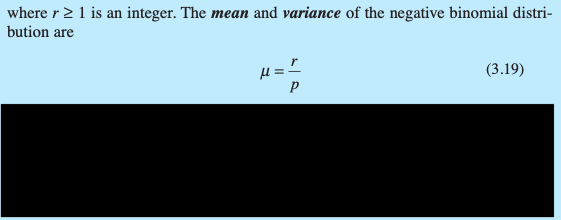
How is the mean calculated for a Negative Binomial Distribution?
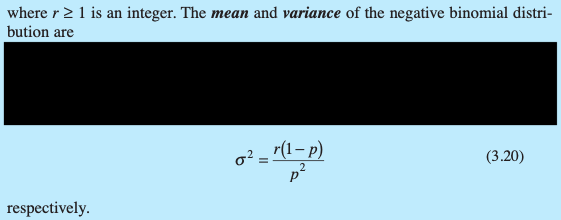
How is the variance calculated for a Negative Binomial Distribution?
What is the Negative Binomial Distribution used for?
The negative binomial distribution, like the binomial distribution, has its basis in Bernoulli trials. Consider a sequence of independent trials, each with probability of success p, and let x denote the trial on which the r th success occurs.
What is the difference between the geometric distribution and the negative binomial distribution?
A useful special case of the negative binomial distribution is if r = 1, in which case we have the geometric distribution. It is the distribution of the number of Bernoulli trials until the first success.
What is the probability distribution for Geometric data?
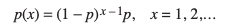
How is the mean calculated for a Geometric Distribution?

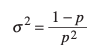
How is the variance calculated for a Geometric Distribution?
What is the probability distribution for Normal data?

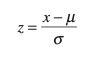
How do you calculate a Z-score for a normal distribution?
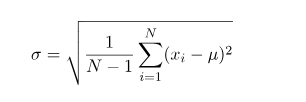
How do you calculate a standard deviation for a normal distribution?
What is the Central Limit Theorem? (CLT)
The Central Limit Theorem explains that the sample distribution of the sample mean resembles the normal distribution irrespective of the fact that whether the variables themselves are distributed normally or not.
Why is the Central Limit Theorem useful?
According to the central limit theorem, the mean of a sample of data will be closer to the mean of the overall population in question as the sample size increases, notwithstanding the actual distribution of the data. The concept can hold true regardless of whether the distribution of the population is normal or skewed.This theorem is useful because it allows statisticians to make inferences about population parameters using sample statistics, especially with large samples or a sum of samples from unknown distributions. It helps in approximating the distribution of sample means to a normal distribution. This enables valid statistical inference and hypothesis testing.
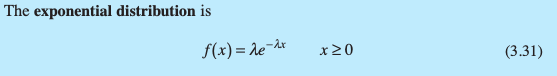
What is the probability distribution for Exponential data?
How do you calculate the mean for an exponential distribution?

How do you calculate the variance for an exponential distribution?

When is the Exponential Distribution helpful?
The exponential distribution is widely used in the field of reliability engineering as a model of the time to failure of a component or system. In these applications, the parameter l is called the failure rate of the system, and the mean of the distribution 1/l is called the mean time to failure.
What is the probability distribution for Gamma data?

How do you calculate the mean for a gamma distribution?

How do you calculate the variance for a gamma distribution?

What is the shape parameter in the Gamma distribution and how is it calculated?
The shape parameter for the gamma distribution specifies the number of events you are modeling. For example, if you want to evaluate probabilities for the elapsed time of three accidents, the shape parameter equals 3. Shape must be positive, but it does not have to be an integer. Statisticians denote the shape parameter using alpha (α).
What is the scale parameter in the Gamma distribution and how is it calculated?
The scale parameter for the gamma distribution represents the mean time between events.
For example, if you measure the time between accidents in days and the scale parameter equals 4, there are four days between accidents on average.
The scale parameter is also the inverse of the rate parameter.
When is the Gamma distribution helpful?
The gamma distribution models the time between events. Time is a continuous variable, and the gamma distribution is, likewise, a continuous probability distribution. Conversely, the Poisson distribution models the count of events within a set amount of time. A count is a discrete variable and the Poisson distribution is a discrete probability distribution.It is particularly useful in scenarios where events occur continuously and independently, such as waiting times for events in queuing theory or reliability analysis.
What is the probability distribution for Weibull data?

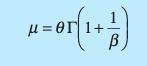
How do you calculate the mean for a Weibull Distribution?
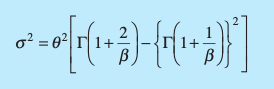
How do you calculate the variance for a Weibull Distribution?
What is the Scale parameter of the Weibull Distribution?
The value of the scale parameter equals the 63.2 percentile in the distribution. 63.2% of the values in the distribution are less than the scale value.
What is Lambda in the Poisson Distribution?
In a Poisson distribution, lambda (λ) represents the average or expected number of events occurring within a specific interval of time or space. In other worse, it is the rate at which events occur in e given interval.