Debugging
1/21
There's no tags or description
Looks like no tags are added yet.
Name | Mastery | Learn | Test | Matching | Spaced | Call with Kai |
|---|
No analytics yet
Send a link to your students to track their progress
22 Terms
Debugging
methodical process of finding and reducing the number of bugs, or defects, in a computer program
Types of Bugs
Bugs that occur during compilation time
Bugs that occur during run time
What do Bugs occur during Compilation Time?
Your program code is syntactically incorrect
Your program violates common programming conventions, for example a variable is used before / without initialization
Issues may appear as warnings
Static analysis of your code detects that the program is invalid
What do Bugs occur during Run Time?
Your program has a logical error
It will still work but not as expected
Debugging Strategies
Divide and conquer to debug a program:
Gradually remove/add code to create the smallest source file that contains the bug
Approach 1: Remove code
Start with your code
Slowly remove code until program works well
Examine last removed lines
Approach 2: Add code
Start with the smallest working program
Add functionality, until program breaks
Examine the last added lines
Debugging Using Logging (printf)
Insert printf in different places of the code to follow its flow, this approach is often helpful, but:
It generally takes a lot of printf statements
Inclusion of printf could change the behaviour of the code (timing, stack, ...)
programs with printf may work, and then
the code fails when printf is removed (this is known as a ‘heisenbug’)
This approach cannot examine program flow details,
i.e., instruction-by-instruction inspection
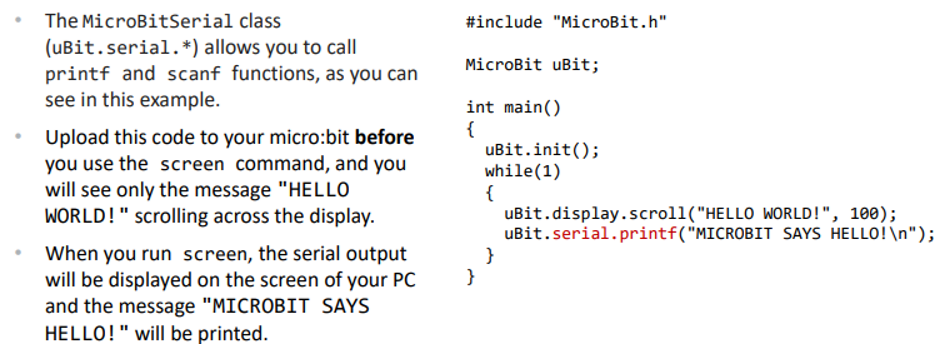
Micro:bit and Printing on the Screen
You can use printf and scanf operations to print and read data using a serial/UART interface
A communication interface between two computers
Transmits information sequentially one bit at a time
You need a serial client to read and write data (i.e., screen)
Micro:bit - Sending Data through the Serial for Linux Systems
Install the program “screen” if it is not already installed.
Upload your code to your micro:bit device and open a terminal window
Type ls /dev/ttyACM* to find out the device node that micro:bit has been assigned to. We are going to assume that the device node is /dev/ttyACM0
Type screen /dev/ttyACM0 115200 to display the serial output of micro:bit on your screen. The value 115200 is the default baud rate (symbols/sec) of micro:bit
To exit “screen”, press Ctrl-A and Ctrl-D. To return to “screen” type screen –r
Micro:bit - Sending Data through the Serial for OSX Systems
Same as Linux but use /dev/cu.usbmodem* instead of /dev/ttyACM*
Micro:bit - Sending Data through the Serial for Windows Systems that use the Windows Subsystem for Linux (WSL)
Open a terminal window as an administrator
Install usbipd:
winget install --interactive --exact dorssel.usbipd-win
Type usbipd list to find out the bus IDs of currently connected USB devices. Let us assume that micro:bit uses bus 2-7
Bind and then attach to the device through WSL:
usbipd bind –b 2-7
usbipd attach –b 2-7 –w -a
Open a WSL window as an administrator and follow the guidelines for Linux
Micro:bit - Debugging using Logging (printf)
What does a Debugger allow you to do?
Step through a program (execute one instruction at a time)
Set breakpoints (stop at checkpoints)
Investigate machine state (memory, registers)
Investigate crashes
What does a Debugger not do?
Find problems for you (but it makes this job easier)
Fix a problem (you have to do that…)
What Hardware support can Debuggers Require?
In-System programming of logic devices, e.g., FPGAs (Field Programmable Gate Arrays) using Verilog or other Hardware Description Languages (HDLs)
e.g., JTAG (Joint Test Action Group) to access debug interfaces
Hardware support for code/data breakpoints (page fault)
What different Interfaces can Debuggers provide?
Command line
Graphical user interface (GUI)
The GNU DeBugger (GDB)
Open-source debugger developed by the GNU project that also created the GNU Compiler Collection (GCC or gcc)
Designed for the C language
Command line interface but can be used with Integrated Development Environments (IDEs)
What are the Aims of GDB?
Debugging C programs
Understanding of system architecture
Connection between hardware, assembler, C, applications
Debug Symbols
Records associating code and variables with source code
The flag –g, tells gcc to generate debug symbols
To compile and then debug the program on this slide, type:
$ gcc -g SCC131_W10_Debug.cpp -o SCC131_W10_Debug
GDB - Example - Byte Order
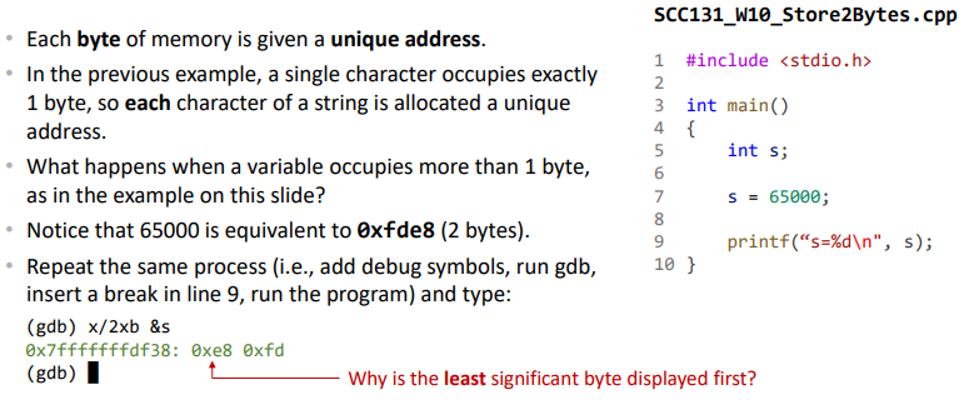
Big Endian
the MSB is stored first
Little Endian
the LSB is stored first
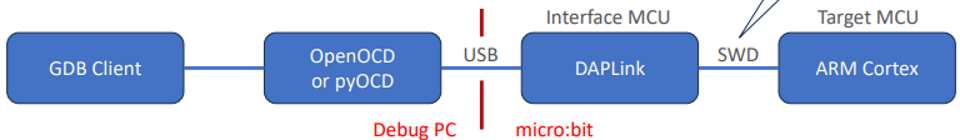
Debugging Micro:bit
Use DAPLink
An On-Chip Debugger (OCD) allows remote debugging
Integration with VS Code provides a powerful debugging environment