Performance Measurement
 Call Kai
 Learn
Learn Practice Test
 Spaced Repetition
 Match
Match Flashcards
 Knowt Play
1/60

There's no tags or description
Looks like no tags are added yet.
61 Terms
Distinguish performance measurement, attribution, and appraisal.
Performance measurement—what was the portfolio’s performance?
Performance attribution—how was the performance achieved?
Performance appraisal—was the performance achieved through manager
skill or luck?
Macro attribution vs micro attribution
Macro is evaluating the asset owner’s tactical asset allocation (how did a manager’s broad sector perform-sector allocation) and manager selection decisions (how did the manager’s own portfolio for that broad sector perform-selection + interaction). Micro is evaluating the impact of the portfolio manager’s decisions on the performance of the asset owner’s total fund (how did the manager allocate within the sub-sectors of his broad category-sector allocation)
Effective attribution analysis must
reconcile to the total portfolio return or risk exposure.
Explain arithmetic vs geometric attributions
Arithmetic is just R-B, but it may not be accurate over multiple periods. Geometric uses (R-B)/1+B.
BHB model.
The asset allocation vs security selection breakdown is already covered in l2. BHB has another mathematically equivalent calculation. Instead of using w_p in security selection, use w_b. Then add a third component: the interaction effect. Ii = (wi − Wi)(Ri − Bi).
Differentiate BHB model with BF model.
Security selection is exactly the same. Sector allocation is now computed as sum (wi-Wi)(Bi-B), where B is benchmark portfolio return. Note that the math checks out exactly the same, but subtracting B gives further intuition. For instance, let’s say manager overweighted a -2% sector by 10% when overall market is 8.2%. He gets penalized 0.2% from overweighting a losing sector but also another 0.82% since that 10% is also an opportunity cost of not investing in the market.
Fixed income return attribution methods are
Exposure decomp: group by duration buckets, and compare their weights to benchmark.
Yield curve decomp - duration based: Decompose yield changes by level, slope, curvature, spread.
Yield curve decomp - full repricing: Decompose by spot rates.
Formulate curvature
Butterfly spread = 2*belly-long-short. A straight line has curvature 0. If spread is positive, the yield curve is concave, and a larger magnitude indicates more curvature. When spread is negative, the yield curve is convex.
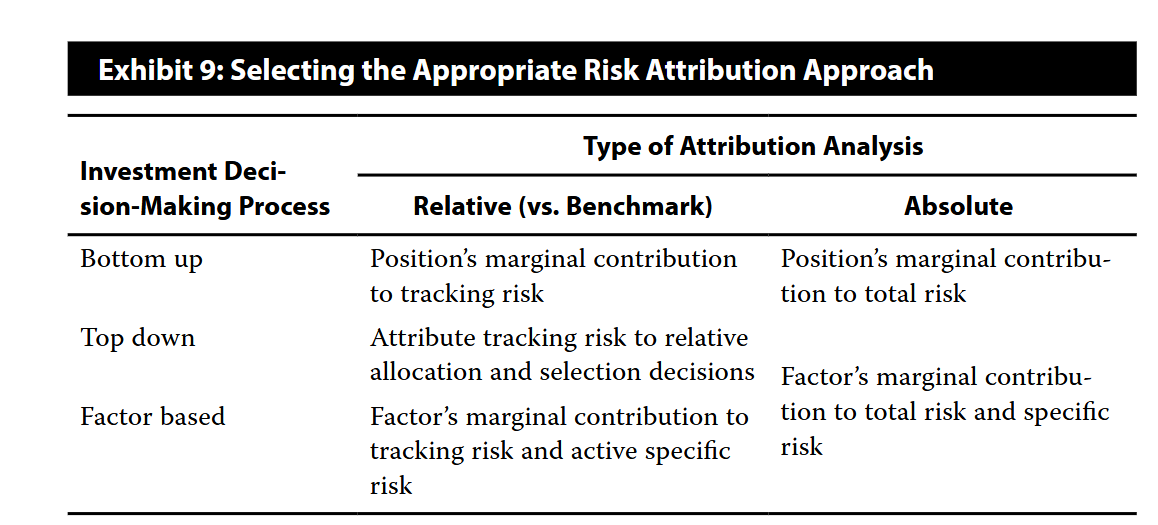
How to select the appropriate risk attribution approach for bottom up, top-down, factor based methods using relative risk vs absolute risk.
Bottom up relative uses marginal contribution to tracking risk.
Bottom up absolute uses marginal contribution to total risk.
Top-down relative breaks down tracking risk to allocation/security selection decisions.
Allocation/security selection are benchmark-relative, so no top-down absolute.
Factor-based relative uses factor’s marginal contribution to tracking risk.
Factor-based absolute uses factor’s marginal contribution to total risk.
what benchmarks do market neutral managers use?
Absolute return benchmarks. For instance, T-bill + a percentage is an absolute return benchmark.
Liability-based benchmarks
A recent innovation is LDI indexes, which are investible indexes designed specifically for portfolios intended to hedge pension liabilities. However, they may not describe a pension plan’s liability structure accurately.
Explain factor-model-based benchmarks, return-based benchmarks, manager peer group, and custom security-based benchmarks
Factor-model-based: Regress portfolio returns on chosen factors to get sensitivities, then predict expected return.
Returns-based: Same idea, but factors are style indexes and weights must be non-negative and sum to 1.
Peer-group: An issue with peer group that managers within the same category can still face vastly different constraints.
Custom Security-Based: After identifying the manager’s investment process, the benchmark is constructed by selecting securities and weightings consistent with that process and client restrictions.
Bailey and Tierney criteria for benchmark
Unambiguous - what securities are in it and at what weights?
Investable
Measurable - The benchmark’s return should be easily computed on a timely basis.
Appropriate - consistent with the manager’s universe.
Reflective of current investment opinions - Managers should be familiar with the securities and hold opinions on them.
Specified in advance - benchmark constructed prior to performance period
Accountable - clients made aware of differences between portfolio and benchmark.
Derive and explain P = M + S + A
Style return S=B-M, where M is market return. P = B + A. A good benchmark should not show correlation between S and A. Define E=S+A. A good benchmark should show positive correlation between E and S.
Define normal benchmark.
The most appropriate benchmark for an investor’s investment process.
Issues that arise when benchmarking real estate include
Benchmarks include only a subset of the asset class.
Performance is self reported in peer group benchmarks
Appraisal indexes contains smoothing
Difference in leverage between benchmark and funds
Issues that arise when comparing returns of private equity managers include
Different methods of valuation, early loss/gain can significantly change IRR, companies in funds can be in diff stages of development.
Explain PME (public market equivalent)
It uses cash flow data to replicate the general partner’s capital calls and distributions, assuming these same cash flows were invested in the chosen equity index.
Difficulties in benchmarking commodities include
1: use of futures in indexes.
2: different degrees of leverage.
3: different weightings of commodities in indexes.
Formulate Sharpe and Treynor and their issues.
Sharpe is excess return over risk-free divided by portfolio volatility. It assumes indifference between upside and downside volatilities. Treynor divides by beta of portfolio and assumes a diversification.
Formulate appraisal ratio.
alpha divided by standard deviation of residuals. Both are derived from a factor regression.
Portfolio Y delivered an average annualized return of 9.0% over the past 60 months. The annualized standard deviation over this same time period was 20.0%. The market index returned 8.0% per year on average over the same time period, with an annualized standard deviation of 12.0%. Portfolio Y has an estimated beta of 1.40 versus the market index. Assuming the risk-free rate is 3.0% per year, the appraisal ratio is closest to
Solve for alpha using Jensen’s alpha first. 9-(3+1.4*(8-3))=-1. Then solve for residual std. 0.2²-1.4²*0.12² = 0.011776. -1/sqrt(0.011776)=-0.0922
Formulate Sortino ratio
Excess over minimum required return divided by downside semideviation.
Formulate capture ratio
Upside and downside captures are R(m,t)/R(B,t), where m is manager and B is benchmark. Then capture ratio is upside/downside. Geometric average is typically used for multiple data points.
Formulate cumulative drawdown and drawdown duration
Cumulative drawdown(m,t) = min([V(m,t) − V(m,t*)]/V(m,t*), 0). Drawdown duration is the time between start of drawdown and cumulative drawdown reaches 0.
Three components of manager selection process:
Universe (suitability, style, active vs passive), quantitative (Attribution/Appraisal, capture, drawdown), qualitative. Qualitative is further divided to investment due diligence (philosophy regarding inefficiency, process to exploit this inefficiency, people to implement the process, portfolio consistency) and operational (back-office, firm, investment vehicle, terms, monitoring)
Why are decision makers more concerned with type i errors in manager selection?
Type i errors create explicit costs instead of opportunity costs in type ii.
Type i errors are easier to quantify.
Type i errors are more transparent to investors.
methods of style analysis and pros/cons
Return-based style analysis (RBSA) - same method as the return based benchmark discussed in a previous section. Simple to use, but portfolio sensitivities change over time and are average over regression period.
Holdings-based style analysis - Examine the styles of holdings. While more precise, it is only a snapshot and may not be appropriate for high turnover portfolios. It is also subject to window dressing.
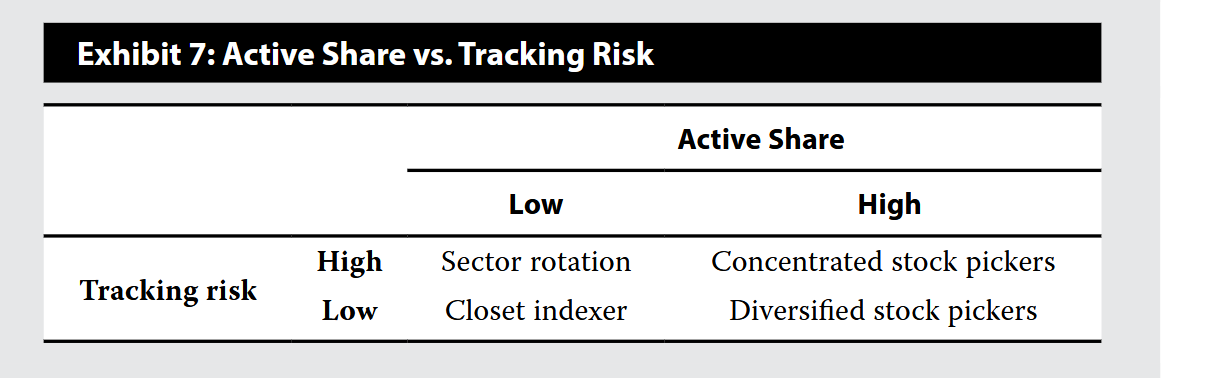
Active share
½ ∑ | Strategy Weight_i − Benchmark Weight_i |
Explain capacity of inefficiencies when judging investment philosophy during the qualitative process.
Is the return sufficient and frequent enough to cover costs?
Is the return repeatable?
Is the return sustainable? At what asset level can the strategy no longer support?
What are the considerations when judging investment personnel?
Do they have enough expertise? Does the team have sufficient depth? Is there key person risk? What’s the incentive to maintain talent?
What are the biases in a group? What due diligence steps exist when judging investment personnel?
Groupthink, Authority Bias, Complexity Bias.
How large is the team?
How are decisions made?
What is the diversity?
Describe the four elements of investment process
Signal creation - Does the strategy rely on unique information? Does the strategy involve faster timing? Does the strategy involve superior interpretation of information?
Signal capture - What is the process to translate ideas to positions? What is it and is it repeatable?
Portfolio construction - This relates to risk management. How is portfolio allocation adjusted? Does the portfolio include stop losses? How are hedges implemented? Consider liquidity as well
What are the considerations when performing operational due diligence?
How does the firm protect against unauthorized trades? Do backup facilities exist? How does the firm protect again cyber attacks?
Regarding infrastructure, are third-party providers respected? Did the firm switch between providers frequently?
Regarding risk, does the firm have a risk officer? What is the procedure for breaches?
Regarding Firm, what is the ownership structure (independently owned has more autonomy but may lack financial support during crisis)? What is the breakeven AUM? Does the firm foster a culture of compliance? Has there been lawsuits involved?
What are the benefits of a SMA? What operational concerns exist?
Benefits include direct ownership of underlying securities, customization, tax advantages (unlike ETFs, SMAs can tax harvest on individual securities), transparency. Operational concerns include extra cost, tracking risk, investor behavior (micromanaging),
What is the operational due diligence when it comes to contract terms?
Liquidity and fees.
what are the issues with performance-based fees?
Upside is squashed, leaving a left-skew. A std measure understates volatility.
Firms on performance fees can struggle during underperformance, versus a standard fee structure.
Managers may be incentivized to take on extra risk.
Prospective client vs prospective investor in GIPS
Prospective client is one interested in a SMA. Prospective investor is interested in a pooled fund.
Distinguish between limited distribution and broad distribution pooled funds.
In broad distribution, the general public can purchase or hold the pooled fund’s shares and is not exclusively offered in one-on-one presentations.
Definition of Firm
The firm must be defined as an investment firm, subsidiary, or division held out to the public as a distinct business entity, which is a “unit, division, department, or office that is organizationally and functionally segregated from other units, divisions, departments, or offices and that retains discretion over the assets it manages and that should have autonomy over the investment decision-making process.”
The GIPS standards encourage firms to adopt the broadest, most meaningful definition of a firm.
Definition of firm helps determine total firm assets. What is this?
Aggregate fair value of all assets (whether or not discretionary or fee-paying) for which a firm has investment management responsibility. Total firm assets include assets managed by sub-advisors that the firm has authority to select but do not include advisory-only assets or uncalled committed capital.
Section 1 - Fundamentals of Compliance
Attain compliance for at least 5 years before claiming compliance (or since inception if firm existed for less than 5 years)
No claiming calculation methods are in compliance, except to current investors.
Firm must provide GIPS report to prospective client and update at least once a year. Firm must not use price-only benchmarks
Firm must send report corrections to clients and prospective clients but not to former. Firm must include terminated composites (but not pooled funds) in list for at least 5 years.
Firm may link non GIPS-compliant performance to compliant performances provided only compliant performances are used after minimum effective compliance date.
Performance of acquired firm may be linked provided that substantial staff remains, process remains, and there is no break in track record. If there is a break, performance may not be linked but can still be reported.
Firm has one year to bring non-compliant assets into compliance after acquisition.
Firm must present TWR, unless the firm has control over the external cash flows into the portfolios and that it has one of the following: closed-end, illiquid investments, fixed life, fixed commitment, in which case money weighted may be used.
How to use TWR when the portfolio receives a large cash flow (as defined by firm itself)?
Break to sub-periods.
For example, consider a portfolio with a beginning value of $100,000 as of 31 May, a value of $109,000 on 5 June (which includes a cash contribution of $10,000 received that day), and an ending value of $110,550 on 30 June. Then sub-period 1 has a return of -1% and sub-period 2 of 1.42%
How to use TWR when the portfolio receives non-large cash flows?
Breaking to sub-periods is not needed, but use a method that adjusts for daily weighted cash flows.
Modified Dietz method: (V1-V0-CF)/(V0+sum CF_i x w_i), where CF is sum of intra-period cash flows, w_i=(CD-Di)/CD, and Di is the number of calendar days from the beginning of the period to the time cash flow CFi occurs.
Modified IRR is another estimation approach: V1=[sum CF_i x (1+r)^w_i]+V0 x (1+r), and solve for r by trial-error.
In a flat/steadily trending market, the timing of cash flows has little effect on the estimates’ accuracy, but in a volatile market, the results can differ materially.
GIPS requires return be calculated net of gross of transaction fees?
Net of. Custody fees are not included.
Valuation under GIPS should follow
1. quoted prices for similar investments in active markets. If such inputs are not available or appropriate, then investments should be valued based on:
2. quoted prices for identical or similar investments in markets that are not active. If such inputs are not available or appropriate, then investments should be valued based on:
3. market-based inputs, other than quoted prices, that are observable for the investment. If such inputs are not available or appropriate, then investments should be valued based on:
4. subjective, unobservable inputs.
Section 2 - Calculation methodology
Total return is used.
Trade date accounting is used (transactions are recorded on trade date not settlement)
Accrual accounting is used for income.
When bundled fees are used, returns must be reduced by the entire bundled fee or the portion of the bundled fee that includes the transaction costs for both gross and net returns. Net return is further reduced by investment management fees.
If the fund invests in other funds, their fees are deducted from returns, unless the fund controls fees of these funds, in which case the management fees may be skipped from gross return.
If firm uses preliminary value as fair value, the firm must assess the difference between it and final value and make adjustments, once final value is received.
When calculating time-weighted returns for portfolios that are included in composites, all portfolios except private market investments portfolios must be valued at least monthly and at calendar month end. Returns must be calculated in the same timely fashion.
When computing time-weighted returns for pooled funds not in composites, valuation must happen at least annually, likewise for returns.
When computing money-weighted returns, valuation must happen at least annually.
When using model investment management fee to compute net returns, returns must be equal or lower than ones computed under actual fees paid.
What is the treatment of pooled funds when it comes to composites?
A composite needs not be created if only pooled funds exist for this strategy. However, if a composite exists (from a SMA), then the pooled fund must be included in the composite.
How to compute composite returns?
1: weighted via beginning assets.
2: Using both beginning-of-period values and external cash flows
3: Aggregate return (treating the entire composite as one portfolio and computing return using the modified dietz method).
Criteria for putting portfolios in composites
Non-fee paying accounts may be included, but simulated ones cannot.
Portfolios funded with the firm’s own seed money may be included.
Framework for defining composites is
Review investment process to identify distinctive strategies.
Determine which strategies are offered as SMAs.
Construct a provisional set of composites
Identify exceptions, accounts that don’t fall into any.
Review the composites to make sure they satisfy GIPS requirements.
Document the composite definitions.
Policy for adding, removing, switching portfolios.
For many strategies, new portfolios should be included as of the beginning of the next full performance measurement period after the firm receives the funds. However, for relatively illiquid strategies, GIPS allows flexibility and for the firm to define its own policy.
When a firm loses discretion over a portfolio, it should include up to the last full measurement period prior to notification of termination.
A portfolio may be switched to a different composite if composite definitions changes or if clients changes mandate.
The historical performance of a portfolio must stay with the composite after being removed from it.
Define temporary new accounts
Significant cash flows can affect the PM’s ability to implement relatively illiquid strategies. In such cases, cash inflows are placed in a temp account until they are fully invested. Similarly, in cash withdrawals, securities are placed in a temp account until they are liquidated in order. Temp accounts are not included in any composites.
Does GIPS allow setting minimum asset levels for a composite?
Yes, on the basis that the strategy cannot be implemented if asset is below a certain level.
Section 3 - COMPOSITE AND POOLED FUND MAINTENANCE
A firm that removes portfolios from composites because of significant cash flows must define “significant” on an ex ante, composite-specific basis and must consistently follow the composite-specific policy.
A firm that uses temporary new accounts to remove the effect of a significant cash flow must establish policies on an ex ante, composite-specific basis.
Minimum years of performance in a GIPS report
At least five years of performance (or since inception if the composite existed for less than 5 years) that meets the requirements of GIPS. After the firm presents a minimum of five years of GIPS-compliant performance (or since inception if the composite existed for less than 5 years), the firm must present an additional year of performance each year, building up to a minimum of 10 years of GIPS-compliant performance.
Required elements of GIPS composite report
Show composite and benchmark returns for all years
Number of portfolios (if six or more)
Amount of assets in composite
Total firm assets
Internal dispersion (if six or more portfolios)
if monthly composite returns are available, a three-year annualized standard deviation of the composite and benchmark returns as of each annual period end

Internal dispersion measures
High/low, high/low range, standard deviation (equal weighted), standard deviation (beginning asset weighted, see img)
Explain verification
Verification is intended to provide the firm and the users of its GIPS Reports greater confidence in its claim of compliance with the GIPS standards. Verification does not provide assurance as to the accuracy of any particular composite or pooled fund presentation, although a performance examination report can be issued on a specific composite.
Describe The GIPS Standards for Verifiers
Verifiers must obtain a copy of GIPS-related policies and procedures and ensure that all applicable policies and procedures are properly included and adequately documented.
Verifiers may use a sampling approach to conduct testing.
Section 4 - COMPOSITE TIME-WEIGHTED RETURN REPORT
Composite track record ends when it loses all portfolios. It restarts when new portfolios are added. Performance cannot be linked before and after.
Present the percentage of composite assets represented by non-fee-paying portfolios as of each annual period end when net-of-fees returns are presented and are calculated using actual investment management fees
If the composite includes carve-outs with allocated cash, the firm must present the percentage of composite assets represented by carve-outs with allocated cash.
Present composite uncalled committed capital for the same periods for which the combination of composite assets and composite uncalled committed capital is presented. Label each clearly as such.
Same for firm-wide uncalled committed capital and combination.
Same for advisory-only assets and combination.
All information in the report must be in the same currency.