DATA1001
1/166
There's no tags or description
Looks like no tags are added yet.
Name | Mastery | Learn | Test | Matching | Spaced | Call with Kai |
|---|
No analytics yet
Send a link to your students to track their progress
167 Terms
contemporaneous control group
occurs at the same time as the treatment group
Simpson's Paradox
when relationships between percentages in subgroups are different from when the subgroups are combined, because of a confounding variable
placebo
a pretend treatment
placebo effect
the phenomenon in which the expectations of the participants in a study can influence their behavior
Why do we do a controlled experiment?
to focus on the effects of the treatment
reproducible research
a report that can be checked and verified by a third party
double blind experiment
an experiment where both the subjects and investigators do not know which subjects received which treatments
What is the "gold standard" for performing a data study?
randomized controlled trial (RCT)
observational study
a study based on data in which no manipulation of factors has been employed
confounding factors
hidden factors that influence the results
head(data, n) in R
returns the first n rows of data
tail(data, n) in R
returns the last n rows of data
str(data) in R
returns the structure of data
qualitative variable
descriptive variable
quantitative variable
numerical variable
discrete quantitative variable
can take on only particular values and no other values in between
continuous quantitative variable
can take on any value in a given interval of real numbers
ordinal qualitative variable
can be ordered or ranked (e.g. months, days of the week)
nominal qualitative variable
cannot be ordered or ranked (e.g. favorite color)
binary qualitative variable
only two outcomes
graph for 1 qualitative variable
simple bar graph
graph for 2 qualitative variables
double bar graph
graph for 1 quantitative variable
histogram or boxplot
graph for 2 quantitative variables
scatterplot
graph for 1 quantitative variable with multiple categories
comparative boxplot
height of each block in a histogram
(% in block) / (length of interval)
IQR
Q3-Q1
threshold for outliers
Q3 + (1.5 * IQR)
Q1 - (1.5 * IQR)
mean
average - sum of data / size of data
median
middle data point of an ordered dataset
Is the mean robust?
No - easily affected by outliers. Good for symmetric data with not a lot of outliers.
Is the median robust?
Yes - not easily affected by outliers. Good for skewed data.
What should the mean and median be paired with?
they should be paired with a measure of spread
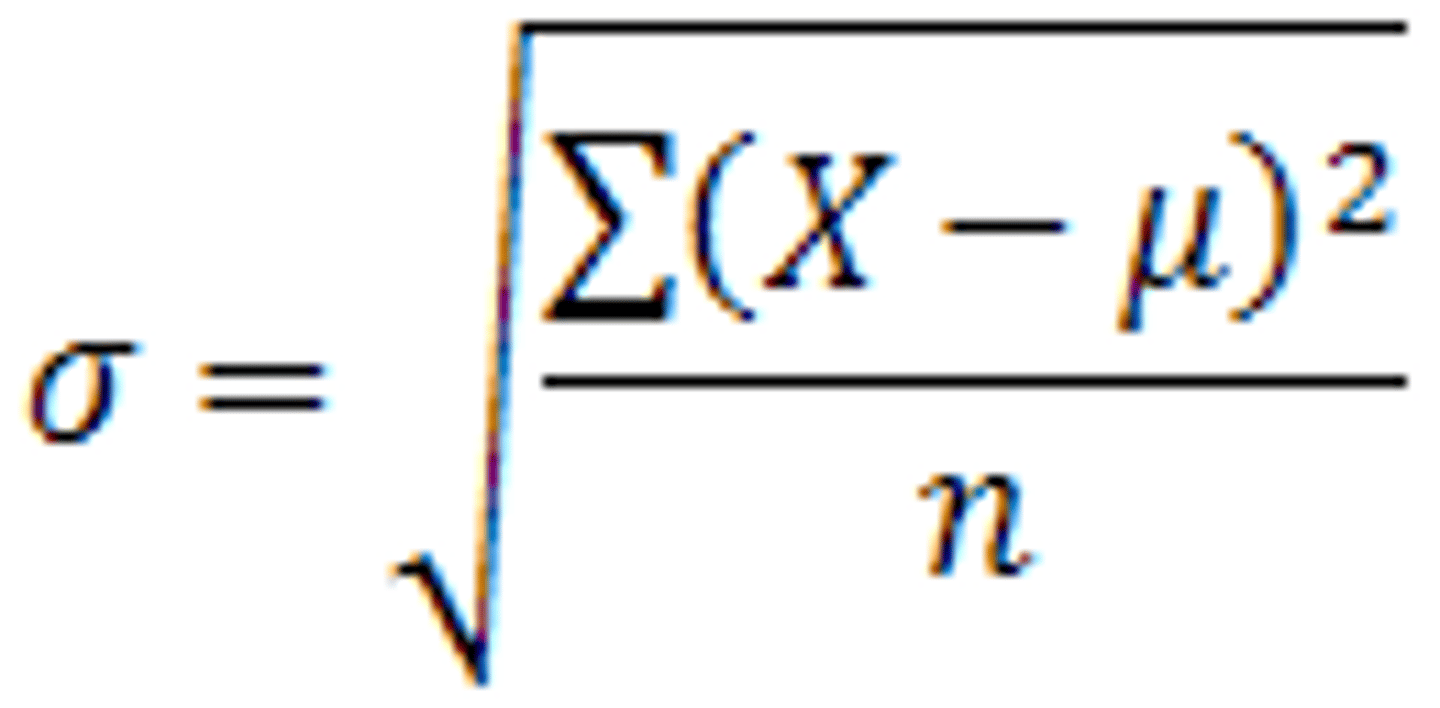
standard deviation
average distance of all the observations of a variable from the mean
standard deviation formula (population)
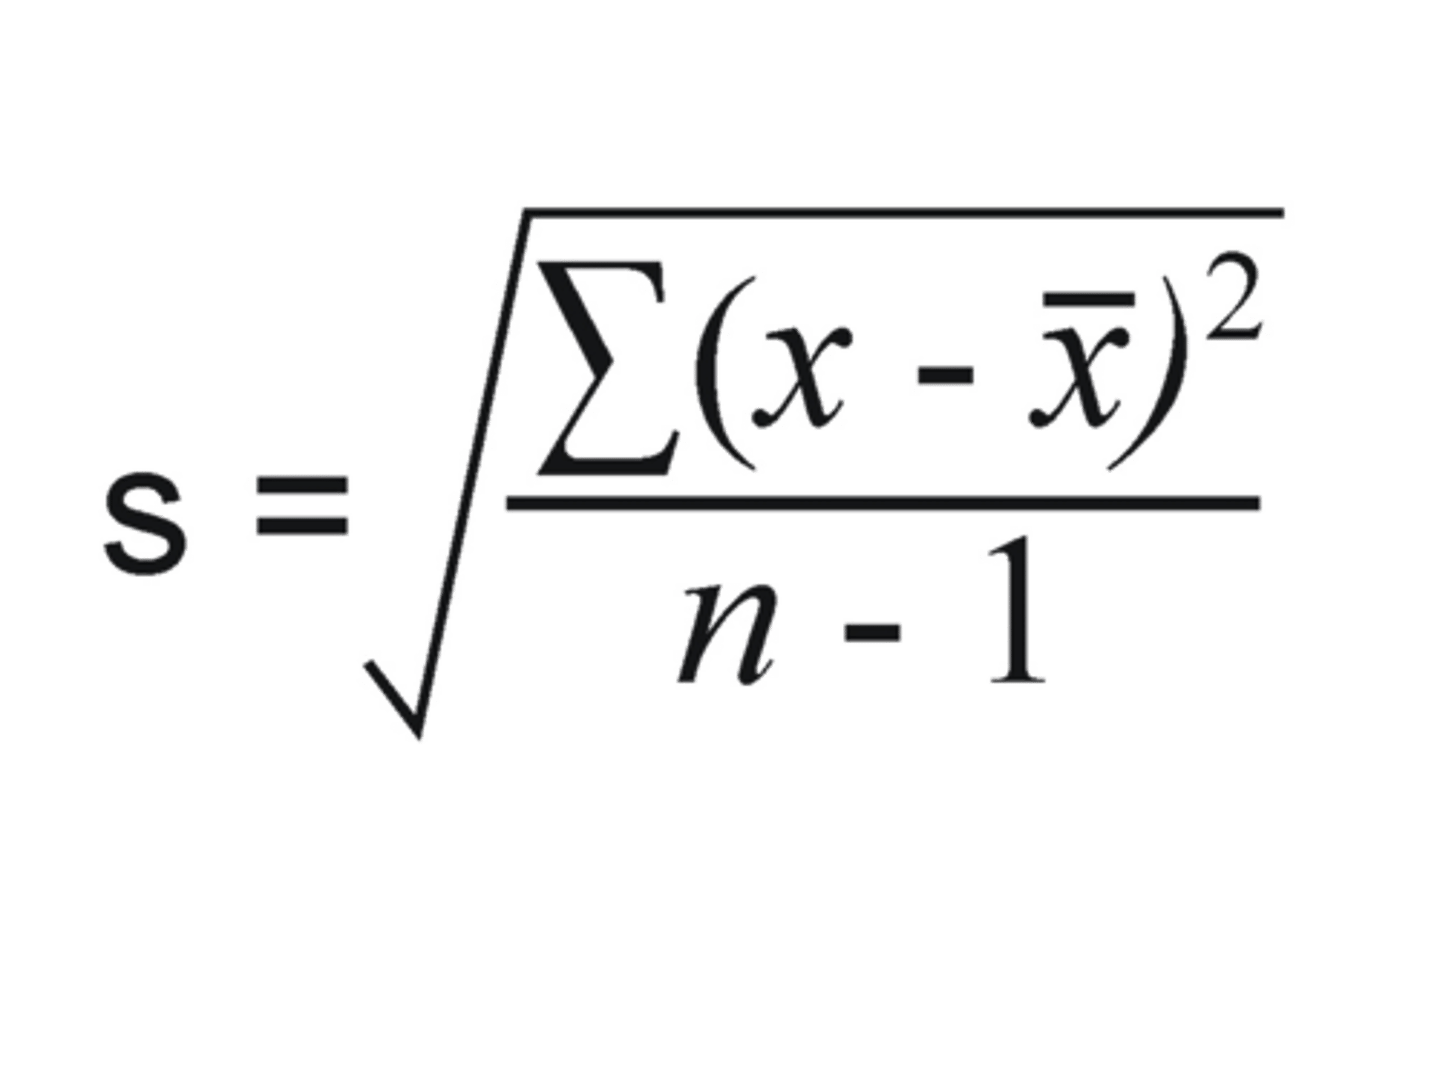
standard deviation formula (sample)
normal curve
- 68% within 1 std. dev
- 95% within 2 std. dev
- 99.7% within 3 std. dev
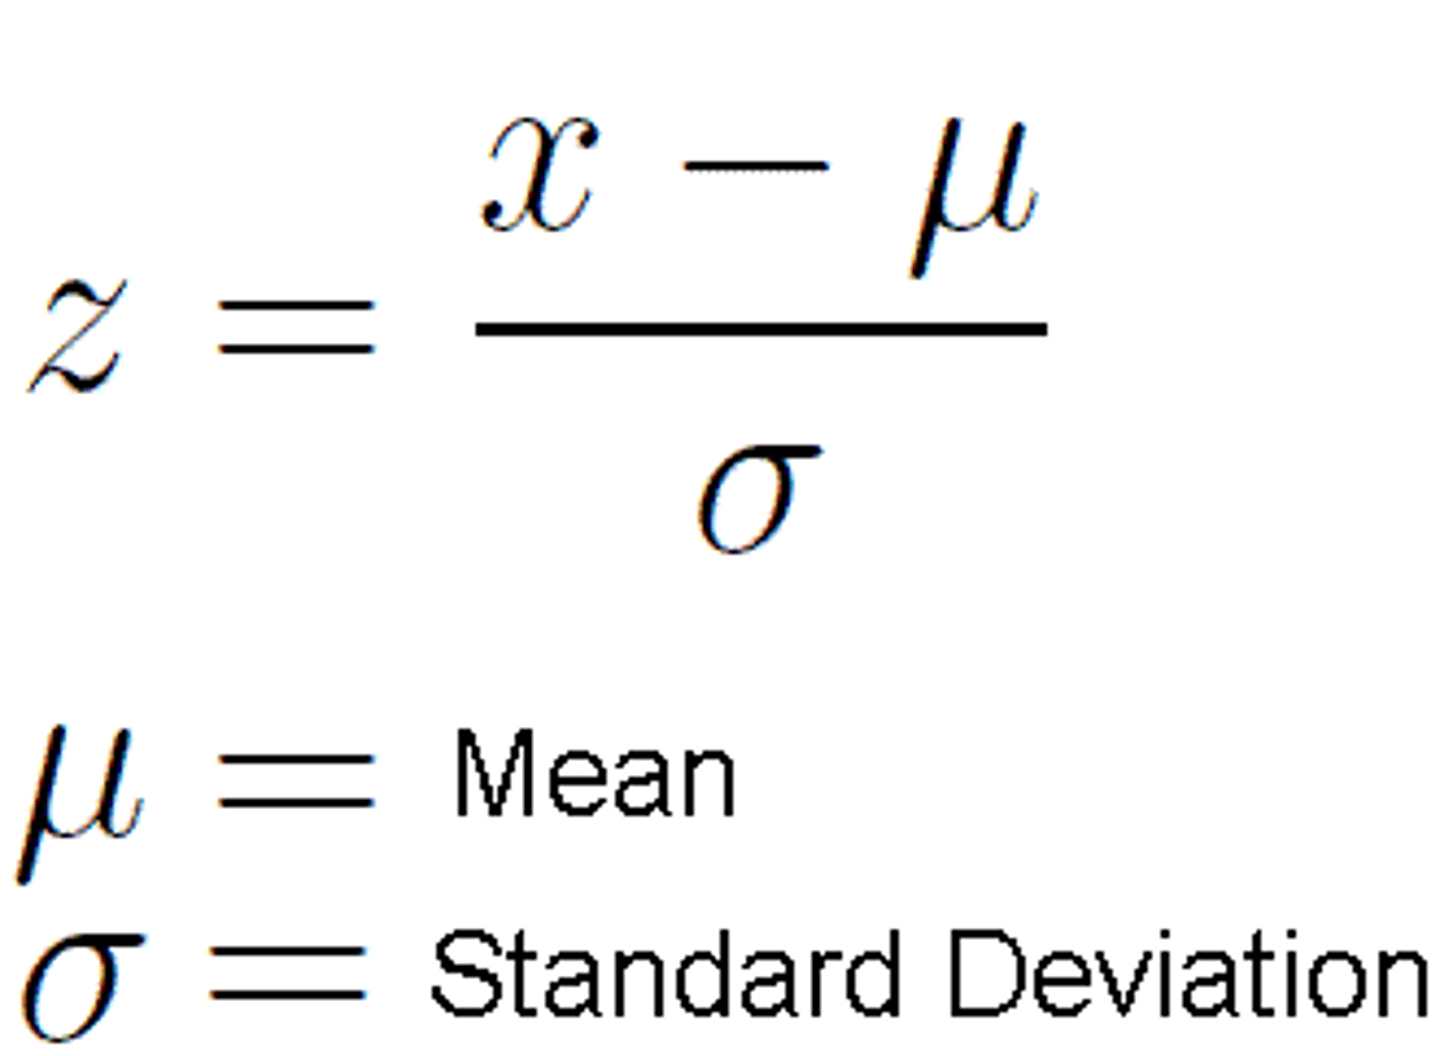
standard units (z-score)
how many standard deviations a data point is away from the mean
z-score formula
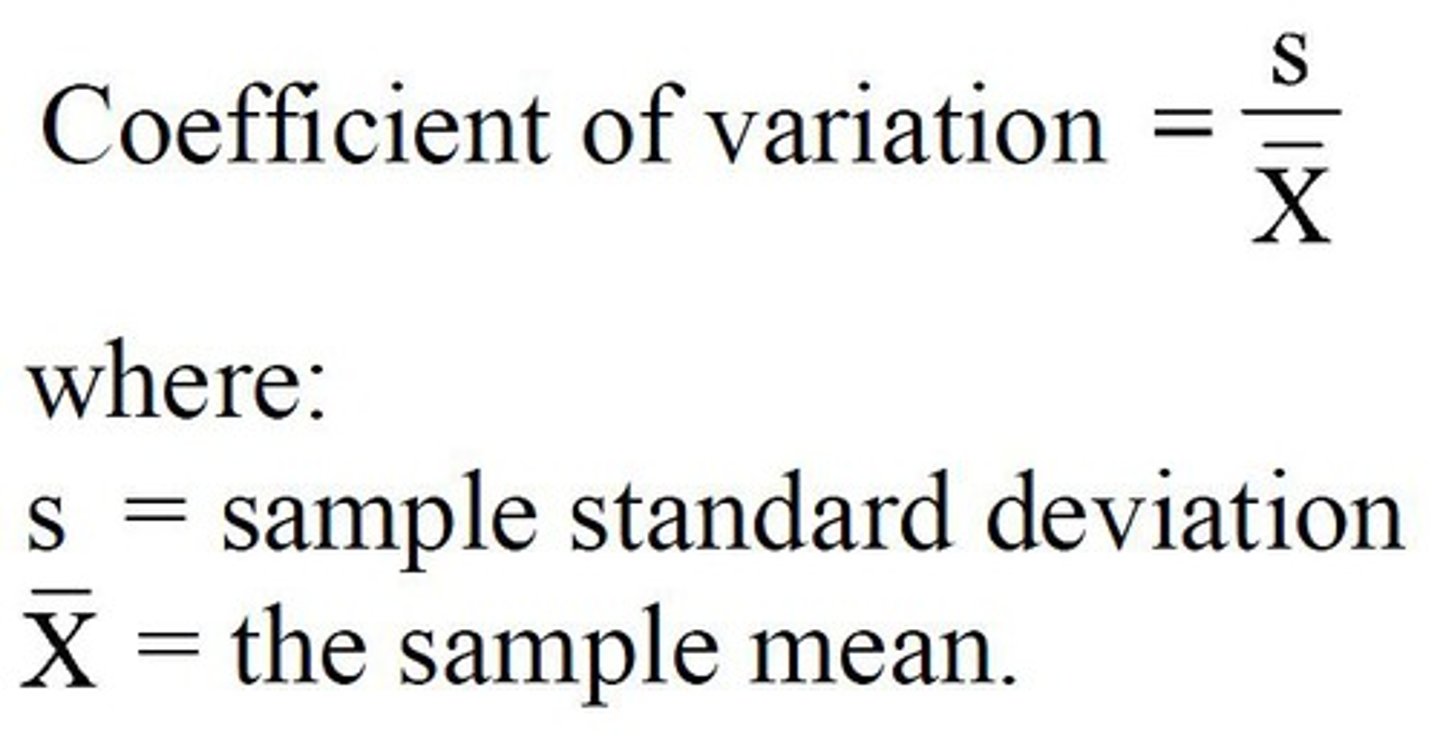
coefficient of variation
dim(data) in R
returns the dimensions (rows and columns) of data
if we have data size n with sample SD, how do you get the population SD?
SDpop = SDsam * sqrt(n-1 / n)
sd(data) in R
returns the sample SD of data
popsd(data) in R
returns the population SD of data (requires rafalib)
steps to calculate RMS
square the numbers, then mean the result, then root the result (reverse)
How does population SD relate to RMS?
SDpop = RMS of (gaps from the mean)
standard normal curve
normal distribution with mean 0 and SD 1
general normal curve
can have any mean and SD
What goes into an individual measurement?
individual measurement = exact value + chance error + bias
chance error
small differences in sampling due to chance
How to estimate chance error
Replicate measurements and calculate SD
bias (systematic) error
a constant error added to/subtracted from each measurement; can be deliberate or accidental
For a Normal curve with mean 10 and standard deviation 4, what percentage of the data lie between 10 and 14?
34%
qnorm(n, x, SD) in R
gets the nth percentile of a standard distribution with mean x and SD (default values for x and SD are 0 and 1)
pnorm(n, x, SD)
gets the area of the normal curve (with mean x and SD) up to n
notation for general standard curve
X ~ N(x, v) where x is the mean and v is the variance (SD squared)
Assuming we have zero bias, when we take a set of measurements in the real world, we can think of each individual measurement as equal to
exact measurement + chance error
What code would work out the area of a General Normal curve, with mean = 4 and SD = 5, from 0 down.
pnorm(0,4,5)
bivariative data
data with two variables
explanatory variable
a variable that we think explains or causes changes in the response variable, i.e. independent variable (x)
response variable
a variable that measures an outcome or result of a study, i.e. dependent variable (y)
linear association
how tightly the points cluster around a line
strong association
points are clustered close together.
weak association
points are clustered far apart.
positive association
as x increases, y increases
negative association
as x increases, y decreases
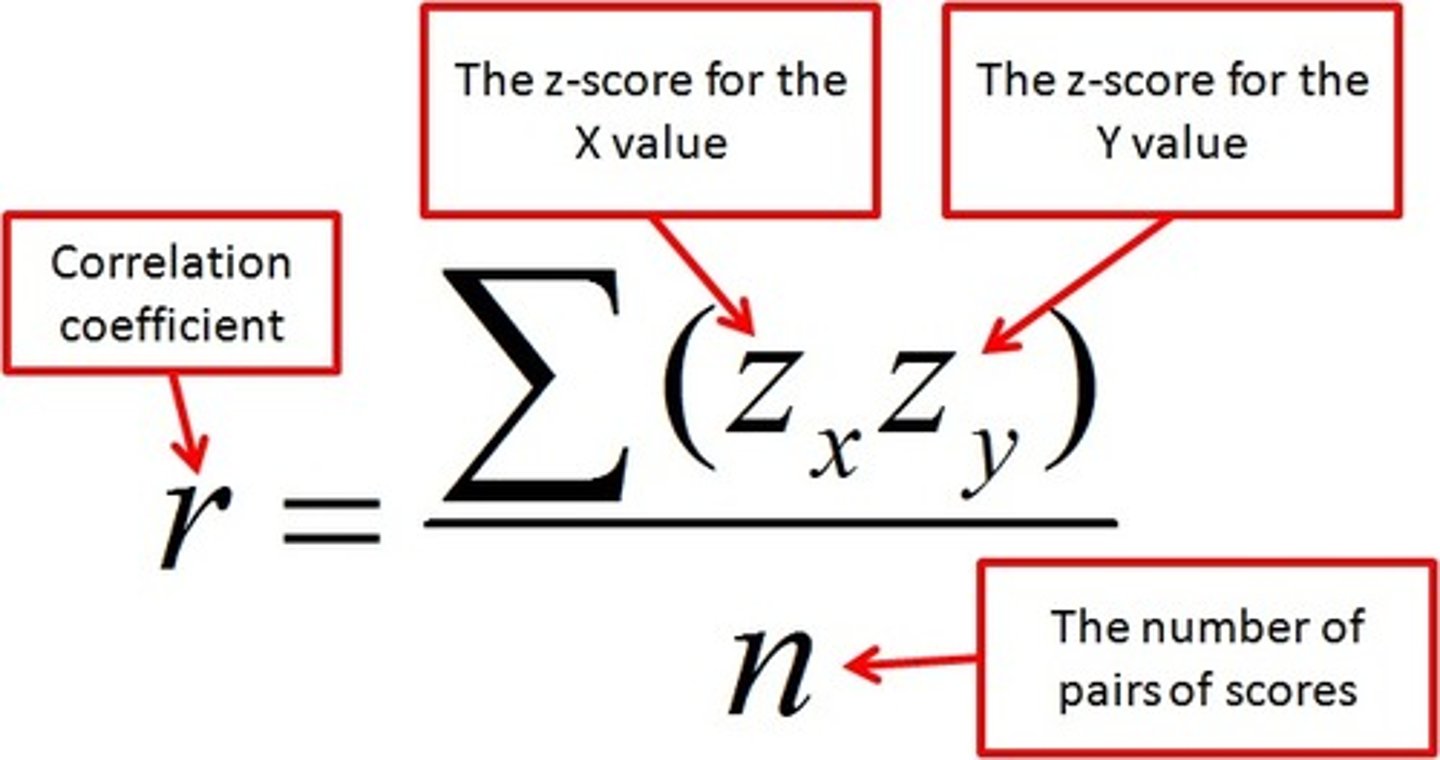
correlation coefficient (r)
A numerical index of the degree of relationship between two variables; between -1 and 1.
correlation coefficient formula (population)
for sample r, denominator is n - 1
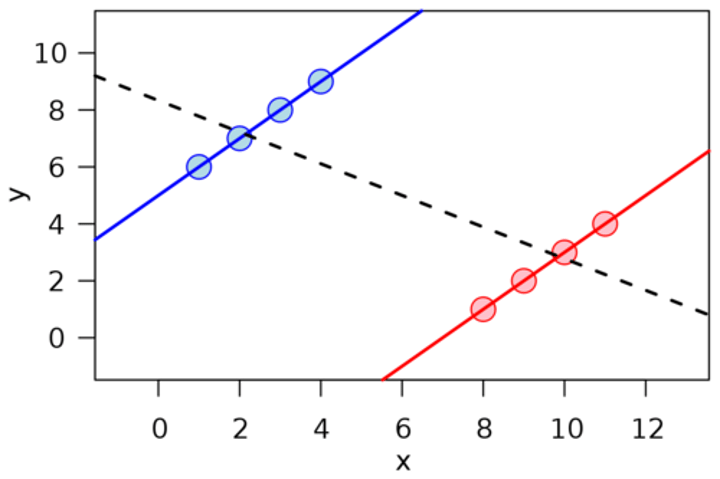
slope of the SD line
SDy/SDx
slope of the regression line
r(SDy/SDx)
steps to predict y from percentile of x
1. Find z-score of x: Zx = qnorm(percentile)
2. Translate z-score to y: Zy = r * Zx
3. Translate Zy to percentile: pnorm(Zy)
residual
the vertical distance of a point above/below a regression line; represents error between actual value and prediction
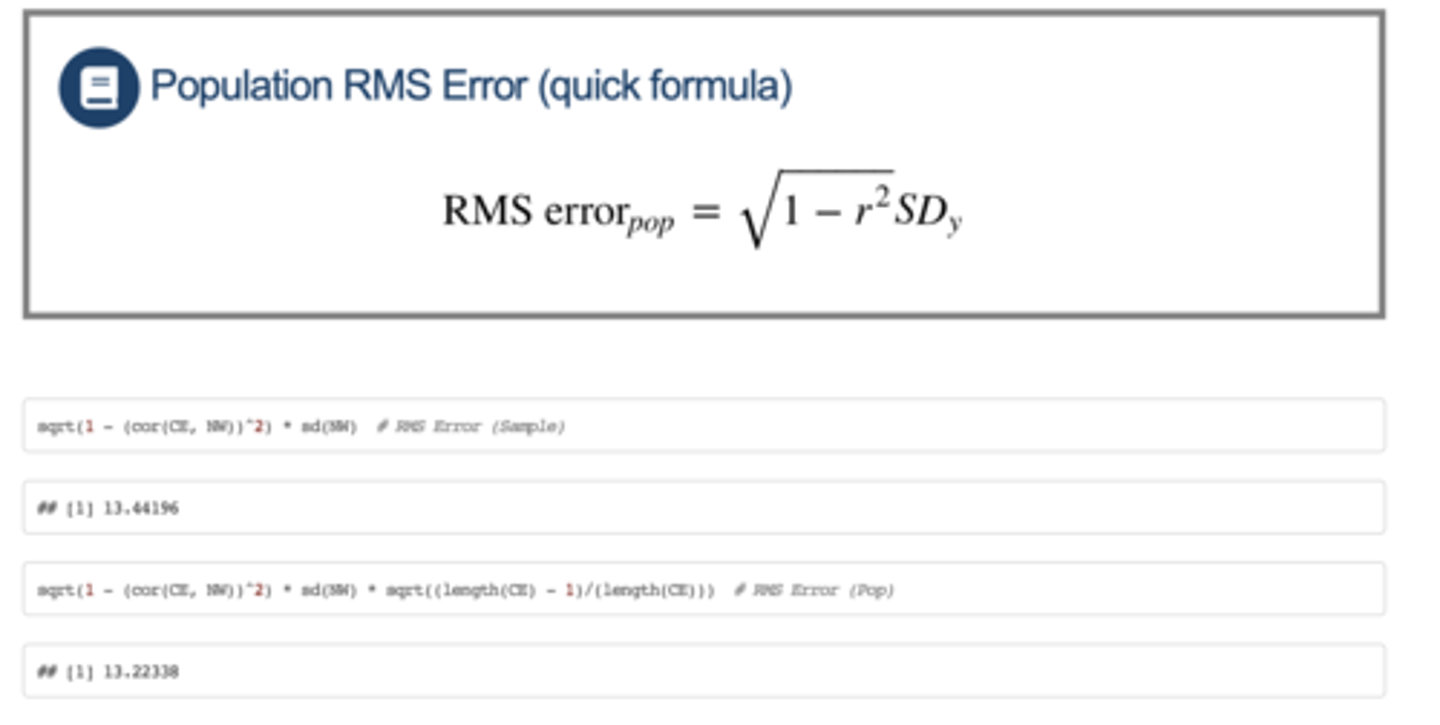
RMS error
average gap between the points and regression line
RMS error formula
If a linear model is appropriate, what should the residual plot show?
no pattern
homoscedastic data
the vertical spread of the data is similar over the values of x
heteroscedastic data
the vertical spread of the data is unequal over the values of x
normal approximation within a vertical strip
mean* = mean of y + (Zx x r x SDy)
SD*y = RMS error
prosecutor's fallacy
where it is assumed that the probability of a random match = the probability that the defendant is innocent
conditional probability
the probability that one event happens given that another event is already known to have happened: P(A | B) (probability of event A given event B)
independent events
The outcome of one event does not affect the outcome of the second event
dependent events
The outcome of one event does affect the outcome of the second event
probability of A AND B
P(A) x P(B | A)
mutually exclusive events
events that cannot happen at the same time
probability of A or B if mutually exclusive
P(A) + P(B)
probability of A or B if not mutually exclusive
P(A) + P(B) - P(A and B)
How many different ways to arrange a set of n objects?
n!
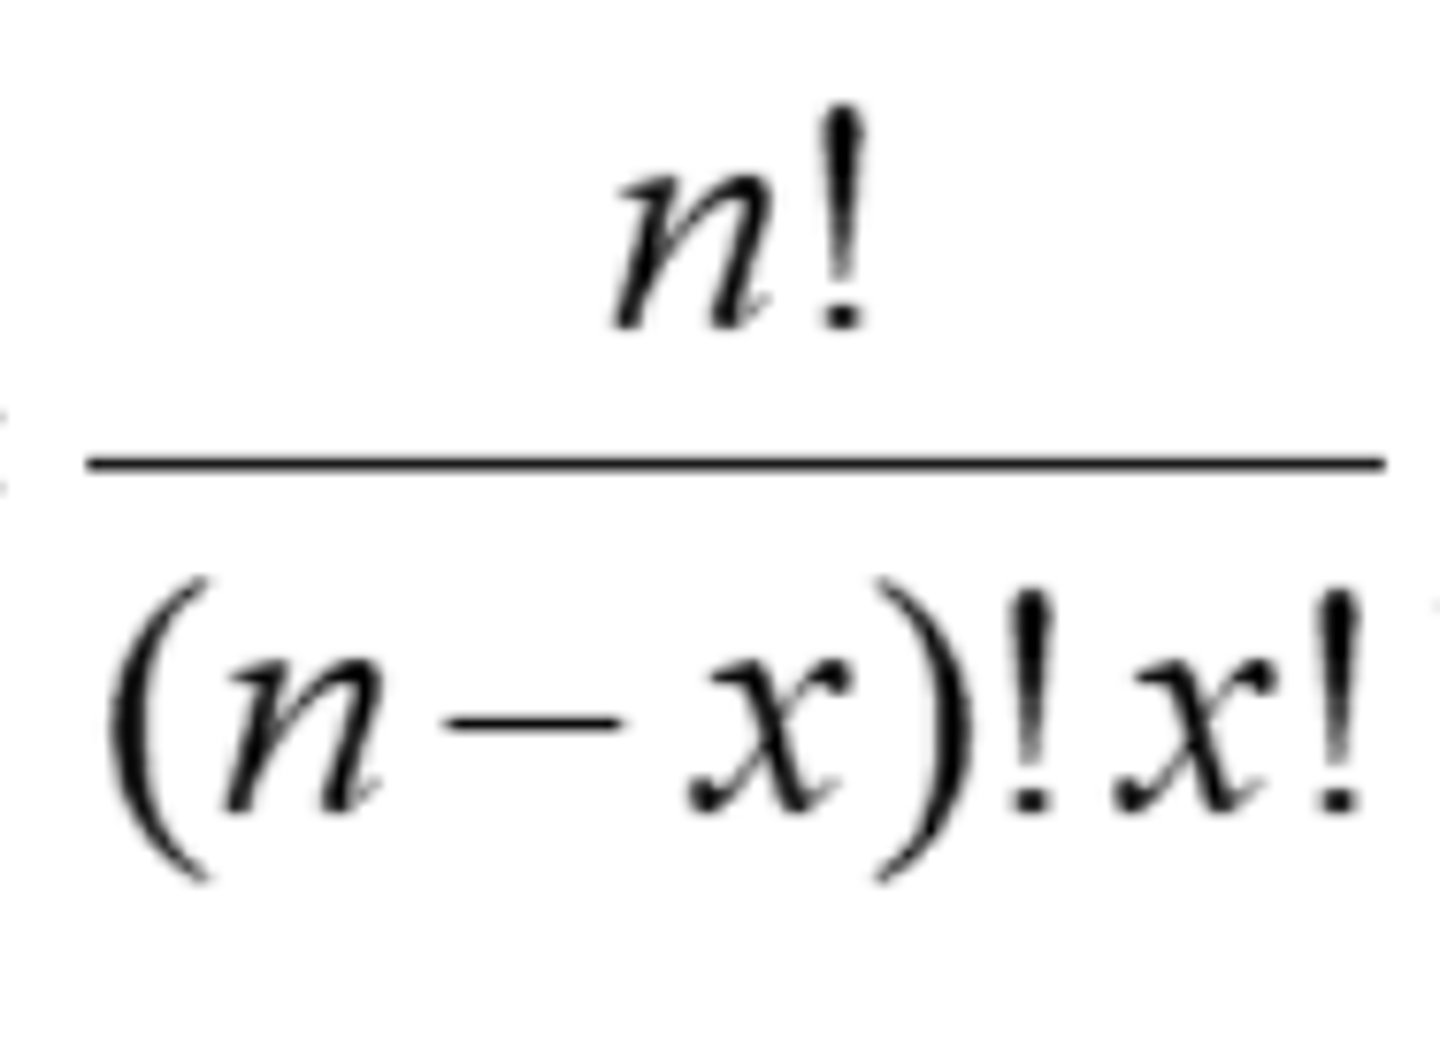
If you have a set of n objects and randomly select x objects from the set, how many possible combinations are there?
n choose x
binomial model
Predicting the number of successes in a fixed number of binary trials
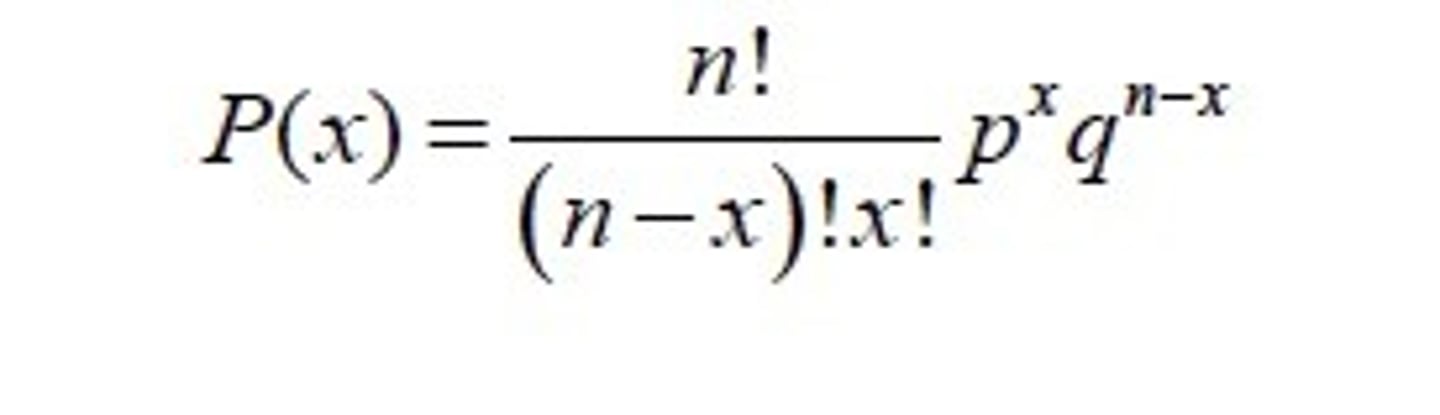
If you have n binary trials, with one event having p chance to occur, what is the probability that the event occurs exactly x times?
binomial theorem formula
law of large numbers
as the length of a simulation increases (i.e. sample size increases), the proportion of a certain event approaches a fixed relative frequency
As sample size increases, does the relative error increase?
No - the absolute error will increase, but the error relative to sample size will decrease
box model
a model for describing chance processes
expected value for sample sum
EV = n * mean (n is the sample size)
standard error for sample sum
SE = SDbox * sqrt(n)
expected value for sample mean
EV = mean of box
standard error for sample mean
SE = SDbox / sqrt(n)
SD of a binary box
SE = (x - y)sqrt(% of x * % of y)
central limit theorem
The theory that, as sample size increases, the distribution of sample means of size n, randomly selected, approaches a normal distribution (usually n > 30)
continuity correction
Adjustment made when a discrete random variable is being approximated by a continuous random variable (0.5)