General Lab Practice Lecture 2
 Call Kai
 Learn
Learn Practice Test
 Spaced Repetition
 Match
Match Flashcards
 Knowt Play
1/29

Earn XP
Description and Tags
Name | Mastery | Learn | Test | Matching | Spaced | Call with Kai | Chat |
|---|
No analytics yet
Send a link to your students to track their progress
30 Terms
The complete set of all observations that might occur as a result of performing a particular procedure according to specified conditions: all possible values for a particular characteristic
Impossible to study in their entirety
Characteristics are described by parameters
- Populations mean, median, population variance, population standard deviation
Example: All fasting glucose levels of all hospitalized patients in the US
Population
A subgroup of observations taken from the population used to form conclusions about population characteristics
Example: all fasting glucose levels of the babies in the NICU at Saint Francis Hospital
Sample
Each member of the population has an equal chance of being selected
Characteristics are described by statistics
sample mean, sample standard deviation, and coefficient of variation
Statistical analysis and interpretation depends on the assumption of a random sample from a fixed population
Random sample
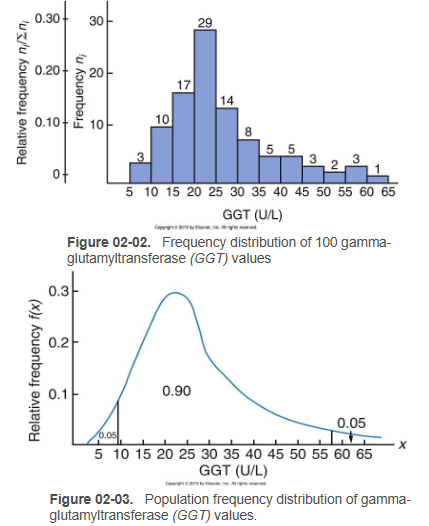
A graphical device for displaying a large set of data: Histogram
presents the number of times a given value occurs
constructed by diving the measurement scale into cells of equal width counting the number of values (n_i) that fall within each cell and drawing a rectangle above each cell whose height is proportional to n_i
Tends to form a normal, or Gaussian distribution
Frequency Distribution
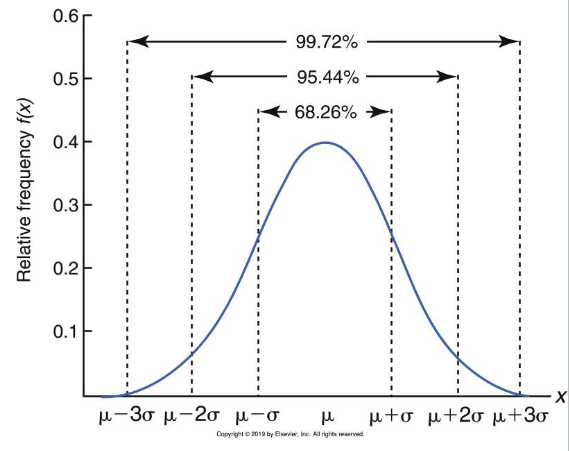
Also known as normal distribution. Is a relative frequency distribution that forms a bell-shaped curve and is composed of an infinitely large number of values.
During measurement it is assumed that values will follow a normal distribution with an equal number of measurements above and below the mean value.
Statistical procedures are based on the assumption of a Gaussian distribution of values
Mean, median, and mode are identical
Tails of the curve are asymptomatic to the baseline (curve gets close to the x-axis without touching it)
Gaussian Distribution
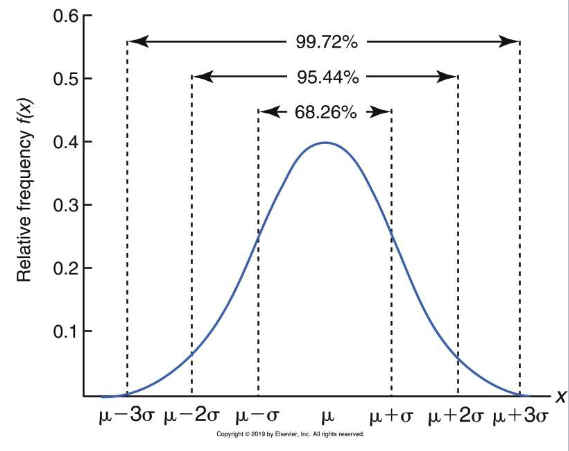
Large populations tend to form this type of frequency distribution
A subset of large population by random sample draw will have a frequency distribution very close to normal
A constant relationship exists between the standard deviation and the probability of values occurring in a population sample
The probability of the same observation having a value between the mean and 1 standard deviation greater than the mean is 34.13%. The probability of a value between ±1SD of the mean is 68.2%. The probability of an observation having a value within ±2SD of the mean is 95.44%. The probability of an observation having a value within ±3SD of the mean is 99.27%
The relationship between the frequency distribution curve and the SD applies only to normal distribution and not all populations will form a normal distribution
Characteristics of a Normal/Gaussian Distribution
_________ of a normal curve depends on how the data points are concentrated around the center of and toward the tails of the curve.
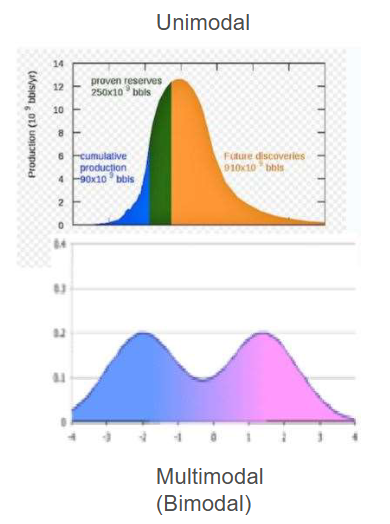
There are four characteristics of a set of data that are illustrated by a distribution curve
Measure of central tendency is how data points fir around the center (or the highest point or points) of the distribution
One point = unimodal
Multiple points = mean, median, and mode
Line of central tendency is the area in the distribution pattern where most of the observation seem to accumulate (does not have to be the mean)
Variation
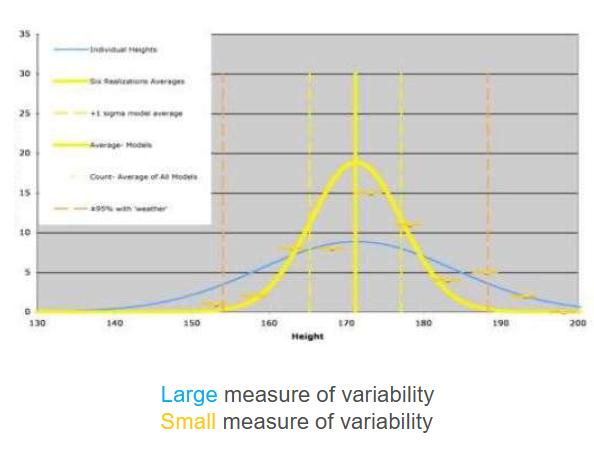
Measure of __________ is how widely the data points are scattered around the center of the distribution.
A curve that flattens out and extends widely to each side has data with a greater pattern of variation than the one with a sharp peak and narrow base
Range, variance, standard deviation, and coefficient of variation
Variability
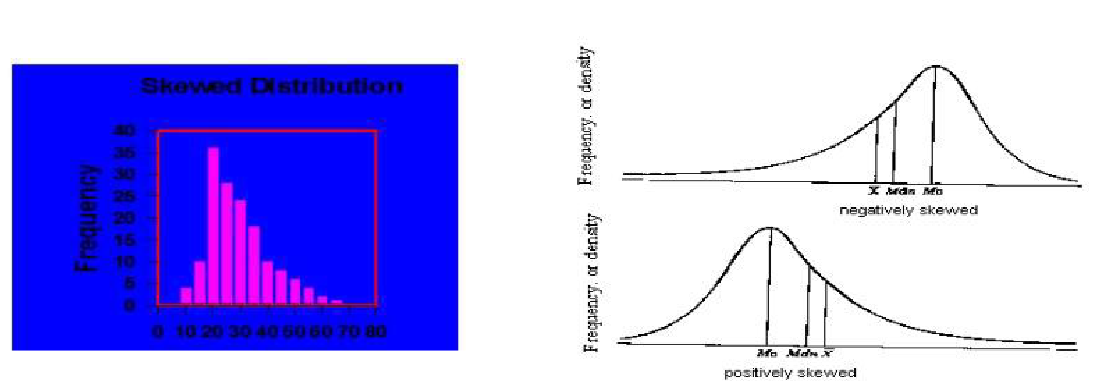
_________ of the curve about the center is whether the data points are evenly arranged around the measure of central tendency or skewed with the tail to the right (positive) or to the left (negative)
Symmetry
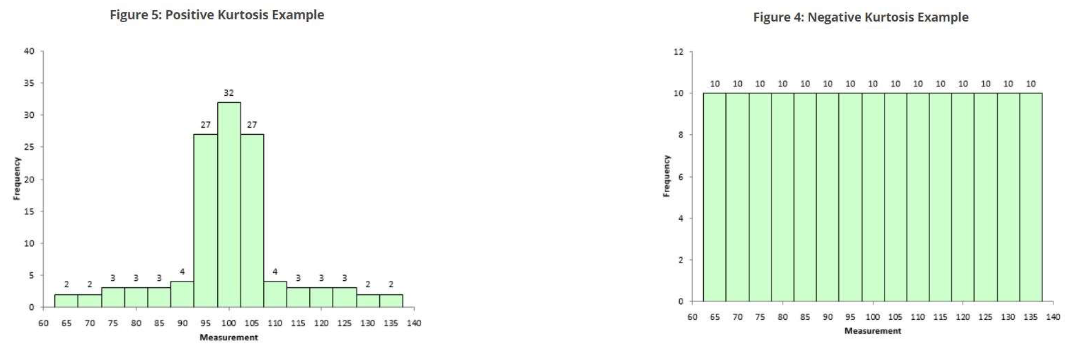
_________ is how the data points are distributed along the base of the distribution diagram with regard to the relative frequency of data appearing at the center point and each flank, with thinning of data between the center and the tails.
Increases as the tails become heavier (negative)
Decreases as the tails become lighter (positive)
Kurtosis
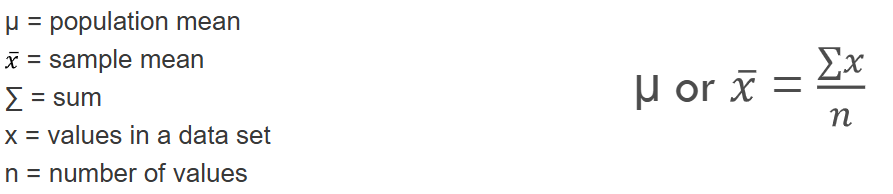
__________ of a set of data is obtained by adding all the numbers in the set and diving the sum by the number of values in that set
Arithmetic Mean
_________ is the middle value of a body of data ranking variables in order of increasing magnitude; the 50th percentile
With an even number of observations, the average of the middle two values becomes the median value
Median
________ is the most frequently occurring variable in a mass of data; the value at the peak of the frequency distribution curve
Mode
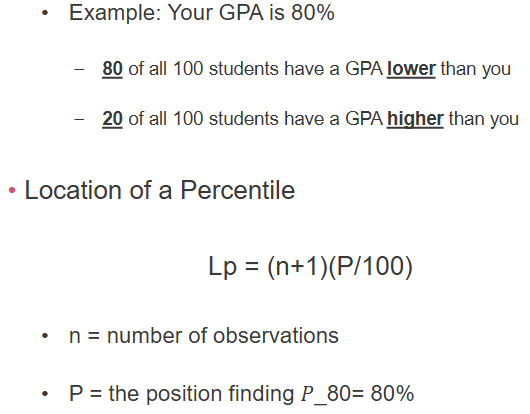
________ is the percentage of scores in the whole distribution that fall below the score that is being compared
Percentile
_________ the spread of data around the mean
Range
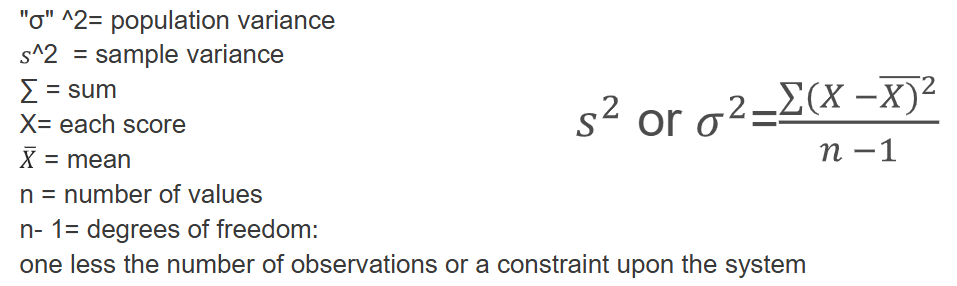
____________ (s²) reflects dispersion around the mean and is the square of the standard deviation
Variance
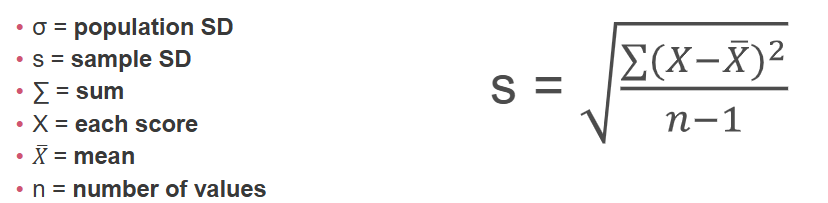
__________ measures dispersion of the variable about the mean and is the square root of teh variance
The larger the spread of the distribution curve, the larger the standard deviation (large SD indicates the data is not very uniform)
The narrower and more pointed the distribution curve, the smaller the standard deviation (SD) (small SD indicates the data is more uniform)
Standard Deviation

The ratio of the standard deviation to the mean: Also known as relative standard deviation
Reflects random variation of analytical methods in units that are independent of methodology, because it is a percentage comparison
Relates the SD to concertation as a percentage
Used for comparing the dispersion of two similar sets of data. It is an index of precision
Coefficient of Variation
_____________(Ho) is a probability theory that states there is no difference between two sets of values which are being compared
Used to determine if a difference exists; based on the calculation of the mean and variance for each series of numbers
Statement is not rejected unless the sample data provides convincing evidence that it is false
Rejected when test statistic (F test or t test) is large
If the ________________ is not rejected we cannot say the statement is true, we have just failed to disprove Ho
It is almost impossible to prove something by statistical methods
Null hypothesis
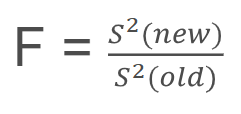
____________ is a test statistic based on the comparison of the variance values from two or more series of numbers
Interpreted by comparing the calculated F value to a critical F value which is obtained from a statistical table
Null hypothesis is rejected when the observed F value is greater than the critical F value
F Test
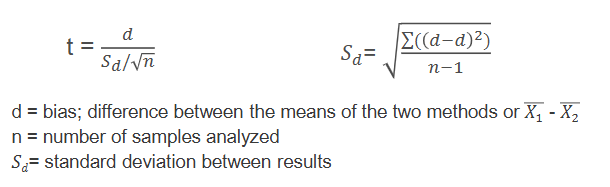
_________ is a test statistic based on the comparison of mean values from two or more series of numbers or methods
Determines if the two means are significantly different
Interpreted by comparing the calculated t value with a critical t value which is obtained from a statistical table
Null hypothesis is rejected if the calculated t value is greater than the critical t value
T test

_________ an equation that expressed the linear relationship between two variables
Describes the graphical plot of test values versus reference values when comparing method experiments
A line is drawn through the data points using visual judgement (line of best fit)
Linear Regression
_________- is the technique to determine the best fit for the line by measuring the distance from each point to the line, squaring the distance, then totaling the squares
The line with the lowest total is called the least squares line and should be the best line
Least Squares Analysis
____________(r value) determines if two series of numbers are related positively, negatively, or not at all
r should be very near 1.000 when performing a calibration
values less than 1 are due to random error
Accuracy of method should not be judged based on r value
Systematic error has no effect on r
Only use of r in comparison of methods is to assess the reliability of the linear regression estimates of slope and y intercept
Correlation coefficient
What is the formula for arithmetic mean?
Sum of values/number of values
Given the following values: 100, 120, 150, 140, 130 what is the mean
128
The middle value of a data set is statistically known as the
Median
The most frequent value in a collection of data is known as
Mode
Which of the following is the formula for coefficient of variation
(SD x 100)/mean
The following 5 control values in unit (nEq/L) were obtained: 140, 135, 138, 140, 142)
Calculate SD
Calculate CV
SD=2.65
CV=1.9%