Data Interpretation
1/130
There's no tags or description
Looks like no tags are added yet.
Name | Mastery | Learn | Test | Matching | Spaced |
|---|
No study sessions yet.
131 Terms
The two types of data are:
Qualitative and quantitative
Quantitative data includes:
Numbers, facts, information that is not up for interpretation
Data about the median income in a town is collected
Which concept is demonstrated above?
Quantitative data
Qualitative data is often found in:
Word form
Qualitative data comes from:
Surveys, interviews
Qualitative data is up for:
Interpretation
Qualitative data ______
Describes qualities or characteristics
Data is collected using descriptions students give about how good school lunch tastes
Which concept is demonstrated above?
Qualitative data
Two types of statistics are:
Descriptive and inferential
Descriptive statistics is when researchers ______ data
Organize and describe
Inferential statistics is when researchers:
Make predictions about data and independent variables
Inferential statistics help researchers determine if the data from a sample can be:
Applied to a population
In a study about the effect of a therapy on mood, the average mood score on a scale of 1 to 100 constitutes ______, while using a t-test to determine if the therapy works for all depression sufferers, not just the study group is known as ______
Descriptive statistics; inferential statistics
Inferential statistics make ______ about a population
Generalizations
Inferential statistics make generalizations about a population based on:
A sample
Inferential statistics help researchers test a:
Hypothesis
Inferential statistics provide insight into the:
Results of a study
Inferential statistics provide insight into the results of a study to determine if there was ______ in the study
Bias
Inferential statistics provide insight into the results of a study to determine if the results are:
Statistically significant
A hypothesis is a:
Specific, testable prediction about the relationship between two or more variables
A null hypothesis is a claim that there is:
No effect of difference between the variables
The null hypothesis serves as a:
Baseline for testing
Before conducting an experiment, researchers make the claim that “There is no difference in memory scores between people who drink coffee and those who drink water”
Which concept is demonstrated above?
Null hypothesis
Two types of hypothesis:
Null and alternative
An alternative hypothesis claims that there is:
An effect or difference between variables
An alternative hypothesis is typically what the researcher is:
Seeking to show
Before conducting a study on sleep, researchers make a hypothesis, saying that "Adults who get 8 hours of sleep will score higher on memory tests than those who sleep 5 hours”
Which concept is demonstrated above?
Alternative hypothesis
The p-value provides insight into the ______ of a study’s results
Statistical significance
The p-value can range from:
0 to 1
The p-value lets researchers know if they should:
Accept or reject the null hypothesis
If a p-value is less than or equal to 0.05, the results of the study are:
Statistically significant
Results of the study being statistically significant means that they were most likely not:
Caused by chance or luck
A p-value of 0.03 means that we would reject the:
Null hypothesis
A p-value of 0.03 means that we would accept the:
Alternative hypothesis
A p-value of 0.03 means that variables are most likely:
Connected
The smaller the p-value, the stronger the:
Evidence against the null hypothesis
The smaller the p-value, the more likely that:
Results are statistically significant
The larger the p-value, the more likely it is that the results were:
Due to chance or luck
A p-value of 0.9 means that there is a ______ chance that the results were due to chance or luck
90%
If the p-value of 0.9, we should reject the:
Alternative hypothesis
If the p-value of 0.9, we should accept the:
Null hypothesis
Effect size tells us the:
Strength of the relationship between variables
Effect size tells us how:
Meaningful the effect is in real world terms
In a study comparing two groups, a large effect size means that there is a:
Substantial difference between the groups
In a study comparing two groups, a small effect size means that there is a:
Minor difference between groups
A study is done on a new therapy. The p-value is 0.05, meaning that the therapy:
Likely has an effect
A study is done on a new therapy. The effect size is only 0.2. This means that the improvement of the therapy is:
Minimal
Effect size tells us how ______ the differences or relationships are in a study
Big or meaningful
Statistical significance tells us whether differences between groups are:
Real or due to chance
Statistical significance shows us if the results:
Matter
Effect size shows us how much:
Results matter in real life
A frequency distribution table allows researchers to see:
How often sets of data occur
On a table, student test scores are displayed, with the number of students getting each score also included (e.g. 2 got 5, 3 got 6, and 7 got 10)
Which concept is demonstrated above?
Frequency distribution table
Researchers use the frequency polygon as a visual representation of a:
Frequency distribution table
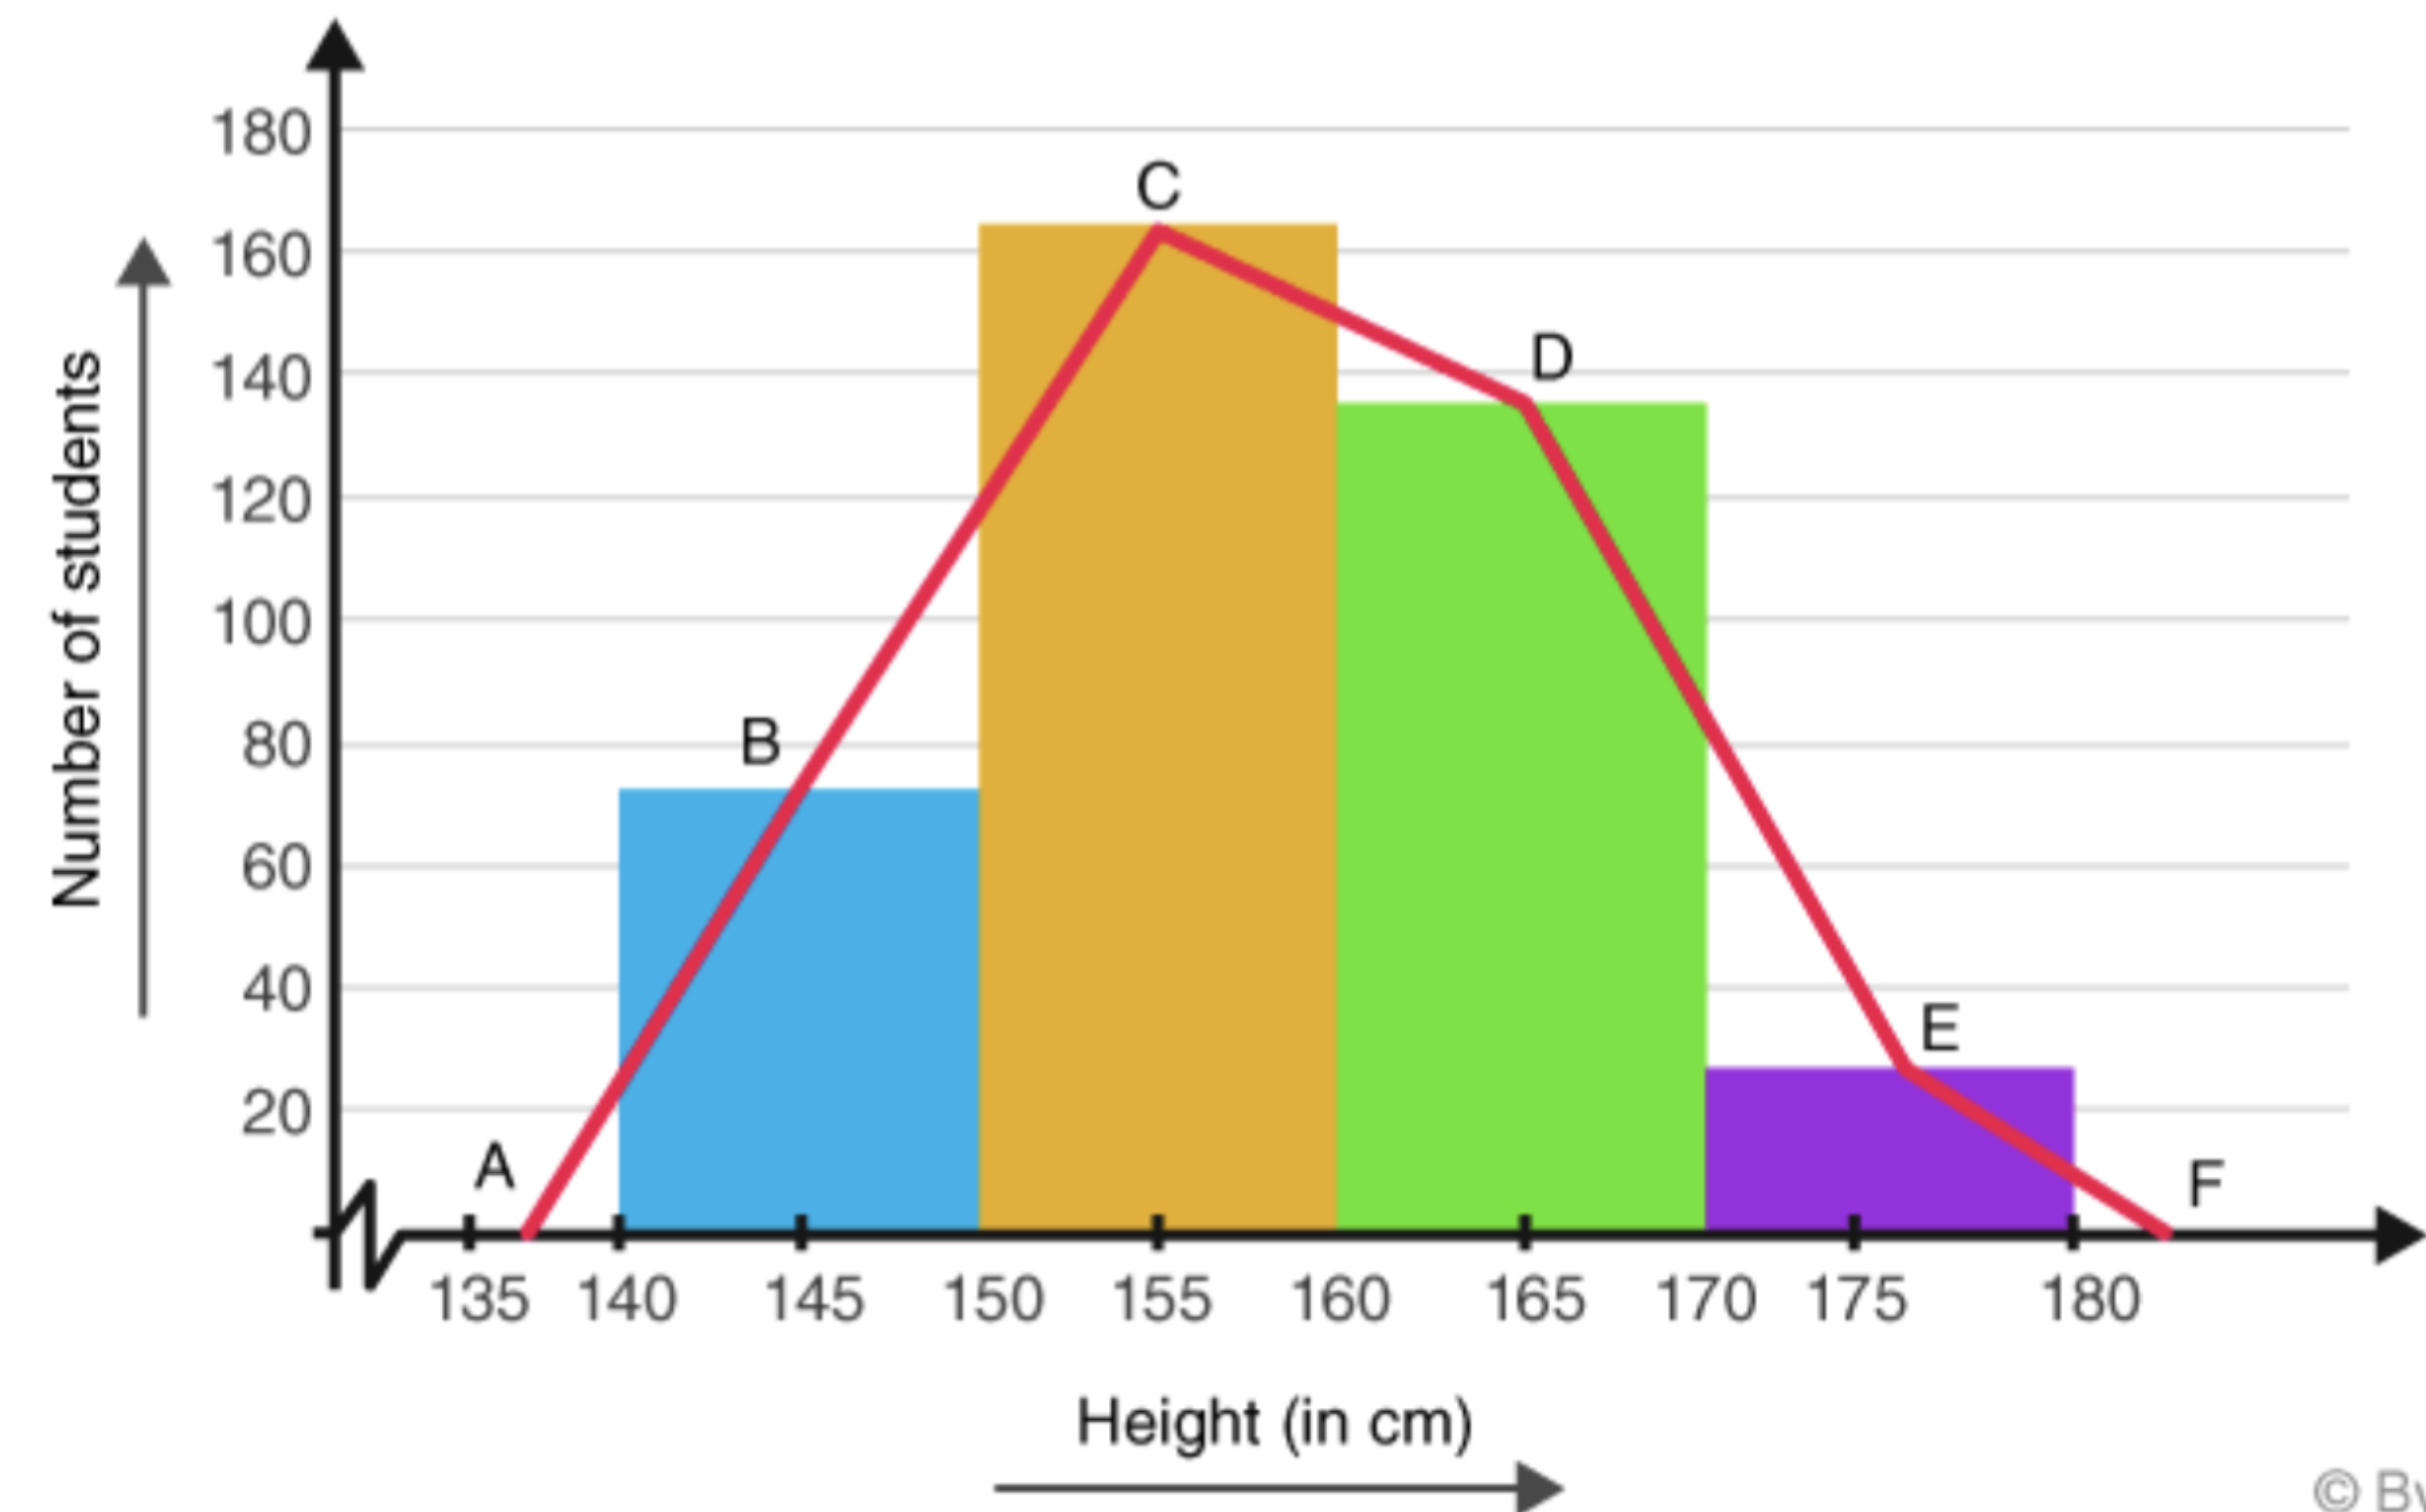
Which concept is demonstrated above?
Frequency polygon
A frequency polygon highlights:
Connections between points on scatterplot
A histogram is a way in which researchers:
Display data
Histograms are ______ graphs
Bar
Histograms show frequencies through:
Vertical columns
A histogram is different from a bar graph in that it does not have:
Space between bars
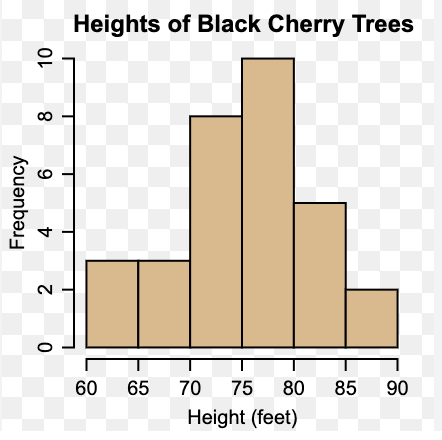
Which concept is demonstrated above?
Histogram
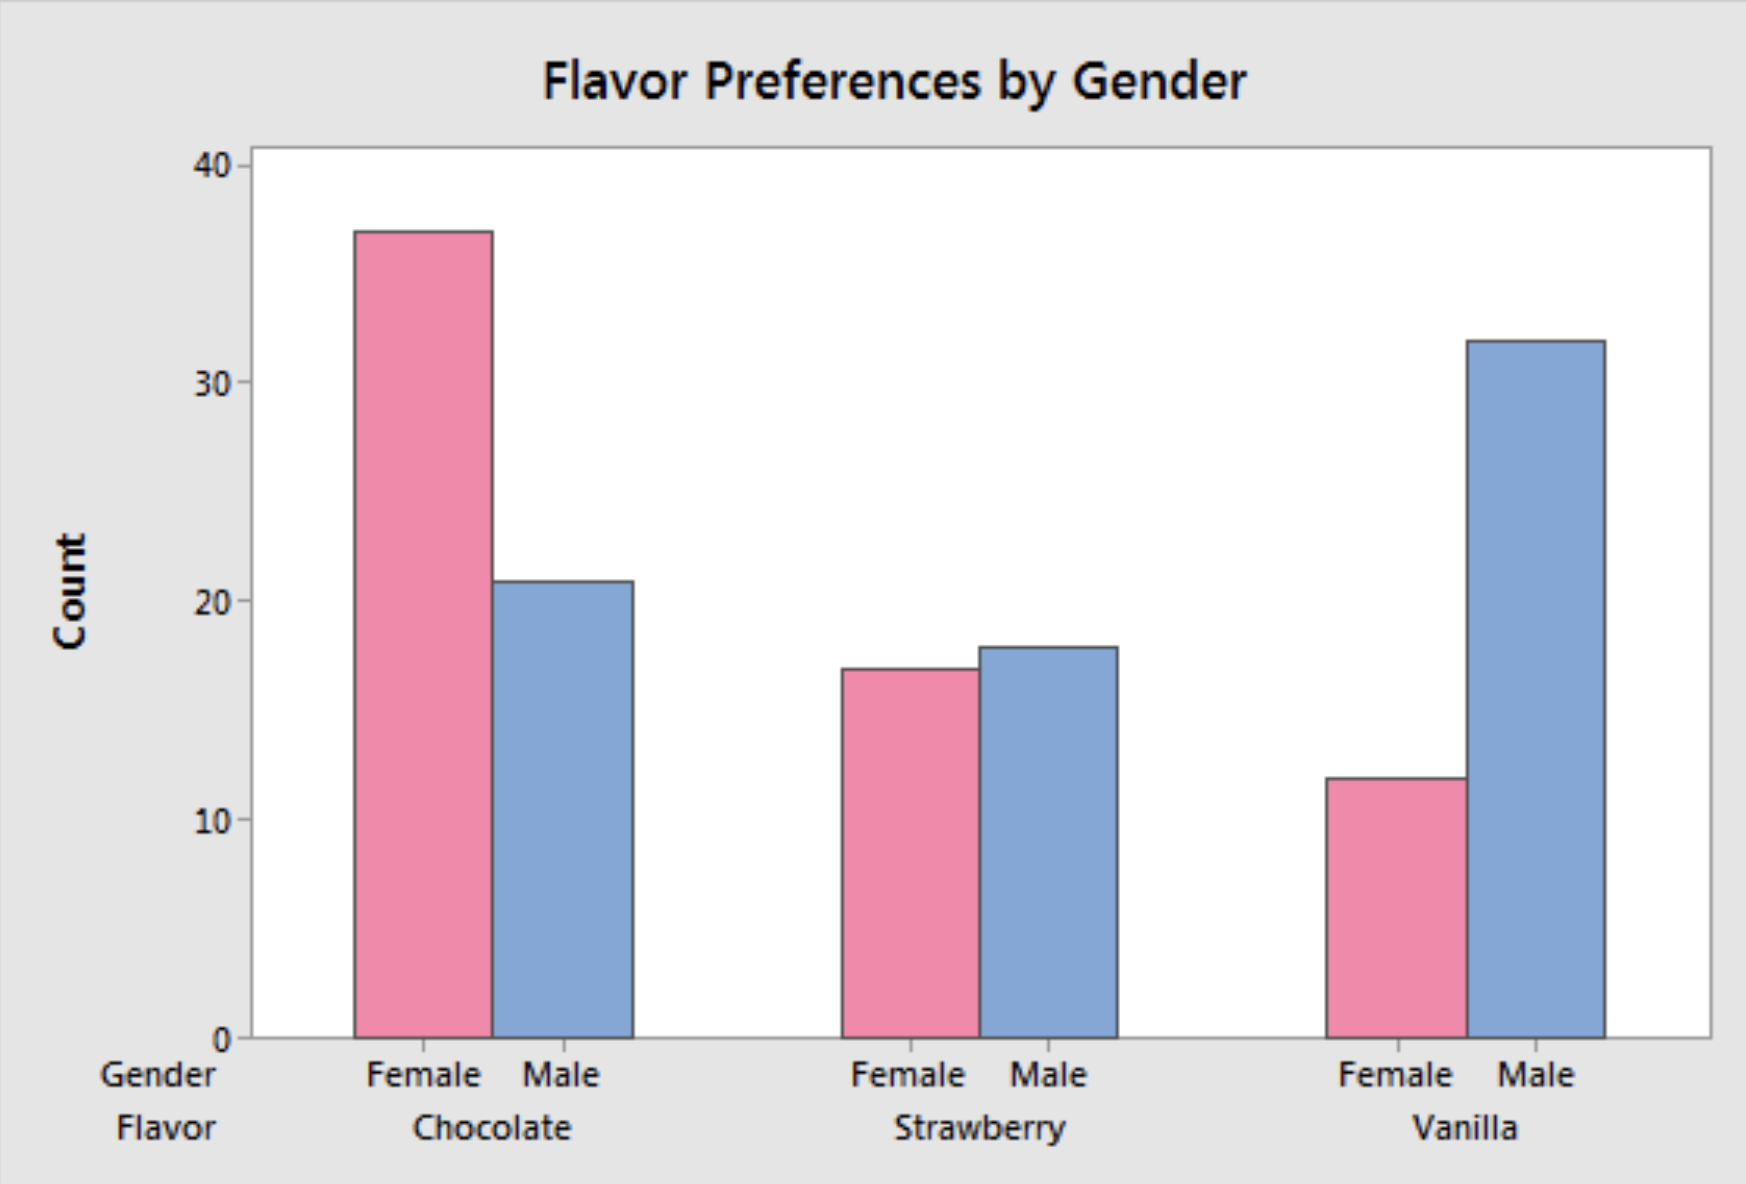
Which concept is demonstrated above?
Bar graph
In a pie chart, data is divided into:
Sections of a circle
In a pie chart, each section represents a:
Proportion of the whole
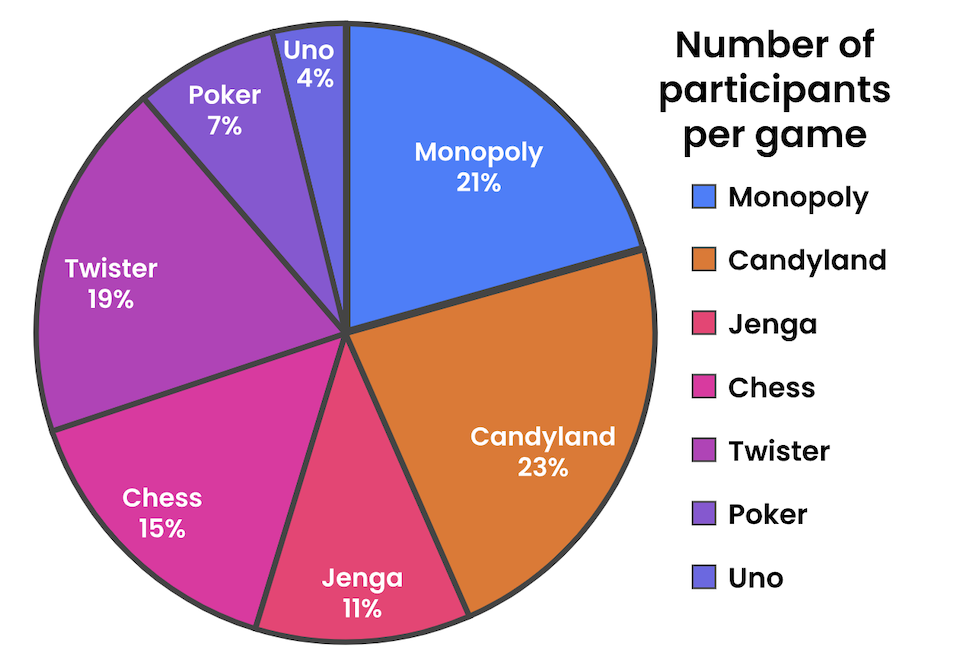
Which concept is demonstrated above?
Pie chart
Central tendency includes:
Mode, median, and mean
The mean is the ______ of the data set
Average
To define the mean, you should:
Take the sum of values and divide by amount of values added together
What is the mean in this data set: 5,5,9,12,15,22,30
14
As more data is collected, we will start to see a:
Regression towards the mean
A regression toward the mean happens when _____ are followed by results that are:
Outliers; closer to average
Outliers mean _____ results
Very high or very low
You play basketball and usually score 15 points per game. However, tonight, you had an amazing game and scored 30 points, which most likely is due to the opponents not playing well. Therefore, after this one incident, you go back to scoring 15 points per game
Which concept is demonstrated above?
Regression toward the mean
Regression toward the mean happens since outliers are most likely influenced by:
Luck
The more extreme the outlier, the more ______ is likely to occur
Regression
To find the mode, you have to look at the value that:
Occurs the most often
What is the mode in this data set: 5,5,9,12,15,22,30
5
The median is the score that is:
At the middle of a data set
What is the median in this data set: 5,5,9,12,15,22,30
12
Before finding the median, you have to:
Organize data from smallest to largest
What is the median in this data set: 5,5,9,12,15,22,30,32
13.5
Central tendency is good for providing a ______ of the data collected
Snapshot
Central tendency doesn’t allow us to see how data is:
Dispersed
Measures of variability tells us how data is:
Dispersed
Measures of variability includes:
Range and standard deviation
To calculate the range, you need to:
Subtract highest value from lowest value
What is the range in this data set: 210,115,100,205,95,115,200,115
115 (210-95)
Standard deviation allows researchers to indicate the ______ for a data set
Average distance from the mean
A normal distribution takes the shape of a:
Symmetrical, bell-shaped curve
In a normal distribution, there is ______ mode
1
Location of mean, median, and mode for normal curve:
Center of distribution, 0 point value
Is normal distribution the most common frequency distribution?
No
Normal distribution is not the most common frequency distribution since it is more common that data will have a:
Positive or negative skew
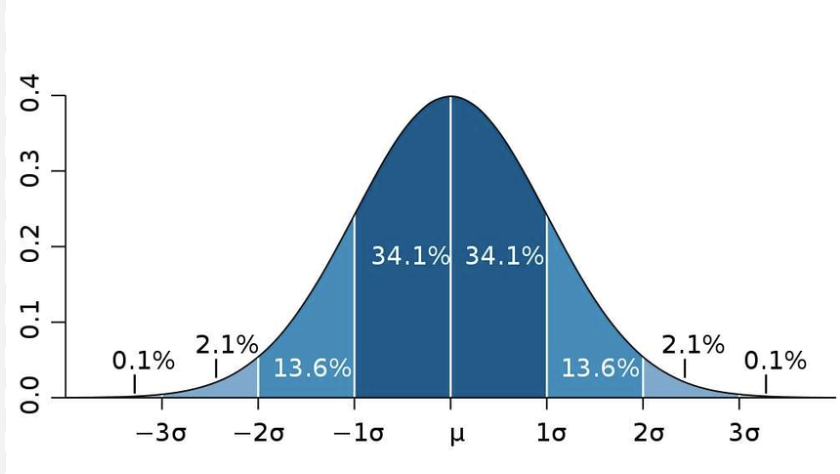
Which concept is demonstrated here?
Normal distribution
A positive skew occurs when scores are:
Low
A positive skew occurs when scores are clustered to the ______ of the mean
Left
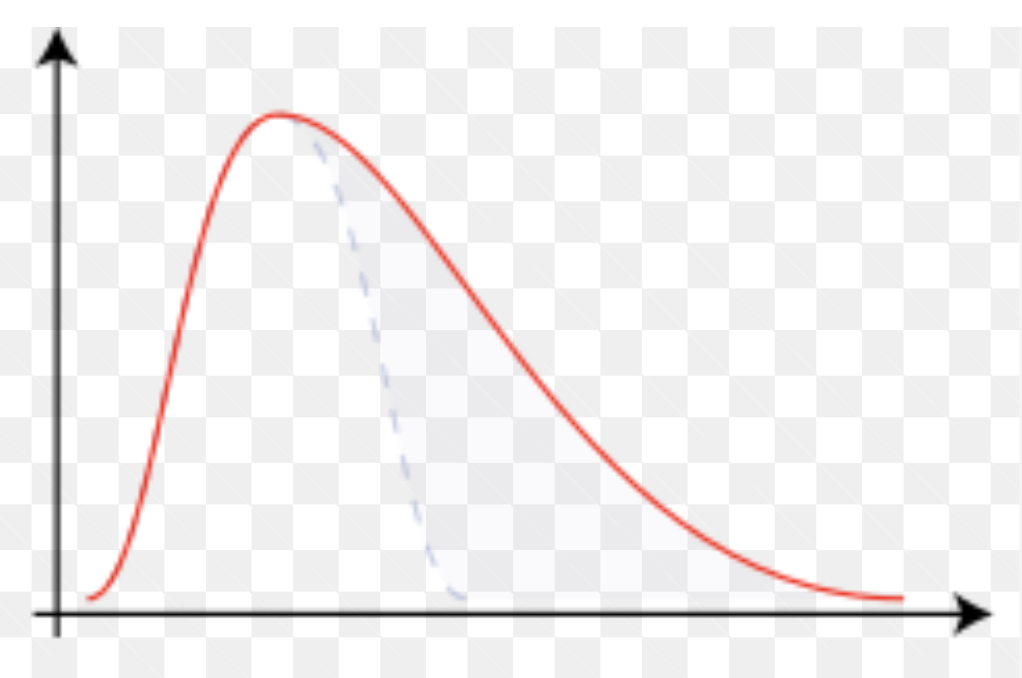
Which concept is demonstrated here?
Positive skew
A negative skew has ______ scores
High
In a negative skew, high scores are clustered on the ______ of the mean
Right

Which concept is demonstrated above?
Negative skew