Unit 5: Ecology Bio II Final
1/63
There's no tags or description
Looks like no tags are added yet.
Name | Mastery | Learn | Test | Matching | Spaced |
|---|
No study sessions yet.
64 Terms
What is ecology?
the study of interactions between
living organisms and their environment
Levels of ecology
Organismal
• Individual organisms
Population
• Members of the same species living in the same area at the same time
Community
• All species living in the same area at the same
time
Ecosystems
• Includes all biotic and abiotic components of an
area organism
Biogeography
the study of the distribution of organisms and the abiotic factors that determine those distributions
Species distribution
Which species live in which areas and why
Determined by biotic and abiotic factors
Endemic species
species that are found only in a specific geographic range
Generalist species
species that are found in many geographic ranges
Abiotic Factors
Energy Sources, Temperature, Water, Inorganic nutrients and soil, Oxygen, Wind, Fire,
Terrestrial Biomes
Determining factors are temperature, sunlight and precipitation (seasonality)
Tropical wet forset biome
Temperature and sunlight are stable year round
Plants have year-round growth
Significant precipitation
highest animal and plant diversity
Savannah
Hot temp
minimal precipitation
Fire is important abiotic factor
Subtropical Desert
Intense temperature swings
Precipitation is basically negligable
Chaparral
Significant daily temperature swings
Precipitation: Winter rainfall , dry summers
Temperate
Grasslands
Seasonal temperature fluctuation
• Warm summers and cold winters
Precipitation: Annual, periodic rainfall, only winter is dry
fire is an important regulator
Temperate Forest
Seasonal temperature fluctuation
• Warm summers and cold winters
Predictable annual rainfall, it is constant
Deciduous trees
Soil rich in inorganic and organic material
Boreal Forest
Low annual temperature
• Cool, wet summers
• Cold, dry winters
Predictable annual precipitation, mostly snow not rain
conifer trees
Lower species diversity than temperate forest
Artic Tundra
Very low annual temperature
Extreme sunlight conditions
• 24 hours in summer, 0 hours in winter
Extremely low annual precipitation, mostly snow
Permafrost soil
Low species diversity
Aquatic Biomes
Water itself is the medium in which organisms live
• Different physical and chemical properties than air
Ocean
Categorized by zones based on light penetration (photic, aphotic,
abyssal)
Intertidal zone is area between low tide and high tide
Neritic zone extends from intertidal zone to depth of 200 meters
• Photosynthesis occurs
Oceanic zone is open ocean
Benthic zone is at the bottom of all zones
• Nutrient rich due to detritus that falls to ocean floor
• Very cold, high pressure, high oxygen, low nutrient
Coral Reefs
Symbiotic relationship between coral polyps (cnidarians) and algae
Located in the photic (light) zone and warm waters
Coral organisms secrete calcium carbonate that forms the reefs
Coral reefs support great diversity of invertebrates and vertebrates
Acidification of the water by carbon dioxide and climate change threatens coral reefs
Estuaries
Where ocean and freshwater meet
Brackish water
nurseries for many species of fish and
invertebrates
Salinity varies considerably
Nutrient rich
Biomass is high but biodiversity is low
Freshwater: Ponds and lakes
Great variety in size of lakes and ponds
Lentic water (not flowing)
Temperature is most important abiotic factor
• Thermal stratification in summer
• Warmer water at top and cooler water at bottom
• Reverses in winter
Light penetrance determines photosynthetic organisms
• Base of food chain
• Deeper light penetrance, more photosynthetic organisms
Nitrogen and phosphorous are limiting factors
• Determining factor for phytoplankton
Run-off from farms, yards, etc. lead to eutrophication of lakes
• Increased algae growth
• Blocks light penetrance
• Consumes majority of dissolved oxygen
• Lake/pond is polluted
Freshwater: River and Streams
Great variety in size of rivers and streams
• Lotic water (flowing)
• Carry water from headwaters (source) to lake or ocean
Rate of flow is an important abiotic factor
Slower flow brings more debris and plakton and warmer temp
Wetlands
Soil is permanently or periodically saturated with water
Vegetation is rooted in the soil but extends above surface of
water across entire surface area
Wetlands have hydrophytic vegetation and hydric soil
Marshes, swamps, bogs, mudflats, and salt marshes
population
a group of individuals of the same species
living in the same area at the same time
Size versus density
• Population size (N) = total number of individuals
• Population density (Dp) = # of individuals within a specific area
How to sample populations
Quadrat used for immobile organisms such as plants
• Square area (typically 1 m2)
• Multiple quadrats placed randomly within habitat
• Count number of individuals within quadrat
Mark and Recapture used for mobile organisms such as
animals
• Capture animal, apply marking (band, tag, paint, wing clips)
• Release back into habitat
• At later time, capture animals again. Will get mix of marked
and unmarked animals
• Ratio of marked to unmarked help determine density
Types of dispersion
How individuals are distributed throughout the habitat
• Uniform dispersion
Individuals are equally spaced
• Random dispersion
Individuals are distributed randomly with no pattern
• Clumped dispersion
Individuals are clustered in groups
Survivorship curves
what are the differences between the three curves, what type of reproduction, what type of animals
Type I curve:
• Low death rate in early and middle
years
• Higher death rate in older
individuals
• Found in species that produce low
number of offspring/parent and
provide high amount of parental
care
• Elephants, Apes
Type II
Mortality rate increases
consistently as animal ages
• Found in species that produce
“normal” number (approximately 3-
10) offspring/parent and provide
significant but brief amount of
parental care
• Birds, rodents
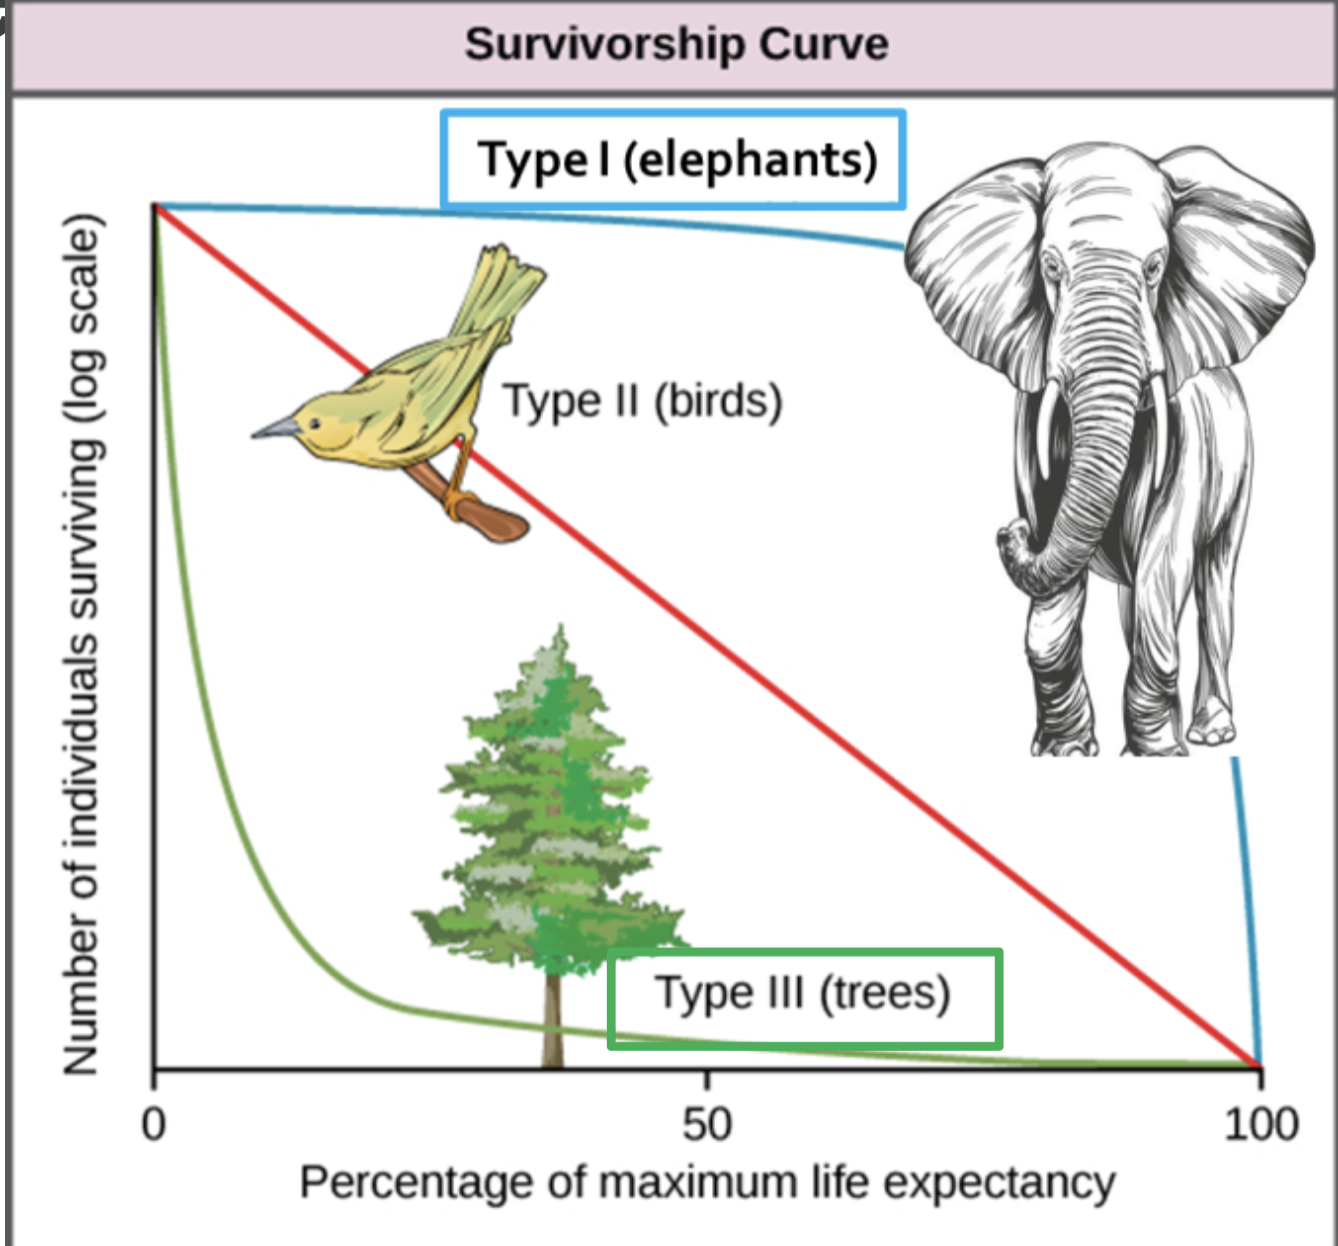
Type III
Very high death rate in early life
• Death rate declines as individuals
age
• Found in species that produce
many offspring/parent and provide
little or no parental care
• Plants, fish, insects
Life Histories:
Early versus late reproduction
Early Reproduction
• Individual reproduces at early age
• Produces more offspring but, at expense of self growth and
maintenance
• Often do not live very long
Late Reproduction
• Individual reproduces later in life
• Produces fewer offspring
• Provides greater parental care
• Both contribute to high survival rate of offspring
• But, individual may not live long enough to reproduce
Both are examples of energy trade-off strategies
Life Histories:
Semelparity versus iteroparity
Individuals reproduce only once in their lifetime
• Use most of energy budget on reproduction, die as a result
• Produce many offspring, little or no parental care
• Low survivorship of offspring
• Annual plants, salmon
Individuals reproduce repeatedly during their lifetime
• Typically reproduce once per year
• Produce few offspring, provide parental care
• High survivorship of offspring
• Budget energy for maintenance of life and reproduction
• Birds, wolves, lions
Life Histories:
Fecundity
the potential reproductive capacity of an individual or population, representing the maximum number of offspring an organism could produce over its lifetime
Population Growth Models:
Exponential versus Logistic
Exponential Growth
• Population growth with unlimited natural
resources
• J-shaped growth curve
• Population (N) plotted over time
• Exponential growth only possible with
infinite resources
• Not realistic for most organisms
• Competition is real!
• Most successful will survive to pass on their
traits to offspring
Logistic Growth
• Population growth with limited natural resources
• Growth slows as population reaches
environmental carrying capacity (K).
• Maximum population size supported by environment
• S-shaped curve
• Initial exponential growth
• Greatest when population is at ½ carrying capacity
• Then growth slows as resources become limited
• Finally, growth levels off at carrying capacity
• Assumes all individuals have equal access to
resources
• Equal chance for survival
• Not realistic!
• Genetic variation means that some individuals
are better adapted to environment
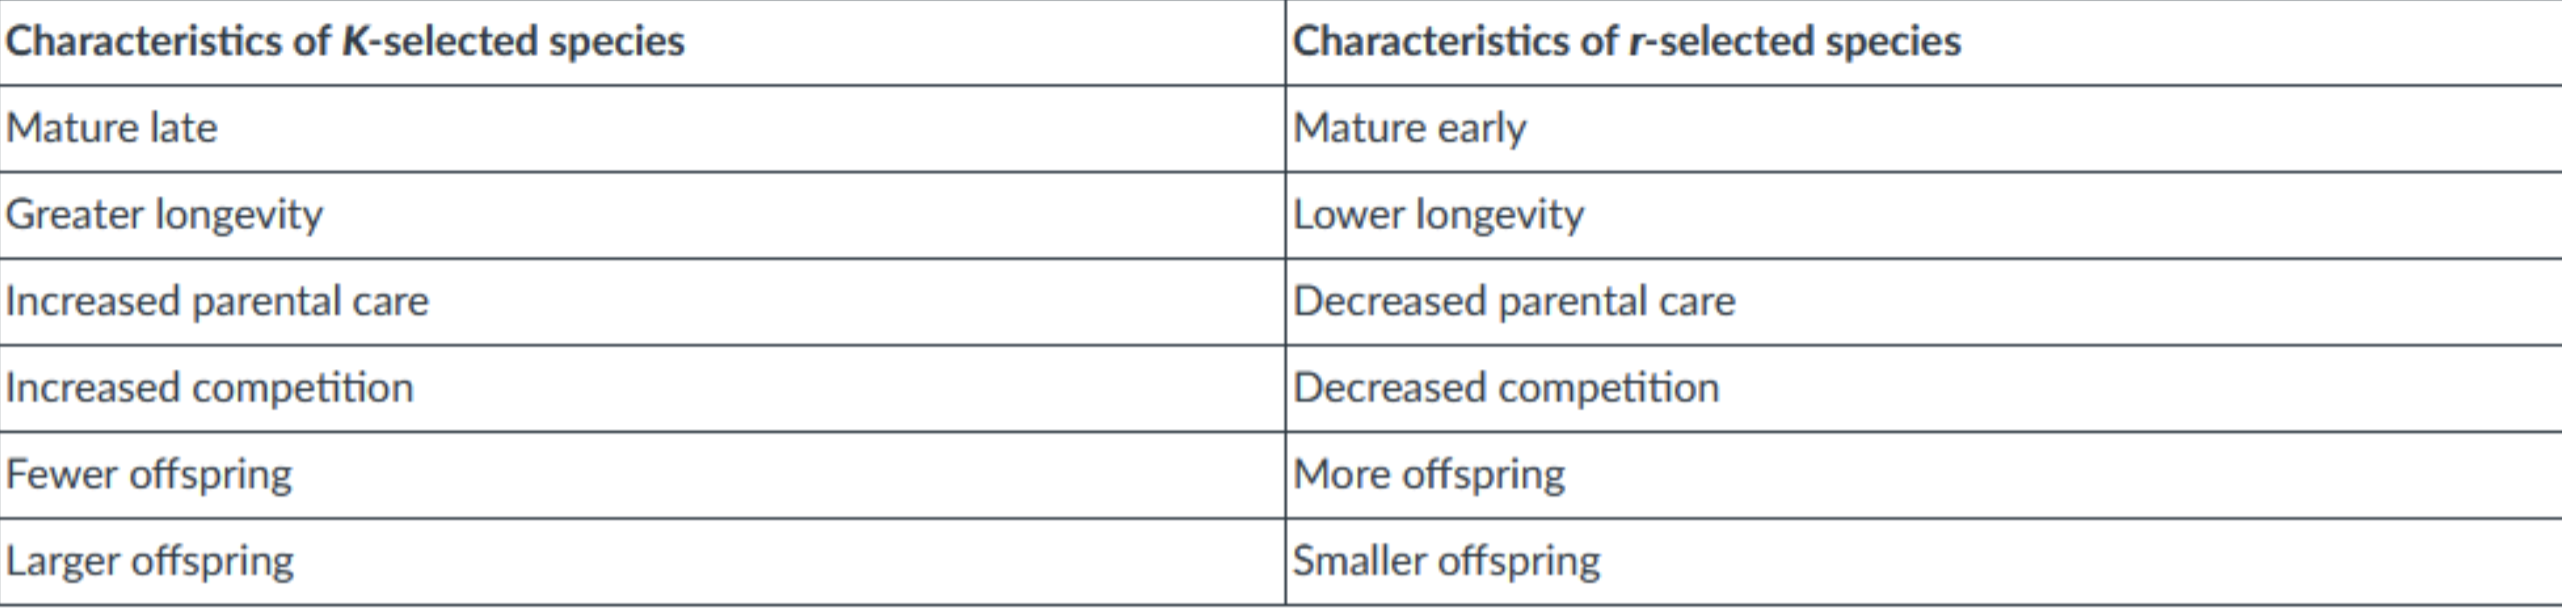
K-selection versus r-selection
Carrying capacity is regulated by:
• Density-Dependent factors
• K-selection
• Density-Independent factors
• r-selection
K-selection
Greater density = greater mortality
Reproduction:
• Few, large offspring
• Greater survival rate of each offspring
• Long gestation period
• Long-term parental care
r-selection
Greater density does not necessarily mean
greater mortality
Reproduction:
• Many, small offspring
• Lower survival rate of individual offspring
• Offspring grow/mature rapidly
• No long-term parental care or no parental care at all
What is a community?
includes all populations (all species) living in the same area at the same time
Species Richness:
The number of different species in the community
Species Evenness/Diversity:
# of species
occupying the same habitat and their relative
abundance
• How many different species are present, which
species are present, and the abundance of
individuals of each species are important
Species richness + species evenness
= species diversity
What is community ecology?
studies the interactions
between those different species
How are interactions defined?
Interactions are defined by whether they harm,
help or have no effect on the species involved.
Predation
Good for the predatory, bad for the prey
Prey animals evolve mechanisms to
escape predation
• Mechanical
• Chemical
• Physical
• Behavioral
Aposematic Coloration: Animals &
plants using chemical defense often
use bright coloration as a warning to
predators
Cryptic Coloration: Animals blend in
with their environment
Types of mimicry:
Batesian mimicry: harmLESS species
look like species that are harmFUL
Mullerian mimicry: Multiple species
exhibiting the same type of defense all
have same coloration
Herbivory
Good for the herbivore, bad for the plant
Plants develop defenses to herbivores
• Mechanical: thorns
• Chemical: toxins
Parasitism
One species benefits and the other is harmed by the interaction
Competitive Exclusion
Two or more species cannot occupy the same niche at the same time
Leads to Resource Partitioning
• Differentiation allows two or more species to
co-exist
• Use different part of the habitat
• Feeds at different time of day
Types of symbiotic relationships
Commensalism: One species
benefits from the interaction, the
other species is not helped nor
harmed
Mutualism: Both species benefit
from the interaction
Parasitism: One species benefits
and the other is harmed by the
interaction
Community Structure
Keystone species: a species
whose presence is key to
maintaining biodiversity in an
ecosystem
• Gopher Tortoise
Invasive species: a
nonnative species that
threatens the balance of the
ecosystem they are
introduced to
• Feral Hogs and Burmese Pythons
in Everglades
Ecosystem Ecology
the study of interactions between living
organisms and their environment
Disturbance
In response to disturbance, ecologists measure
• Resistance: the ecosystem’s ability to remain in equilibrium despite disturbance
• Resilience: the ecosystem’s speed of recovery after a disturbance
Food chains
A Food Chain is a linear sequence of energy
movement through organisms
Primary producers (plants) —>primary consumers (herbivores) —>
secondary consumers (carnivores) —> tertiary (apex) consumers (eat carnivores)
Food webs
A Food Web accounts for all interactions between different species within the ecosystem
Ecosystem Modeling
A Holistic Ecosystem Model quantifies the competition, interactions and dynamics of an ecosystem
Best type of study but expensive and time-consuming
• Unethical to alter an ecosystem just to study it
Mesocosm Model
• Partitions off part of ecosystem
Pro: In-situ (in place) study
• Con: partitioning organisms changes the dynamics
Microcosm Model
• Recreates ecosystem
• Pro: ease of study
• Con: removing organisms changes the dynamics
Trophic Levels
Ecosystem productivity is the percent of energy
entering the ecosystem as biomass at each trophic
level
• Biomass is the measurement of living and previously living
organisms within a trophic level
Energy flow through levels
Biogeochemical Cycles
Chemicals that make up living organisms cycle
through ecosystem
• Carbon (found in all organic molecules)
• Oxygen (found in water and organic molecules)
• Hydrogen (found in water and organic molecules)
• Nitrogen (found in proteins and nucleic acids)
• Phosphorous (found in nucleic acids)
• Sulfur (found in proteins)
play a role in nutrient recycling
between biotic and abiotic components
carbon cycle: the process where carbon atoms move between the atmosphere, oceans, land, and living organisms, primarily through photosynthesis, respiration, decomposition, and geologic processes like the formation of fossil fuels
Hydrologic cycle: continuous movement of water on, above, and below the Earth's surface, involving processes like evaporation, transpiration, condensation, precipitation, and runoff
Biological Magnification
the increasing concentration of toxic substances in organisms at successively higher levels of a food chain
Human Impact
Burning fossil fuel exponentially speeds up the amount of carbon entering the atmosphere
Humans raise large number of animals for consumption
• Those animals contribute to increased methane entering the
atmosphere
These anthropogenic sources of carbon are leading to climate change!
Biodiversity
a measurement of the number/abundance of species present in a given area
Types of Biodiversity
Species biodiversity
• The number of species, along with their abundance, in a given area
Genetic biodiversity
• Genetic variation present in the individuals in a population or species
Ecosystem biodiversity
• Number of different ecosystems in a given area
Patterns of Biodiversity
Biodiversity is not evenly distributed on Earth
Biomes near the equator have greater biodiversity than biomes in the far north or far south
Five Mass Extinctions
Ordovician-Silurian:
Life was almost exclusively in oceans
• Caused by glaciation followed by extreme warming
Devonian:
Affected marine species, not terrestrial
Cause not understood
Permian:
Largest extinction event on Earth
Dramatically altered the course of evolution on Earth
Triassic-Jurassic:
85% of species extinct
Cause unknown but occurred right before Pangaea broke apart
Cretaceous:
All dinosaurs extinct except theropod clade
Caused by asteroid impact off Yucatan Peninsula and volcanic activity
Mammals became dominant species following this extinction
Holocene
Anthropogenic Extinctions
Coincides with expansion of European colonies around the
world
ex: Dodo bird (1662), Stellar’s sea cow (1778), Passenger pigeon (1914), Carolina parakeet (1918), Japanese sea lion (1950), Caribbean monk seal (1952)
Extinction rate is increasing exponentially
Measuring Biodiversity
We need one global database for all described and named species
• All known and new species need to be entered into database
DNA Barcoding
• Sequences area of rapidly evolving genome
• Eukaryotes, use mitochondrial DNA
• Plants, use chloroplast DNA
• Fungus, use internal transcribed spacers in RNA
Conservation: National and International Agencies
International Union for Conservation of Nature (IUCN):
Classifies species as critically endangered, endangered or
vulnerable
Convention on International Trade in Endangered Species of Wild Fauna and Flora (CITES):
Prevents capture and transporting of 33,000 species
US Endangered Species Act (ESA):
Protects species that are listed as critically endangered or
endangered
North American Migratory Bird Treaty Act (MBTA):
protects 800 species of birds
• Illegal to kill, disturb, and transport birds or parts of birds
Conservation: Preserves
Create wildlife and ecosystem preserves
• Area of land protected from development
Size and quality are important
Connectivity to other preserves is paramount for gene flow
Large, high quality, interconnected preserves work best
• Expensive to purchase
• Developers want quality land
• Politics plays a role
Conservation: Habitat Restoration
Restoring dead or damaged ecosystems improves the
ecosystem for all organisms within it
Need to identify keystone species in all ecosystems
• Protect them
Conservation: Captive breeding
Zoos and aquariums help conservation efforts with captive breeding programs
• Animals (or their semen) are transferred between zoos to increase genetic diversity
• Genetic specialists manage global breeding programs