Mathematics: Probability
1/19
Earn XP
Description and Tags
This reviewer only includes the definitions derived from Modules 4-6 that discuss probability. To comprehend further, read modules and watch materials effectively. Thank you!
Name | Mastery | Learn | Test | Matching | Spaced |
|---|
No study sessions yet.
20 Terms
Experiment
Activity with observable results.
Outcome
Result/s of an experiment.
Sample Space
All possible outcomes of an experiment.
Sample Point
One possible outcome of the experiment.
Event
Subset of a sample space.
Probability
Estimation of how likely an event is to happen.
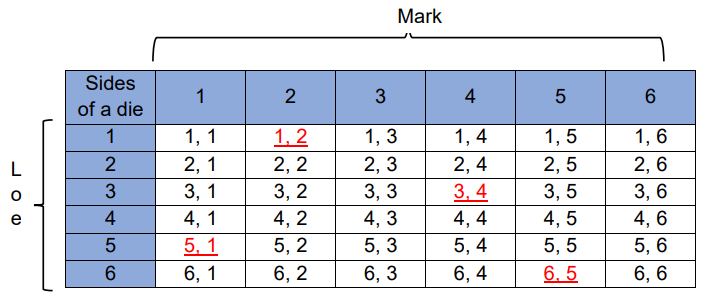
Table/Tabular Method
Corresponding rows and columns represent possible outcomes.
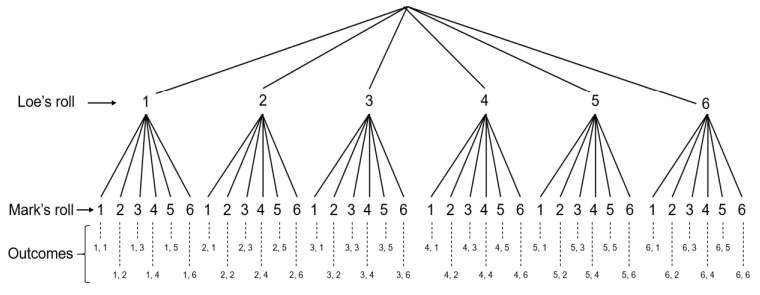
Tree Diagram
Consists of line segments that connects all possible combinations of outcomes of the experiment.
Systematic Listing
Simply listing down the possible outcomes.
Fundamental Counting Principle (FCP)
Finding the number of outcomes by multiplying the outcomes for each event.
Table/Tabular Method

Tree Diagram

Systematic Listing

Fundamental Counting Principle (FCP)

Likely
Also referred to as 0.75 or 75%. This means that there is a big possibility for the event to happen.
Unlikely
Also referred to as 0.25 or 25%. This means that there is a small possibility for the event to happen.
Impossible
Also referred to as 0 or 0%. This means that there is no possibility for the event to happen.
Certain
Also referred to as 1 or 100%. This means that there is a 100% chance for the event to happen.
The probability of an event can be expressed using:
Fractions, Decimals, and Percent from 0 to 1 inclusively.
Experimental Probability of an Event:
No. of Times an Event Occurs / Total No. of Trials