DP1 Microeconomics 23/24
1/163
There's no tags or description
Looks like no tags are added yet.
Name | Mastery | Learn | Test | Matching | Spaced | Call with Kai |
|---|
No analytics yet
Send a link to your students to track their progress
164 Terms
What is economics?
Economics is the study of how resources are allocated to satisfy the unlimited needs and wants of individuals, governments and firms in an economy.
What is microeconomics?
The allocation of scarce resources in an efficient way regarding households and firms. Profit maximization for individual firms and welfare maximization for consumers. Assumes rational economic behaviour and the decision of individual consumers and producers.
The problem of choice
In every country, resources are limited in supplies so decisions have to be made in how to allocate scarce resources.
Human reasons for wants
human nature
marketers advertise thus it is enticing
peer/societal pressures
physical goods eventually need replacing or upgrading
Factors of production
Land: natural resources used in the production process (crude oil, coal, water, wood, metal ores, agricultural products) and classified as renewable or non-renewable. (not the physical land used)
Labor: human resources, physical human effort. (labor does not refer to the number of workers but to thee physical and mental human resources used)
Capital: non-natural manufactured products, machinery, tools, and equipment. Used to facilitate production. (not the amount of money used in the production process but the actual human-made resources).
Entrepreneurship: skills, creativity, and risk-taking ability of a business person. Combine and manage the other three factors of production.
Income (returns on factors of production)
Labour - wages and salaries (not income!!)
Land - rent
Capital - interest
Enterprise - profit
Scarcity
The limited availability of economic resources relative to society’s unlimited needs and wants of goods and services.
Needs
Essential goods and services required for human survival.
Wants
Goods and services deemed to not be necessary for survival but are human desires. Wants are unlimited.
Goods
Tangible items that can be produced, bought and sold
Services
Intangible items provided by individuals and firms, and paid for by customers.
Renewable Goods
Resources that can be used repeatedly and replenished naturally. Such resources can become irreplaceable if their usage rate exceeds that of their natural replenishment rate.
Opportunity Cost
Cost of an economic decision measured in terms of the best alternative choice forgone, that is, it is the economic cost of choice.
Free Goods
Goods with a natural abundance of supply and do not require any deliberate effort to obtain them such as air or sea water that are not considered scarce and thus do not have an opportunity cost.
Private Sector
The sector of the economy where private firms and individuals produce goods and services.
Public sector
The sector of the economy where the government produces or supplies certain goods and services.
Economic System
Describes the way in which an economy is organized and run, including alternative views on how resources are best allocated.
Free Market Economy
An economy where the means of production are privately owned and where market forces (demand and supply) determine the answers to the fundamental questions (what/how much, how and for whom) that all economies face.
Planned Economy
An economy where the means of production (land and capital) are owned by the state. The state determines what/how much to produce, how to produce, and for whom to produce. (Often associated with communist or socialist economies such as North Korea, Venezuela, Cuba and the Republic of the Congo)
The worlds top 10 “freest” economies
Singapore
Hong Kong
New Zealand
Australia
Switzerland
Ireland
United Kingdom
Denmark
Canada
Estonia
Mixed Economy
An economy that has elements of a planned economy and elements of a free market economy. In reality, all economies are mixed. What is different is the degree of the mix from country to country. Example of mixed economies are Belgium, France, Italy, Spain, Mexico and the Philippines.
The Production Possibility Curve (PPC or PPF)
A curve showing the maximum combinations of goods or services that can be produced by an economy in a given time period, if all the resources in the economy are being used fully and efficiently and the state of technology is fixed.
Points inside or outs the PPC curve
Any point inside the curve suggests that not all resources are being utilized efficiently to achieve the potential output of the economy. Any point beyond the PPC is not attainable with the current level of resources and state of technology.
Conditions to be at a point on the production possibility curve
Full employment - all factors of production are fully utilized. No unemployed resources.
Efficiency - all resources (such as land, labour and capital) are put to their best use and there is no wastage in the production process. Hence, the most output is generated from the available resources of the economy.
Features when drawing a PPC Curve
The PPC curve slopes downwards from left to right. This shows that the economy must forgo a certain quantity of one product to gain more quantity of the other product.
The PPC is concave to the origin. Increasing opportunity cost.
Assumptions of a PPC model
Fixed production possibilities. Assumes the economy only produces various combinations fo two products, such as producer goods or consumer goods. Hence, the PPC is drawn two-dimensional. In reality this can not represent the whole economy, but the assumption simplifies the workings of the market and it is impractical to take into account all production possibilities of all goods and services in an economy.
Scarcity. There is a limited and fixed amount of resources in the economy (land, labour, capital and entrepreneurship) at any moment in time. Trade-offs between the two products on a PPC diagram illustrate the concept of scarcity.
A constant state of technology. Production techniques and technologies are assumed to be held constant because the economy has only a certain level of technology at any point in time. In reality, technology will improve over time.
Efficiency. The model assumes that all resources are fully utilized efficiently. No waste in the production process. This means that the maximum physical output of products is obtained from fixed and limited resources.
Linear PPC
The marginal rate of transformation (gradient of a PPC) between the products is the same, so there is a constant opportunity cost. For example, the trade-off between work hours and leisure hours is 1:1. The opportunity cost of working more hours is fewer leisure hours.
Actual growth and growth in production possibilities
The PPC can shift outwards as a result of an increase in the productive capacity of the economy. This is the result of an increase in the quantity and/or quality of the economy’s productive resources such as:
improved education and training of the workforce
innovation of new product sand services
investments in research and development
the discovery of new resources or the reclamation of land
technological progress and improved production techniques
greater population growth and the influx of skilled migrant workers
freer and fairer international trade deals, which can lead to access to larger markets and more efficient production.
Pareto efficiency
Occurs when it is not possible to make one person better off without making someone else worse off.
Decline in production possibilities
PPC can also shift inwards due to detrimental changes in the economy such as major natural disaster or war which destroys a large proportion of the economy’s farmland, factories and infrastructure. A shift inwards represents a decrease in productive capacity of the eocnomy.
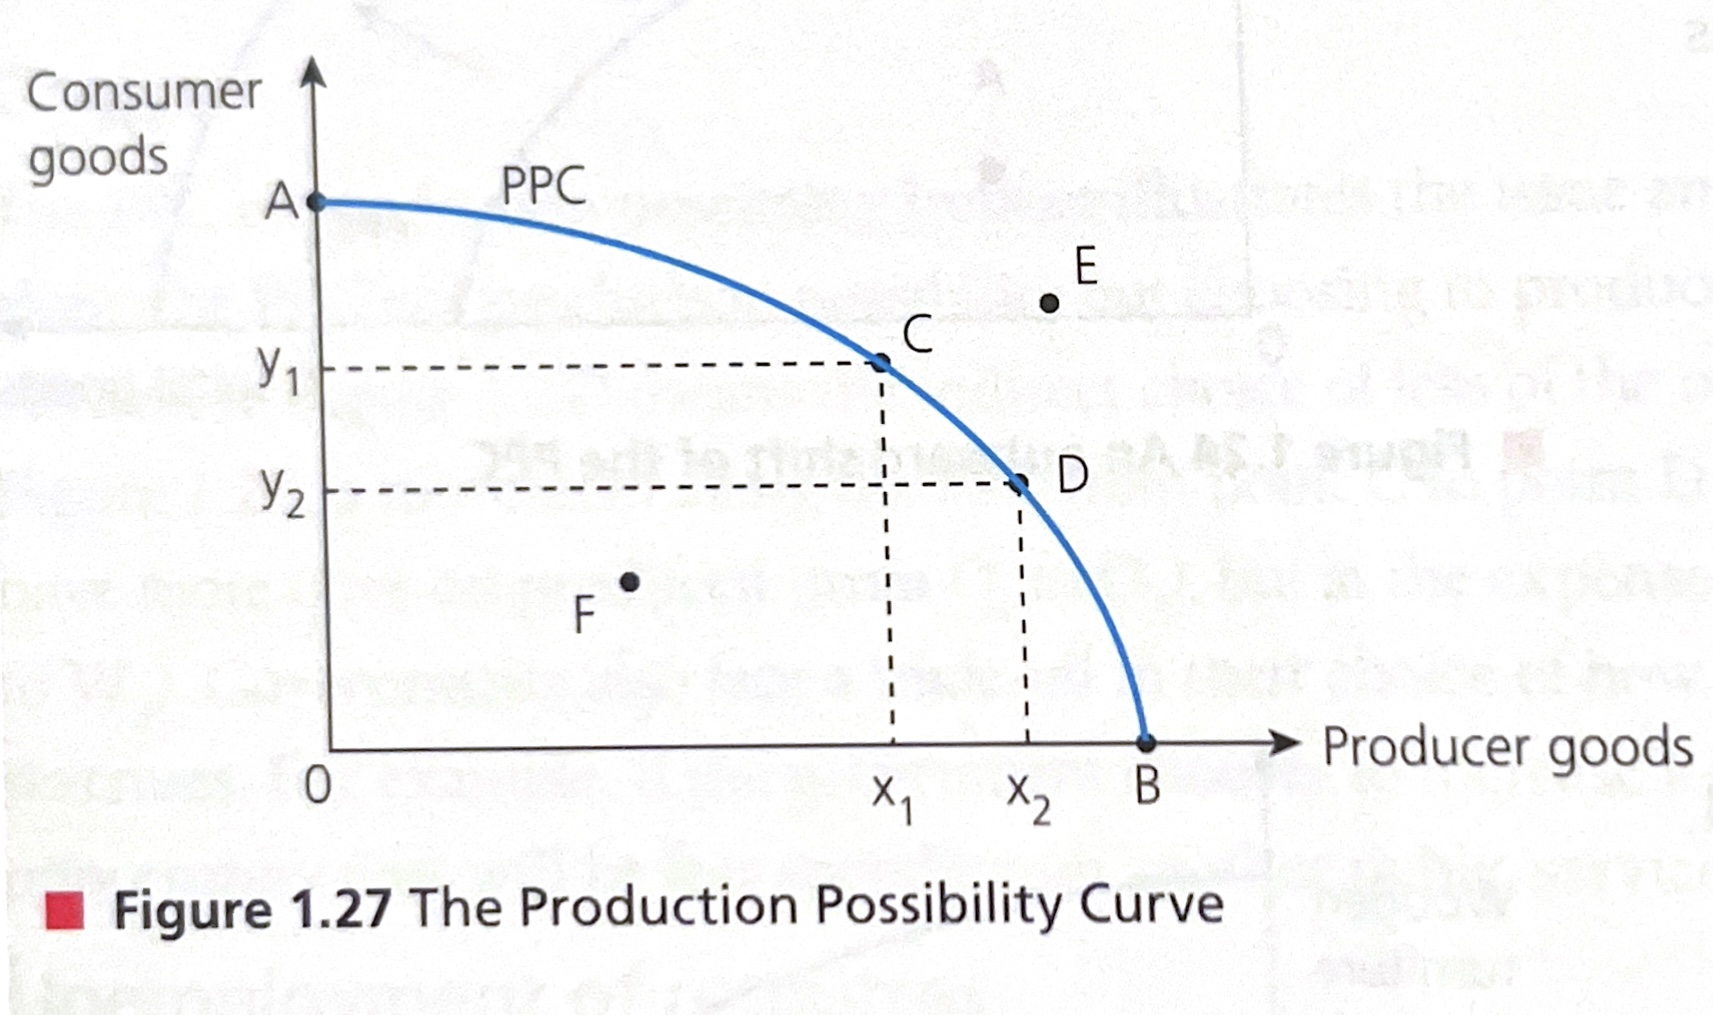
Explain each point on this PPC
A: all resources are dedicated to the production of consumer products.
B: all resources are dedicated to the production of producer products.
C: y1 units of consumer products are produced along with x1 units of producer products
D: y2 units of consumer products are produced along with x2 units of producer products
E: this point is beyond the production possibility curve and lies outside the productive capacity of the economy, so it is currently unattainable.
F: This point is within the productive capacity of the economy, so the production of both consumer products and producer products can increase without any opportunity cost as some factors of production are currently not being used.
Circular flow of income model
Macroeconomics tool used to explain how economic activity and national income are determined.
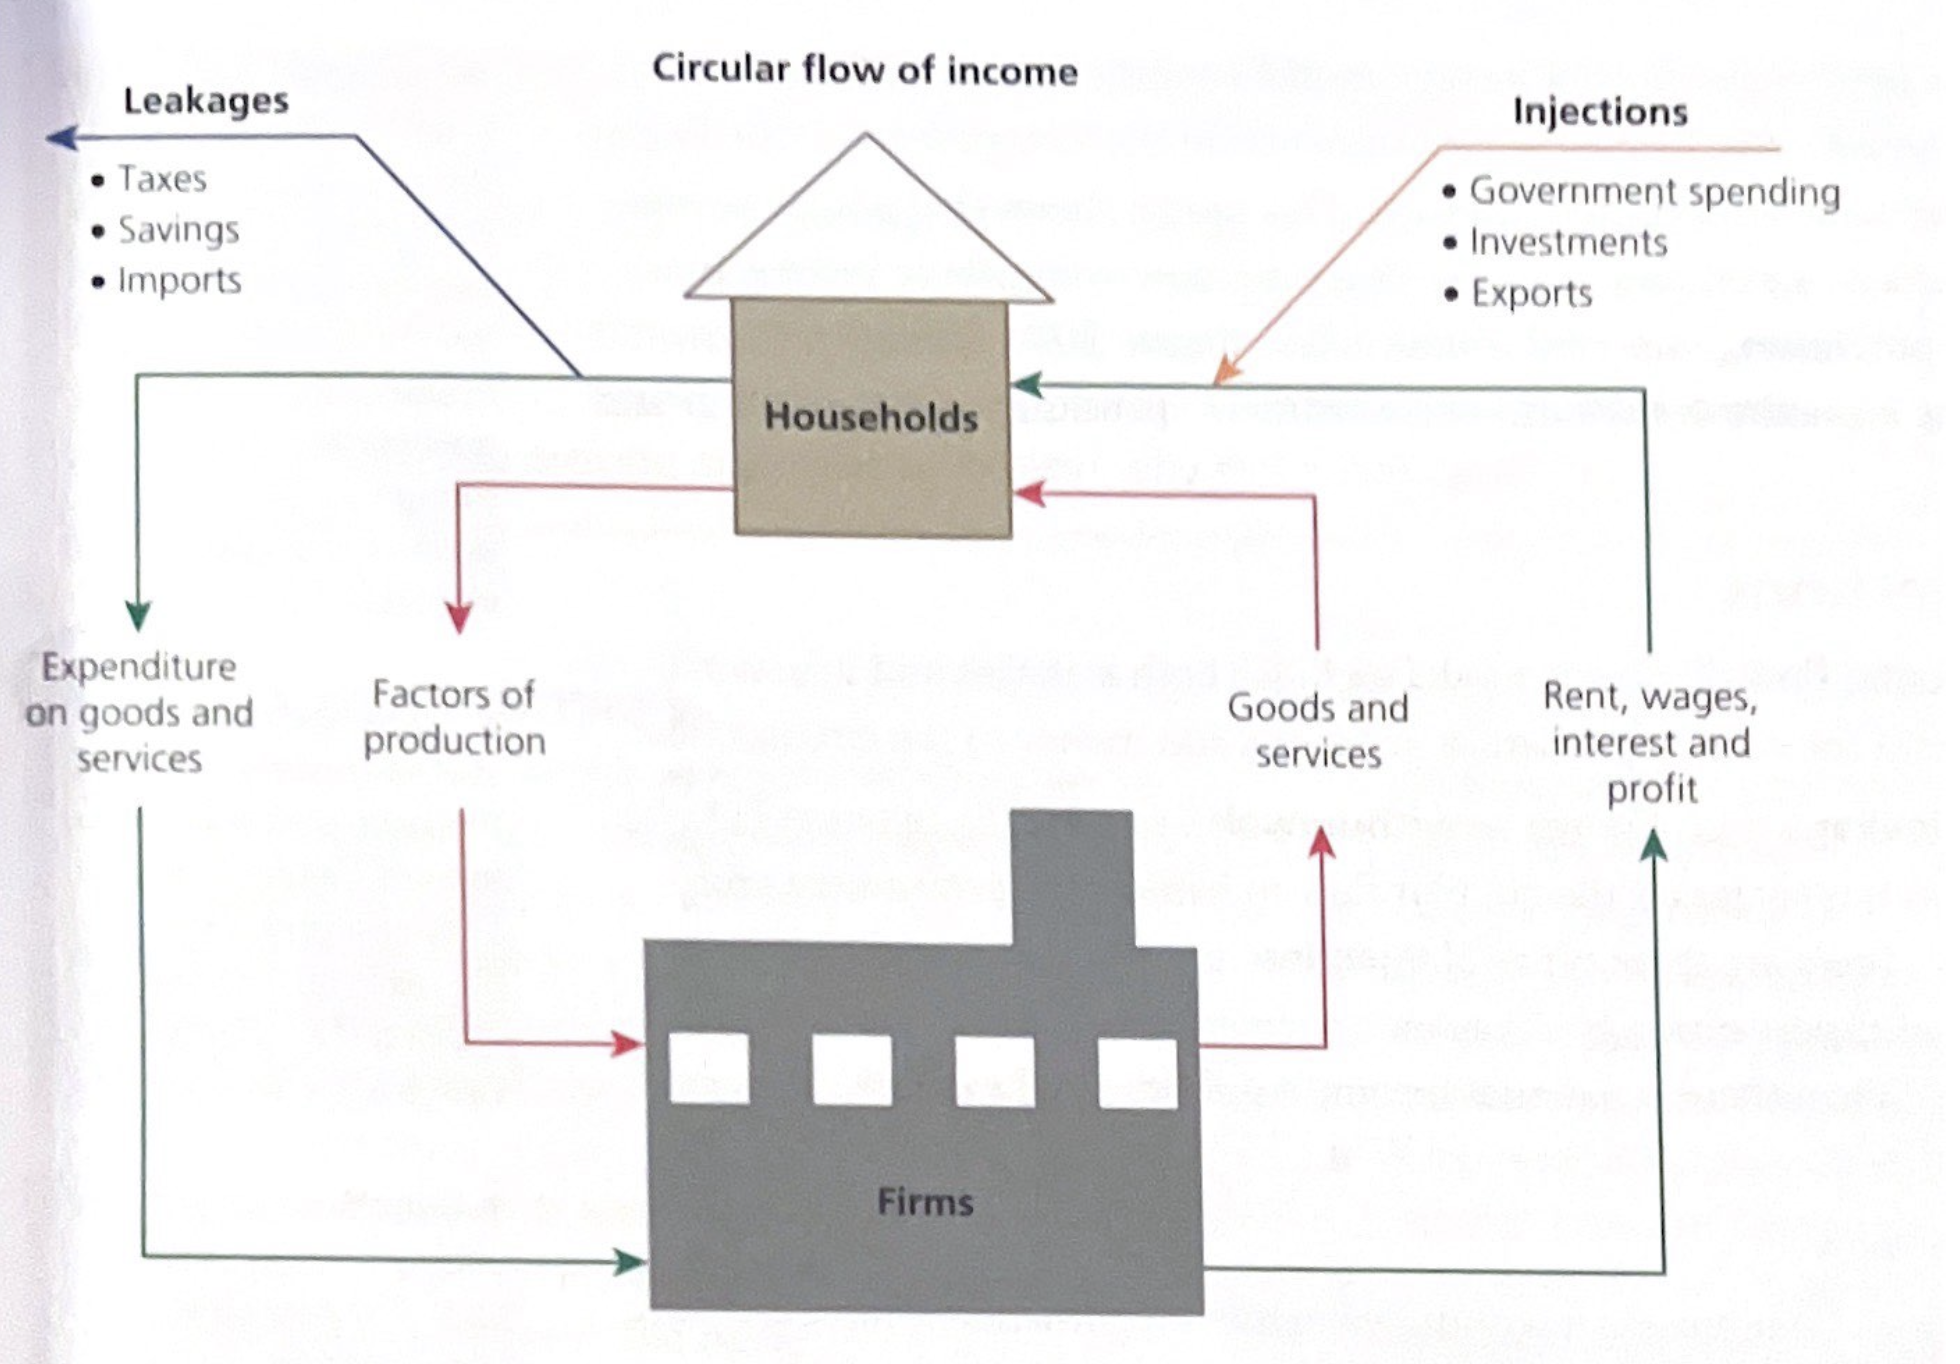
Economic agents in an economy as depicted in a circular flow of income diagram
Households - individual consumers provide their labour services to firms, in return for income. With this, households aim to maximize their utility (degree of satisfaction from their purposes). Rational economic behavior results in individuals pursuing the choice that gives them the most utility.
Firms - businesses use FoP’s to generate or supply the output of goods and services. Traditional economic theory assumes that firms aim to maximize profit. In reality, not all firms operating in the private sector of the economy aim primarily for profit (such as charities and non-governmental organizations), but even these firms need to ensure they earn a surplus to keep their operations economically sustainable in the long run.
Government - It is assumed that the government exists to maximize social welfare for the general public, irrespective of political beliefs. The government taxes households and firms to raise tax revenues to fund the government spending on goods and services for the public, irrespective of whether they are taxpayers or not.
Economic Agents
Economic decision makers comprising households (private individuals in society), firms that operate in the private sector of an economy, and the government (the public sector of the economy)
Closed Economy
Part of the circular flow of income model comprises domestic economic decision-makers, that is, households, firms, and the government. Households supply FoPs to domestic firms. In return, firms provide factor incomes to households. Within the income, households spend their money on goods and services produced by firms, thus creating expenditure revenue for firms. Hence, the income flow is numerically the same value as the expenditure flow and the output flow.
Open economy
A part of the circular flow of income model comprising domestic and foreign economic decision makers, that is, households, firms, the government and the foreign sector (which accounts for exports and imports).
Leakages
Income not spent on domestic goods and services. It includes savings, taxes and import expenditure.
Injections
Within the circular flow model, these refer to spending on domestic output that does not originate from households and thus includes investment expenditure (I), government expenditures (G), and exports (X).
Relationships between leakages and injections
National Income Equilibrium: Leakages (W) = injections (J) thus S+T+M=G+I+X.
If W is greater than J then economic activity declines
If W is less than J then economic activity increases
Ceteris paribus
All other factors remaining constant or all else unchanged.
Equity
Economic fairness in the distribution of resources.
Equality
Everyone being equal and should have equal recognition. Social fairness and collectivism.
Finite resources
Factors of production are limited in supply.
Classical economics
Self-regulating markets to allocate resources efficiently.
Marginal utility
The benefit or satisfaction gained from consuming an additional unit of a good or service.
Law of diminishing marginal utility
As individuals consume more of a product, the satisfaction gained from each additional unit of consumption declines. Hence, consumers would only purchase more units at lower prices.
Say’s Law
The ability to purchase a product depends on the ability to produce or supply, thereby generating income. Supply can create its own demand.
Marxism
Macroeconomic policy focusing on meeting the needs and values of the masses, rather than for the privilege of a minority of capatilist.
Keynesian economics
Interventionist approach to macroeconomic policy by advocating for increased government expenditure and lower taxes to stimulate demand in the economy in the immediate and short run. Believe that fiscal policy is a more powerful and effective macroeconomic stabilization policy than monetary policy.
Monetarists
Monetarists believe that monetary policy is the most powerful and effective macroeconomic stabilization policy to influence the overall level of economic activity.
Sustainability
Refers to an economy achieving the economic goals that allow an increase in living standards without jeopardising the needs and wants of future generations.
Circular economy
An economic system in which raw materials, components and other resources are used sustainably to generate output.
Demand
The relationship between possible prices of a good or service and the quantities that individuals are willing and able to buy at a given price, per period of time, ceteris paribus
Effective demand
Only when a consumer’s desire to by a product is also backed up by the capability to pay.
Price
amount of money a consumer pays in order to purchase a good or service.
Law of demand
A law stating that as the price of a good falls, the quantity demanded of the good will increase over a certain period of time and vice versa, ceteris paribus.
Demand Curve
Illustrates an inverse correlation between the price and quantity demanded of a product over a certain period of time. Shows how much of a product is demanded at different price levels. Price is measured along the y axis and quantity demanded is measured along the x axis. Include correct units of measurements. Demand curve is a linear downward sloping line.
Market
any place where transactions take place beteen buyers and sellers.
Market demand curve
Sum of all individual demand for a product at each price level. Add up all the individual demand at each price level.
Non-price determinants for demand: Income (I)
Products that have a higher demand when real income increases are known as normal goods. (rightwards shift). The exception is inferior goods.
RIPEN
Inferior goods
Lower quality goods for which higher quality substitutes exist; if incomes rise, demand for the lower quality goods decreases. Products with a negative income elasticity of demand.
Complementary goods
Goods that are jointly consumed, for example, coffee and sugar.
Substitutes
Goods that can be used in place of each other, as they satisfy a similar need.
A contraction in demand
Occurs when there is a fall in quantity demanded following an increase in price. Movement along the curve, left up.
An expansion (extension) in demand
Occurs when there is an increase in the quantity demanded for a product following a fall in price.
Movement along demand cruve
Caused by price changes. (changes in quantity demanded)
Shift of demand curve
Non-price determinants of demand (changes in demand).
Increase in demand
Rightwards shift of the entire demand curve for a product, caused by favourable changes in non-price factors that affect demand.
Decrease in demand
Leftwards shift of the entire demand curve for a product, caused by unfavourable changes in non-price factors that affect demand.
The law of supply
A law stating that as the price of a good rises, the quantity supplied will rise over a certain period of time, ceteris paribus. (direct or positive relationship)
Supply
Quantities of a good that firms are willing and able to supply at different possible prices, over a given time period, ceteris paribus.
Reasons for the relationship between price and quantity supplied
Existing firms in the market can earn higher profit margins if they supply more when the price increases. Hence, higher prices create an incentive for existing firms to supply more.
New firms enter the market, attracted by the higher prices and profit margins, which enable them to cover their costs of production and the potential to earn profits.
Market Supply
The sum of all individuals supply of producers at each price level for a given product. Market supply curve is flatter than the supply curve for individual firms because a change in price causes a more than proportionate change in the market. Individual firms have less flexibility to respond to price changes in the short run.
Non-price determinants of supply: Costs of factors of production
If the costs of the FOPs increase (due to rise in wages and/or an increase in rent cost) the supply curve will shift left because the higher costs mean that producers cannot produce the same quantity and fewer firms are willing and able to supply output. Hence, less will be supplied at each price level, as costs of production rise.
CISTERN
Competitive supply
When goods that a firm is producing use the same resources in their production process. The goods thus compete with each other for the use of the same resources.
Non-price determinants of supply: Prices of related goods (competitive supply)
Competitive supply, the output of one product (such as apples) prevents or limits the output of alternative products (oranges). This is due to competing resources as producers have limited resources such as land and labour so they cannot supply more of one product without producing less of the other. The relative price and profitability of the two products determines the level of supply for each. For example, if the price of apples increase by 10 per cent while oranges stay the same, farmers may allocate more land and other resources to harvesting apples. Hence, the increase in price of apples reduces the supply of oranges.
Non-price determinants for demand: Tastes and preferences (P)
Can be affected by advertisements and trends. Some companies have strong brand loyalty so the demand for their products is high.
RIPEN
Non-price determinants for demand: Future price expectations (E)
If consumers know the price of a product will increase in the future, they will buy more of it now, ceteris paribus.
RIPEN
Non-price determinants for demand: Price of related goods, substitutes, and complements (R)
Complementary goods: since they are jointly demanded when the price of one increases or decreases it will also affect the demand of the other.
Substitutes: They are in competitive demand. Rival products so compete for customers who would ordinarily buy from only one supplier.
RIPEN
Non-price determinants for demand: The number of consumers (N)
If more consumers enter the market or existing consumers buy more the whole demand curve will shift right. Even if there is no change in price. For example, a growing population or an increase in tourism.
Other non-price determinants for demand to keep in mind
weather
demographics (age, gender, ethnicity and religious beliefs of customers)
Non-price determinants of supply: Prices of related goods (joint supply) (R)
An increase in supply of one product automatically increase the supply of at least another (joint) product. The less important product in the joint supply is called the by-product.
CISTERN
Non-price determinants of supply: Indirect taxes (I) and subsidies (S)
Indirect taxes reduce profitability for firms so they tend to reduce market supply.
Subsidies encourage output or supply by reducing the costs of production.
CISTERN
Indirect taxes
Government levies on expenditure, rather than on incomes. Taxes added to the producer’s cost of production.
Subsidies
An amount of money paid by the government to a firm, per unit of output, to encourage production and lower the price to consumers.
Non-price determinants of supply: Future price expectations (E)
If sellers expect the demand for their product to increase sharply in the near future (thus causing higher prices), then the firms may choose to increase production in the current time period.
CISTERN
Non-price determinants of supply: Changes in technology (T)
Advances in technology mean that there can be increase supply of goods and services at every given price level. This is because production is more efficient. Hence, the supply curve wil shift to the right. CISTERN
Non-price determinants of supply: Number of firms (N)
The number of firms usually dictate the size of the market. If the market increase then it is likely that there is an increase in the number of firms in the industry. Hence the supply curve would shift outwards to the right.
CISTERN
Other non-price determinants of supply to keep in mind
time
weather
Market Equilibrium
Occurs at the price where the quantity of a product demanded is equal to the quantity supplied. This is the market clearing price since there is no excess demand or excess supply (shortages or surpluses). On a diagram D=S
Market Disequilibrium
Occurs when the quantity demanded for a product is either higher or lower than the quantity supplied in the market, that is, there is either a shortage (excess demand) or surplus (excess supply).
Excess supply
Occurs when quantity supplied at some price is greater than quantity demanded.
Excess demand
Occurs when quantity demanded at some price is greater than quantity supplied.
The price mechanism
The system where the forces of demand and supply determine the prices of products. Also known as the market mechanism.
Signalling function
An aspect of the price mechanism in allocating resources by providing information to producers and consumers where resources are required (in markets where prices increase) and where they are not (in markets where prices fall). Associated with a shift in the demand or supply curve.
Incentive function
An aspect of the price mechanism in allocating resources as price changes provide an incentive (motivation) for producers and consumers to change their behaviour in order to maximize their benefits). Associated with a movement of the demand or supply curve.
Rationing function
Deters some consumers from buying a product or resources owing to higher prices, thereby rationing (preserving) it. It serves to ration scarce resources when the demand for a product exceeds its supply.
Consumer surplus
Refers to the gain or benefit to buyers who can purchase a product at a price lower than that which they are willing and able to buy. Above Ppe.
Producer surplus
Refers to the gain or benefit to firms that receive a price higher than the price they are willing and able to supply at. Below Pe.
Community surplus (social surplus)
The sum of consumer and producer surplus at a given market price and output. Represents the total benefit available to society from an economic transaction or activity.