APES Unit 3
0.0(0)
0.0(0)
Card Sorting
1/38
There's no tags or description
Looks like no tags are added yet.
Study Analytics
Name | Mastery | Learn | Test | Matching | Spaced |
|---|
No study sessions yet.
39 Terms
1
New cards
Specialists vs. Generalists
specialists- use only a few types of food, live in few places
generalists- using most food types, live anywhere
generalists- using most food types, live anywhere
2
New cards
K-selected species characteristics
•Long development, long lived
•Live near carrying capacity
•Slow reproduction
•Few offspring, but high investment
•Live near carrying capacity
•Slow reproduction
•Few offspring, but high investment
3
New cards
r-selected species characteristics
- small size
- fast paced life
- large # offspring
- limited parental care
- fast paced life
- large # offspring
- limited parental care
4
New cards
biotic potential
Maximum rate at which the population of a given species can increase when there are no limits on its rate of growth.
5
New cards
age cohort
an aggregate group of people born during the same time period
6
New cards
survivorship curve
Graph showing the number of survivors in different age groups for a particular species.
7
New cards
type 1 curve of survivorship
Most survive while young, die off quickly when they are older (Ex. Humans)
8
New cards
Type 2 Curve (Survivorship)
Equal survivorships (Ex. rodents)
9
New cards
Type 3 Curve (Survivorship)
Most die when young, then they survive a long time (Ex. fish)
10
New cards
K-selected species
type 1 survivorship curve - long lifespan
11
New cards
r-selected species
type 3 survivorship curve- short lifespan
12
New cards
Carrying capacity refers to
the maximum number of individuals that can be supported by an ecosystem
13
New cards
Overshoot
when a population becomes larger than the environment's carrying capacity
14
New cards
Dieback
a sudden decline in population
15
New cards
limiting resource
A short supply of resources restricting the growth of a population (Ex. food, shelter, water)
16
New cards
mortality
death
17
New cards
Fucundity
fertility
18
New cards
rapid growth
when population grows quickly
19
New cards
negative growth
the actual decline in population due to less than replacement births or extensive diseases
20
New cards
population momentum
continued population growth that does not slow in response to growth reduction measures
21
New cards
3 factors that influence TFR
educational opportunities for females, access to family planning, gov. acts and policies
22
New cards
replacement-level fertility rate
average number of children a couple must have to replace themselves (2.1)
23
New cards
infant mortality rate
The percentage of children who die before their first birthday within a particular area or country.
24
New cards
CBR (Crude Birth Rate)
The total number of live births in a year for every 1,000 people alive in the society.
25
New cards
CDR (Crude Death Rate)
The total number of deaths in a year for every 1000 people alive in the society.
26
New cards
density dependent
disease, competition, predation
27
New cards
density independent
temperature, natural disasters
28
New cards
Rule of 70 formula
number of years to double = 70/growth rate
29
New cards
theory of demographic transition
the theory that as a country moves from a subsistence economy to industrialization and increased affluence it undergoes a predictable shift in population growth
30
New cards
pre-industrial stage
birth and death rates high, population grows slowly, infant mortality high
31
New cards
transitional stage
death rate lower, better health care, population grows fast
32
New cards
post-industrial stage
low birth and death rates
33
New cards
characteristics of a developed country
more money, low birth rates, more sanitation, more health care, lower death rates
34
New cards
characteristics of a developing country
Poor, struggling economies which lack diversity, lack of technology, poor schooling, limited access to healthcare.
35
New cards
exponential growth model
a mathematical description of idealized, unregulated population growth, not limited by resources (j-curve)
36
New cards
logistic growth model
a mathematical description of idealized population growth that is restricted by limiting factors (s-curve)
37
New cards
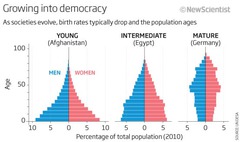
population age structure
how many individuals fit into age categories. Shown by age structure diagrams

38
New cards
growth rate equation
(CBR-CDR)/10
39
New cards
Total Fertility Rate (TFR)
an estimate of the average number of children that each woman in a population will bear throughout her childbearing years