psych 218 midterm 2 (regression)
1/24
There's no tags or description
Looks like no tags are added yet.
Name | Mastery | Learn | Test | Matching | Spaced | Call with Kai |
|---|
No analytics yet
Send a link to your students to track their progress
25 Terms
thing youre trying to predict is called + what can be akin to IV’s
criterion score (the observed score)
predictors
Regression – the boring case
When the correlation between a predictor and a criterion is (positive or negative) 1.00, you can predict the criterion perfectly
E.g. how much you have to pay in tax, based on the cost of the purchases = cost of purchase x tax rate = how much tax to pay
Regression
Predicting the criterion (Y) from one or more predictors (X1, X2, X3)
Simple regression → when there is only one predictor
Multiple regression → multiple predictors
Line of best fit + how to find it
line that minimizes the total error (deviation of each of the points from the line)
finding —> total the discrepancies and see between which graph has a smaller value (this is kinda by eyeballing)
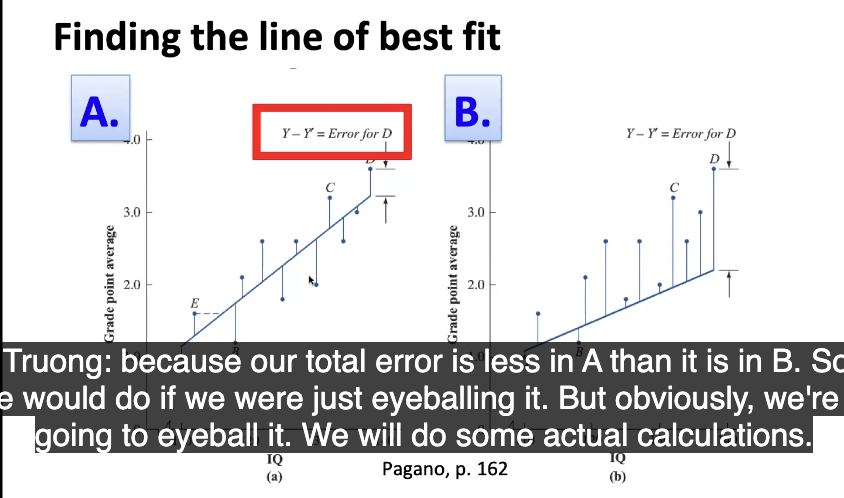
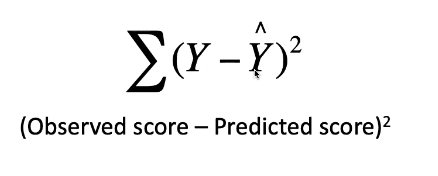
Least squares regression line
A prediction line that minimizes the sum of the squared errors
Y = observed score, Y hat = predicted score
Sigma = add all the errors together
For any linear relationship, there is only one line that will minimize ^
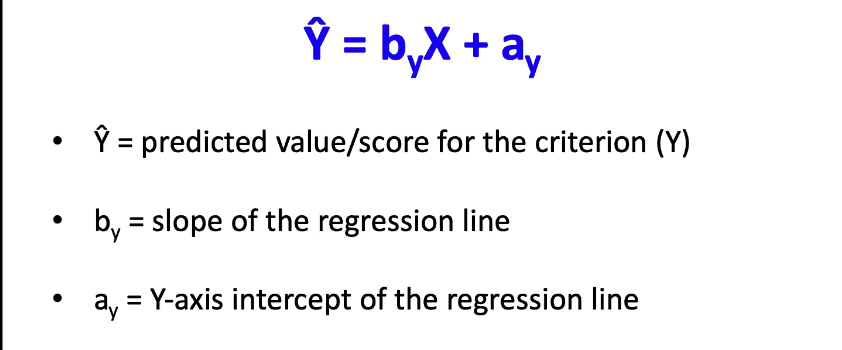
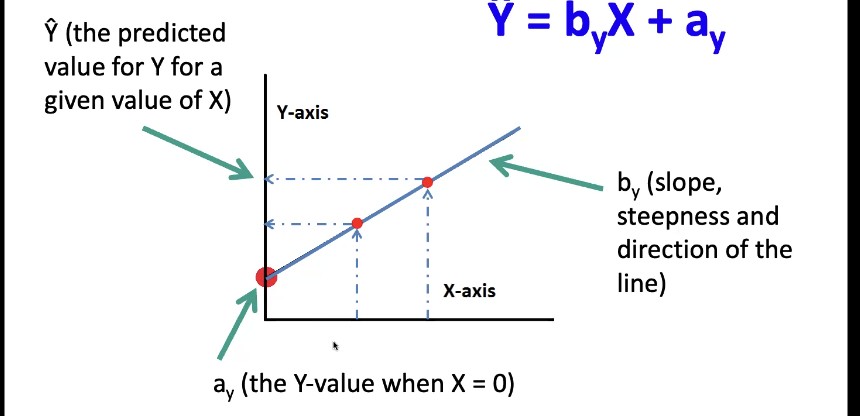
regression line equation
example:
Calculating (By) – the regression coefficient (if you already have r and the standard deviations)
If you already have the correlation coefficient ® and the standard deviations:
Sx = standard deviation for X
Sy = standard deviation for Y
R = correlation between X and Y
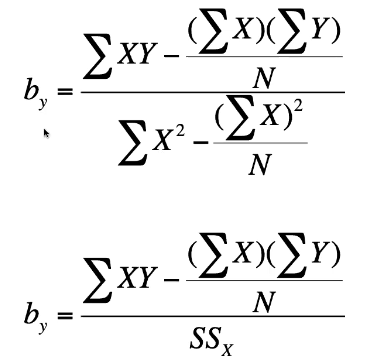
Calculating (By) – the regression coefficient (if you dont have r)
What does slope tell you
For every 1 unit increase in X, the predicted value of Y changes by b amount
E.g. b = +0.50
If X = 1, revise your prediction for Y up by 0.50
If X = 2, revise your prediction for Y up by 1.00
E.g. b = -7.00
If X = 1, revise your prediction of Y down by 7.00
If X = -1, revise your prediction of Y up by 7.00
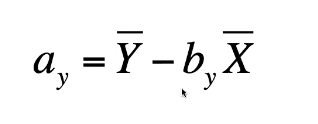
Calculating (ay) intercept
Y bar = mean of Y
B = slope
X bar = mean for X
If the correlation between the criterion (Y) and the predictor (X) is zero, the regression line will be:
a horizontal line
Limits of regression
Only appropriate to use regressions for:
For linear relationships
When the sample you used to calculate the regression line is representative of the sample you want to make predictions about
Within the range of the original variables
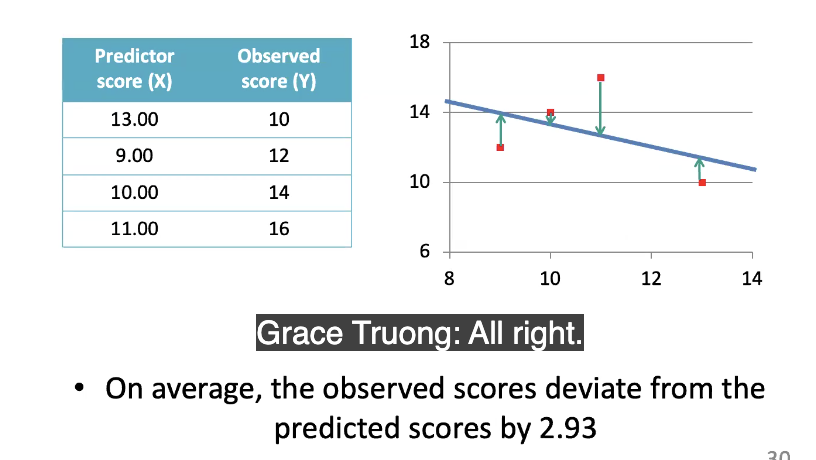
standard error of estimate (SEE)
tells us how much error on average can we expect when we use the regression line → basically, how much are we off by?
smaller SE means better prediction (0 = perfect regression)
SEE equation /formula
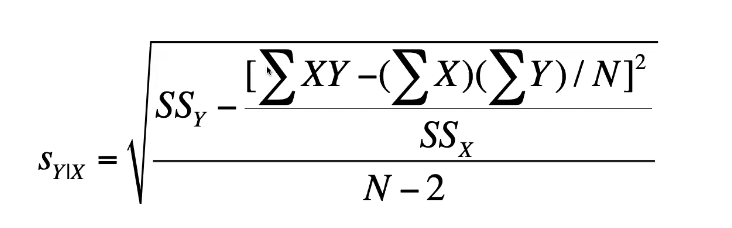
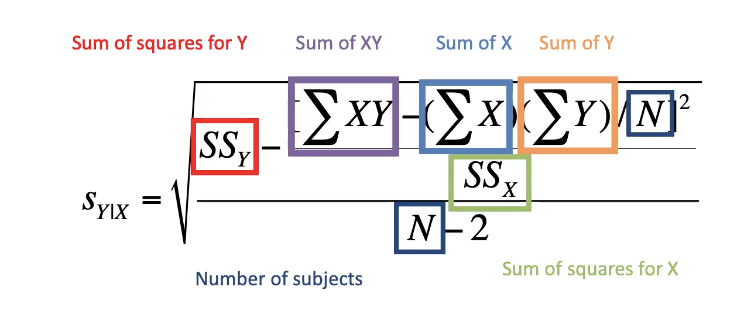
(sum of squares = sum of deviations) = (x - mean of x)^2 then add all the values for each variable
How to phrase SEE
on average, the observed scores deviate from the predicted scores by x amount
e.g.
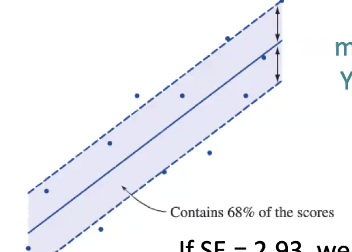
SE in relation to normal distribution?
If SE= 2.93 (example number btw), we can expect about 68% of actual/observed Y scores to fall within 2.93 points of the prediction
The standard error of estimate is computed over the whole range of data
Thus, standard errors are only meaningful if the variability in Y is constant over values of X
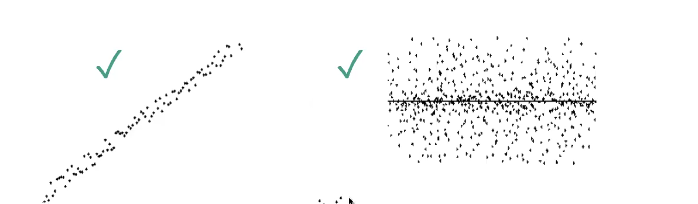
Homoscedasticity
If the spread is consistent across all the values of X. then you would say that you have Homoscedasticity and you can interpret SE as normal
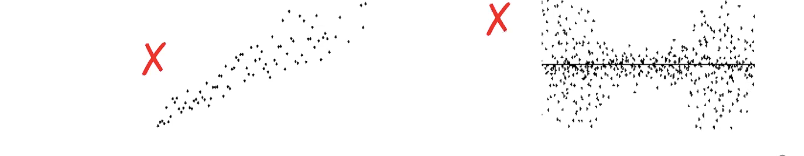
This one ^ we do not have homoscedascitiy, and cannot interpret standard error.
Multiple regression
In ^, we are using 2 or more predictors to predict a criterion (Y)
Goal: increase accuracy in predicting criterion

R
the maximum correlation between Y and the combination of predictors (X1 and X2 and so on)
If you have 2 regressions and theyre both good at predicting scores — what do you choose
go with the simpler one – helps with parsimony
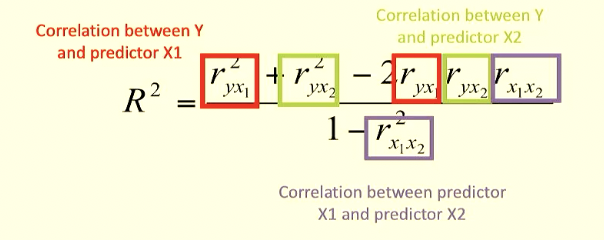
R² — Multiple coefficient of determination
R^2 tells us the proportion of the variance in Y that is accounted for by the combination of predictors (X1 and X2) and so on)
Lowest number R^2 can be: 0 (if you can explain none of the variability)
Highest number R^2 can be: 1 or 1% (if you can explain all of the variability)
if R² goes up, you can tell a regression has improved. also look at standard error, as it goes down ur regression improves
formula:
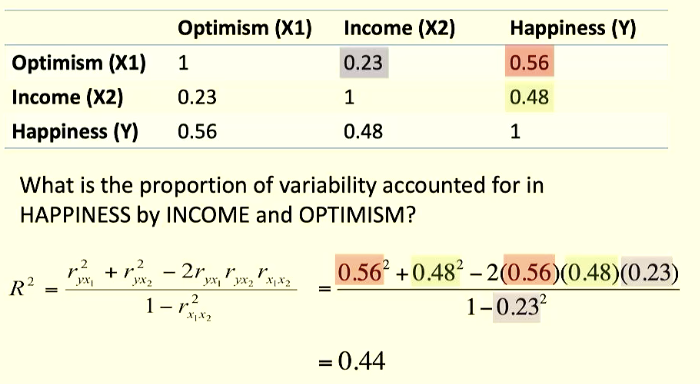
44% of variability in happiness can be accounted for by our predictors income and optimism
can you add up r² to get total proportion of variability accounted for?
You cant add up r^2 to get total proportion of variability accounted for because youd be double counting the overlap. Need to take into account that predictors may be correlated to each other.
If the predictors are correlated, they may ‘overlap’ in accounting for the variance in the Y
You want to find out the unique (orthogonal) contributions of each predictor; you want one predictor to tell you stuff and then the other one to tell you unique non-overlapping stuff
What makes a good set of predictors?
Low correlations with each other
High correlations with criterion
When predictors (X1, X2) are highly correlated with each other, adding X2 to your regression model won’t substantially increase the total proportion of variability accounted for in Y
Difference between R^2 and r^2
R^2 distinguishes the use of multiple predictor variables from the use of just one predictor variable (r^2)
Beta vs b
b= slope
Beta (B) → the regression coefficient (the ‘b’) when the data set has been standardized (made into z-scores)
B allows for standard comparison between predictors/ also useful when researchers use different scales to measure the same variable
For every 1 standard deviation increase in X, the predicted value for Y changes in B standard deviations