AS Maths Statistics
1/43
There's no tags or description
Looks like no tags are added yet.
Name | Mastery | Learn | Test | Matching | Spaced | Call with Kai |
|---|
No analytics yet
Send a link to your students to track their progress
44 Terms
What is a census?
When you get information from every specimen in the population
What is a population?
What is it also known as?
The population (sometimes referred to as the parent population) is all the individual items which are of interest in the given situation.
What is a sample?
Why are they taken?
+&-?
A sample is a subgroup of the population which is then used to predict and make decisions about the population as a whole.
Because a census is too hard.
Sampling reduces the time, cost and energy taken, they are often easier to manage.
However, you need to be careful as to not introduce bias.
What is Simple random sampling?
Form of equal opportunity sampling
Each individual equally likely to be chosen (random process)
Each possible sample of size n is equally likely
Example method: Number each population member, use random number generator to select n elements
When to use Simple random sampling?
Entire target population is known
Generate a sample to make inferences about the population
Benefits of Simple random sampling?
Random element: Sample likely good representation of parent population
Without bias (especially for large samples)
Limitations of Simple random sampling?
Requires a list of the entire population
Individual items may not be equally weighted in relevance/significance
Random processes can yield non-random appearing results (e.g., all heads, or selecting all shortest students)
Continual testing of same sample for different things increases bias risk
Selecting an item may not always lead to a result for the sample
Not all target population elements are easy or cost-effective to access for data
What is Systematic Sampling?
Selects sample by ordering population using a feature
Selects at set intervals from ranked population
Example: Rank by height, select every 10^{th}, 20^{th}, 30^{th} etc.
Simple and quick method
Benefits of Systematic Sampling?
Avoids conscious or unconscious bias (automated system)
Higher chance of sample reasonably representing parent population
Subgroups often auto-represented (similar to stratified sampling)
Limitations of Systematic Sampling?
Requires a sense of population size to determine suitable interval
Needs existing categorization for entire population to order them
May be detectable by parent population, affecting outcome
Not as random as simple random sampling
Thus, a lot of prior knowledge of the population is needed
What is Stratified Sampling?
Uses a proportional stratified sample to ensure each relevant subgroup is proportionally represented
Relevant subgroups include age, gender, wealth, etc.
Method: Calculate the proportion of each subgroup, multiply by the required sample size, then take a simple random sample from each subgroup
Benefits of Stratified Sampling?
Ensures different subgroups within the target population are given equal weighting
Limitations of Stratified Sampling?
Limitations on whether the entire population is identifiable and listable
Relevant subgroups may not always be apparent or easy to identify
Rounding can lead to subgroups being proportionally over or underrepresented
Sense of what subgroups might be relevant can be subjective
Risk of amplifying opinions of small subgroups if allocation is adjusted (e.g., doubling allocation for a single person)
What is Cluster Sampling?
Sampling technique: population divided into clusters (smaller groups)
Random clusters are taken to form the sample
When to use Cluster Sampling?
Especially useful when the population is already sub-grouped in some way
E.g., medical researcher studying patients by hospital
Benefits of Cluster Sampling?
More time, energy, and cost-efficient
Sometimes the only practical approach
If representation within each cluster is good, random selection of clusters can represent the population
Limitations of Cluster Sampling?
Population needs to be represented within each cluster (each individual once)
Naturally occurring clusters based on additional variables may not truly represent the population
Correlation between cluster formation and variables studied may create significant bias
E.g., geographical clusters (schools, vets) can introduce socio-economic bias
Clusters ideally include the entire population, and each individual must be represented only once
Requires significant background work to meet necessary conditions
What is Opportunity sampling?
Sampling technique based on taking a sample because opportunity presents itself.
Involves selecting individuals who are available and willing to take part at a given time.
Allows the sample to be selected based on what items from the population are available.
Example: asking passers-by to answer a question, or taking data about fish based on those seen during a snorkeling trip.
Benefits of Opportunity sampling?
Doesn't require knowing the size or makeup of the entire parent population to generate a sample.
Often cheaper and more efficient than other methods.
Limitations of Opportunity sampling?
May have hidden bias due to time of day or location of the survey (e.g., specific groups not represented, certain fish harder to spot).
What is Self-selected sampling?
Where the entire target population, or a subsection, is given the option to take part.
The opt-in/out nature means the sample is self-selected.
Example: A survey generally available, with the sample generated from those who opt to complete it.
When to use Self-selected sampling?
Posting a survey online to be completed by anyone.
Benefits of Self-selected sampling?
Doesn't require knowing the size or makeup of the entire parent population to generate a sample.
It is a relatively cheap and easy process to administer.
Limitations of Self-selected sampling?
There may be a significant feature of the subgroups who choose to complete the survey versus those who don't, which can lead to biased results.
What is Quota sampling?
Similar to stratified sampling but specifies the number of data items required in each stratum.
Can be proportional or non-proportional.
Example: Selecting a quota-based sample of children within a school by different year groups.
When to use Quota sampling?
Often used by interviewers, where the interviewer selects actual sample members.
Useful for gathering data to compare different subgroups (strata).
Benefits of Quota sampling?
Helps avoid under/over-representation in the sample.
Relatively simple, quicker, easier, and cheaper than more involved methods.
Limitations of Quota sampling?
The sample taken within a subgroup is not random, leading to potential selection bias.
Creating appropriate subgroups can be difficult, risking overlap or exclusion.
Strata often focus on only one characteristic, potentially missing other relevant biases.
Interviewer selection can introduce bias (e.g., approaching certain people more easily).
Participation can be self-selected, leading to similarities among those who opt in.
Time of day and location can introduce further bias (e.g., specific age groups not present at certain times).
What is Snowball sampling?
Like a snowball rolling along collecting more snow this sampling method gets people who are part of the sample (often convenience/self-selected in some way) to then recruit further members of the sample. Also known as chain or network sampling.
There are different methods of doing this (linear, exponential, discriminative/non-discriminative).
Benefits of Snowball sampling?
It saves a lot of costs that may be involved in a big data collection project.
Can be a good way to tap into hard to access population. This may be because the population is hard to identify and by asking someone within the target population to share with their networks it may open up parts of the population that would otherwise be unknown to you.
Often used for samples in public health issues where there isn't a sampling frame on which to create a simple random sample.
Limitations of Snowball sampling?
Often people within a network will have some similarities (in addition to that which makes them part of the target population). This may lead to bias within the sample.
As with other methods of convenience sampling there is likely to be an opt in/out element.
Measures of central tendency
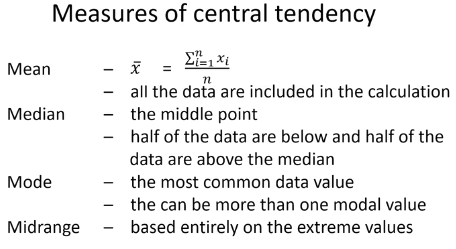
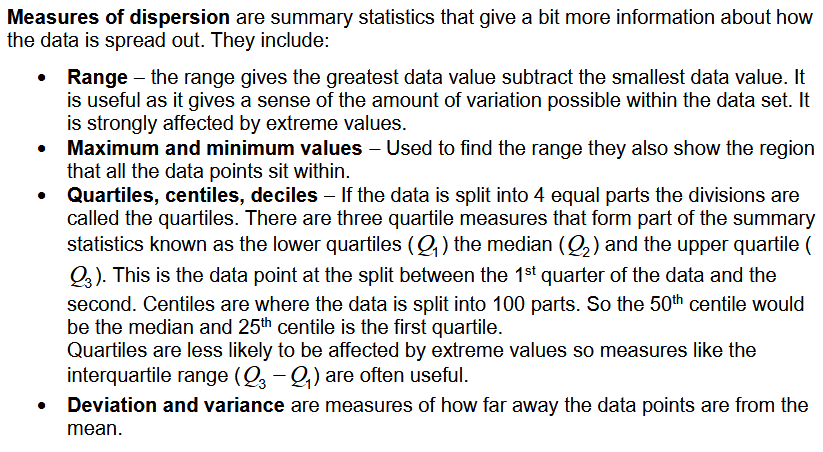
Measures of dispersion
What are the uses and key features of a Pie chart?
Used with categorical, discrete, or grouped continuous data.
Shows proportions within the sample.
Sections should be labelled, and additional information may be needed.
What are the disadvantages and common errors with Pie charts?
Removes actual values, comparing only proportions, making it easy to infer incorrectly about "numbers of".
Altering slice angles for aesthetics can reduce readability and should be avoided.
What are the uses and key features of Bar charts?
Used for discrete or categorical data.
Shows frequencies of different groups.
Bars should not be touching.
Vertical line graphs (minimizing column width) can be a variation, useful for showing more categories.
What are the disadvantages and common errors with Bar charts?
Many similar variations exist (e.g., compound bar charts for comparison).
Charts might use a value on the y-axis rather than frequency (potentially showing negative bars like temperature changes).
What are the uses and key features of a Histogram?
Area represents the number, not the height of the bar.
Bars are joined up along the x-axis.
y-axis labelled "frequency density".
Bars can have different widths.
Shows the shape of the data; more bars closer to a curve allow for seeing skew and approximating specific distributions.
Information from a grouped frequency table is maintained.
What are the disadvantages and common errors with Histograms?
Common error: reading the y-axis as frequency instead of frequency density.
When working with grouped data, only possible to estimate summary statistics (e.g., quartiles, mean).
What are the uses and key features of a Cumulative frequency diagram?
Shows how grouped categorical data builds up.
The line is always increasing and for many distributions has a distinctive S-shape.
Sometimes cumulative frequency lines are plotted with straight line segments between points, other times they are drawn with a smooth curve.
Can be used to estimate individual values within the data, based on an assumption that the growth of the data is reasonably dispersed within each group.
What are the disadvantages and common errors with Cumulative frequency diagrams?
The cumulative nature of this diagram can be hard to interpret.
Often used as a starting point from which to draw box and whisker plots.
What are the uses and key features of Box and whisker plots?
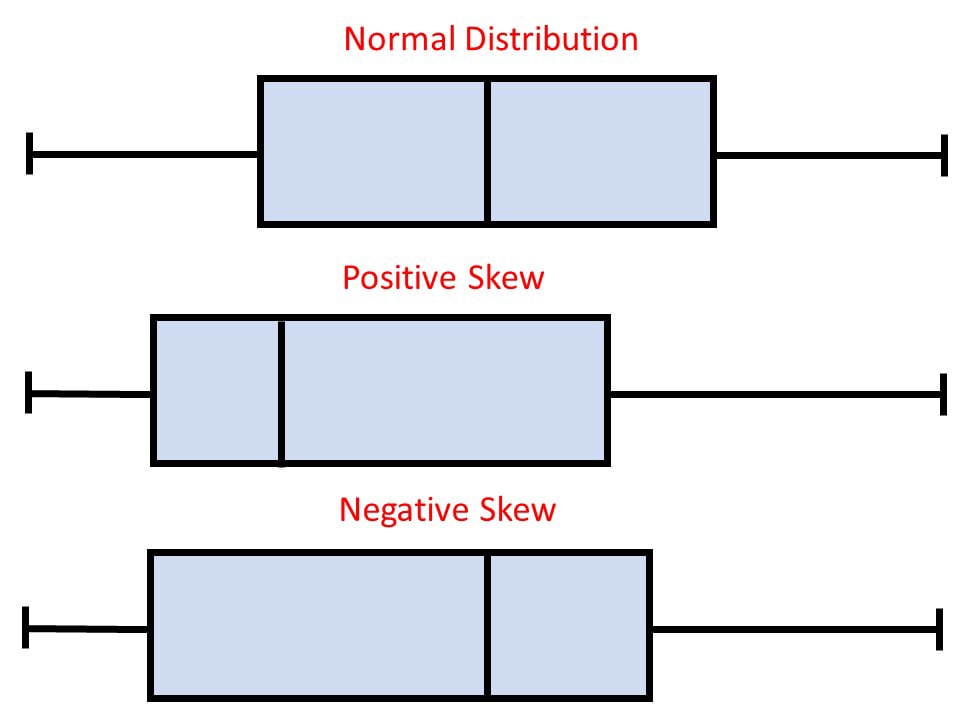
Show the distribution as defined by the quartiles. Includes a scale.
Can be vertical or horizontal.
Outliers can be included as crosses on the diagram (as identified by 1.5 \times IQR below/above the first/third quartile).
Can be a useful way to compare some of the summary statistics between different sets of data.
Remember the central box shows the middle 50\% of the data and the line is the median (2^{nd} quartile).
What are the disadvantages and common errors with Box and whisker plots?
Simplification of data by using summary statistics.
Important to remember to give comparison of measure and relate meaning with context of the comparison too.
The data should support your conclusion, not be it.
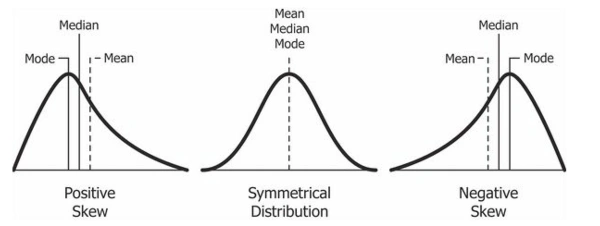
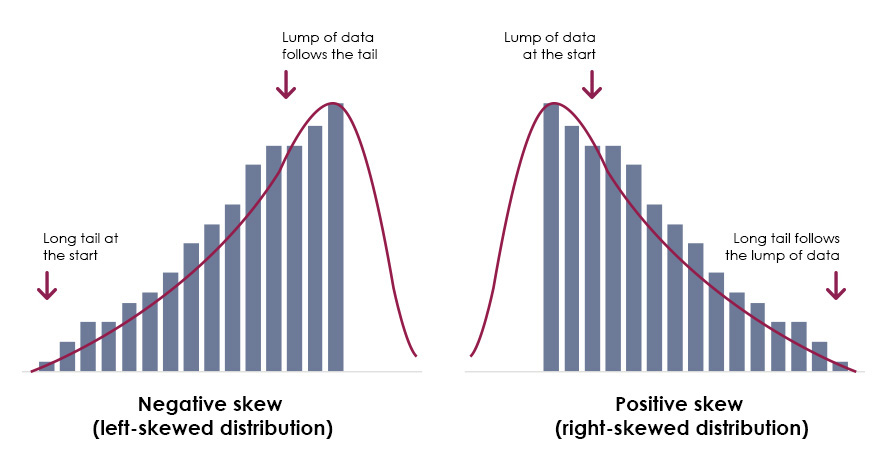
Tell me about skew
