Fichas de aprendizaje Map Projections AP Human Geography | Quizlet
1/6
There's no tags or description
Looks like no tags are added yet.
Name | Mastery | Learn | Test | Matching | Spaced |
|---|
No study sessions yet.
7 Terms
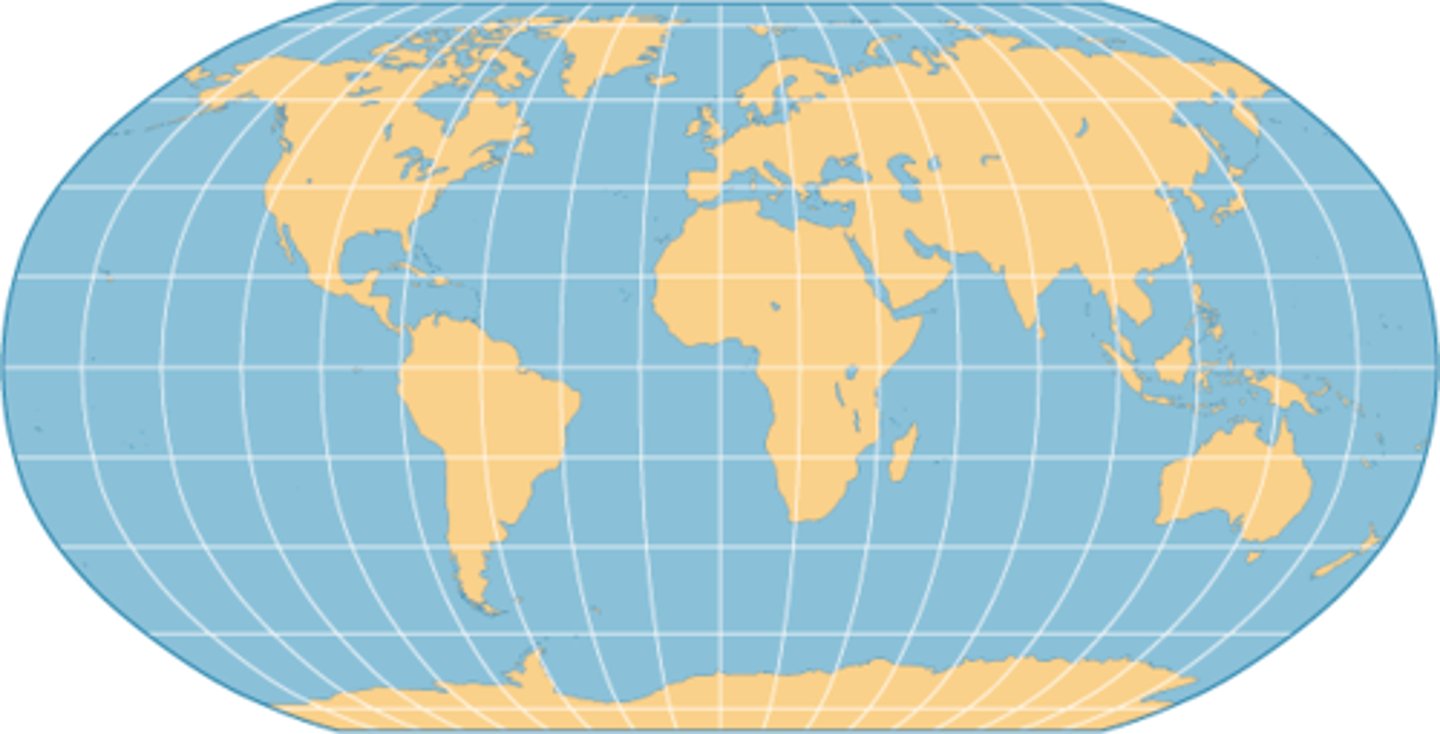
Robinson projection
- pseudocyndrical
- polar regions flattened
- shape and direction distorted
- things are enlarged/distorted closer to the poles but becomes less distorted as you get closer to the equator
- neither equal area nor conformal
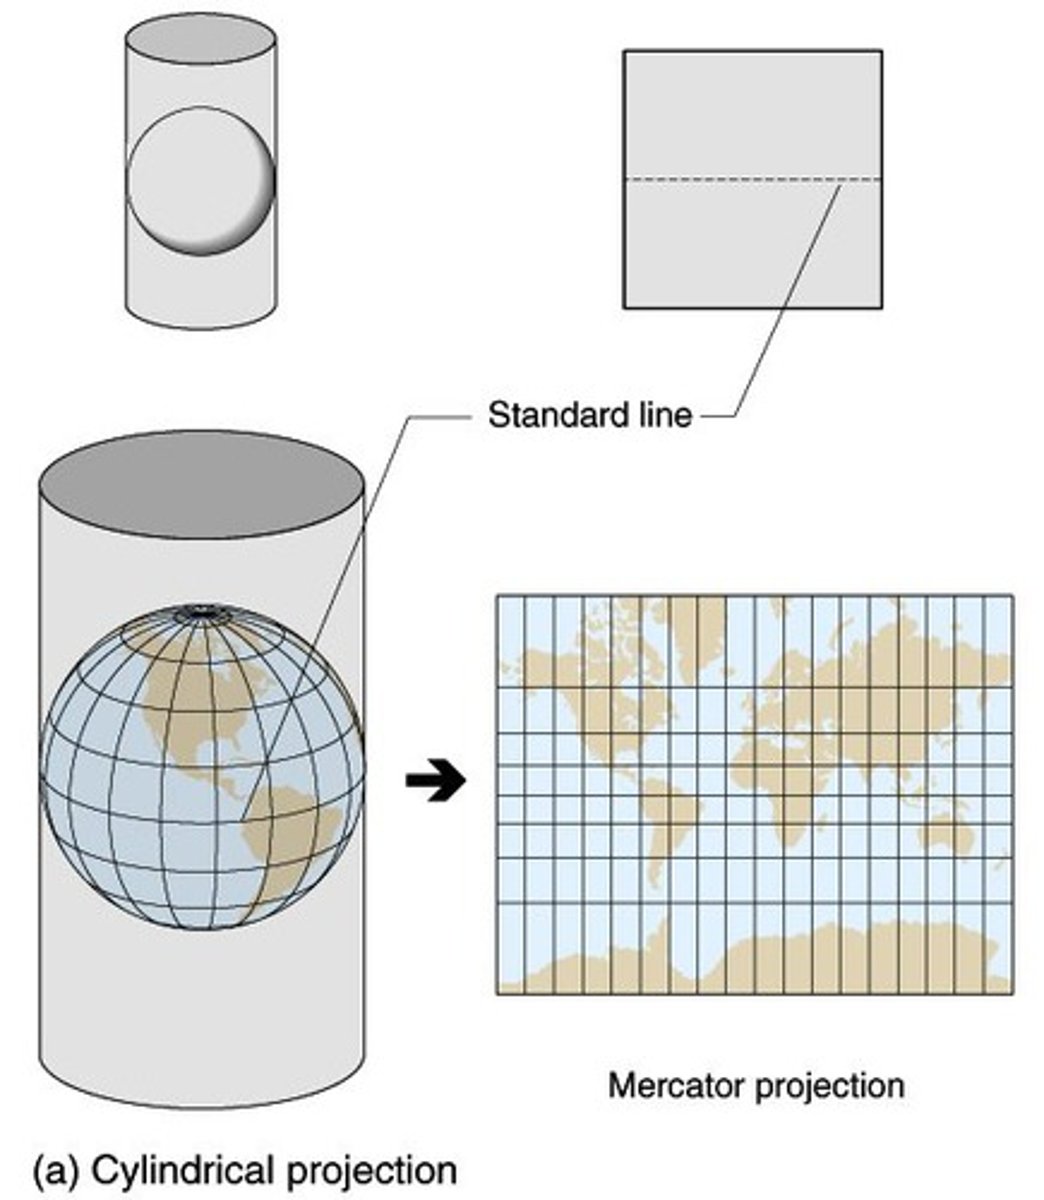
Mercator projection
- conformal
- direction not distorted
- area very distorted
- shows Earth in rectangular form
- polar regions are significantly distorted
- more correct continental shapes
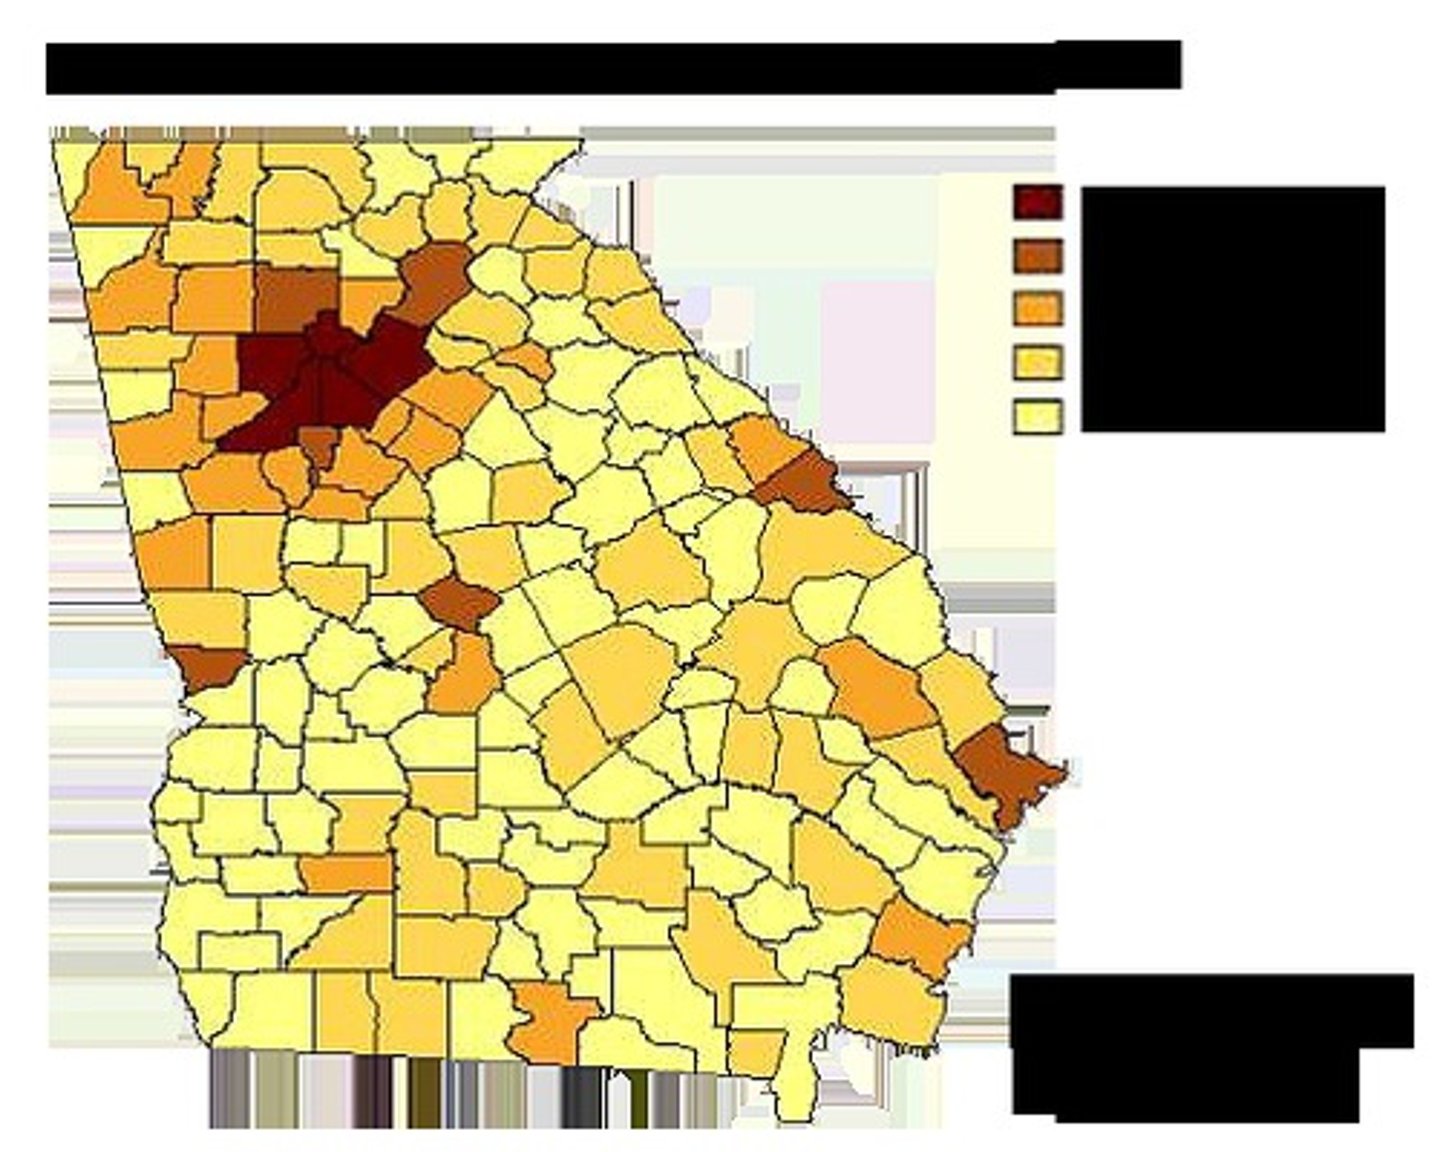
Cloropleth map
- uses colors to define areas representative of quantities
- provides an easy way to see how a measurement differs across an area/ shows the level of variability within a region
- areas are shaded or patterned in proportion to the measurement of the statistical variable being displayed
-thematic map
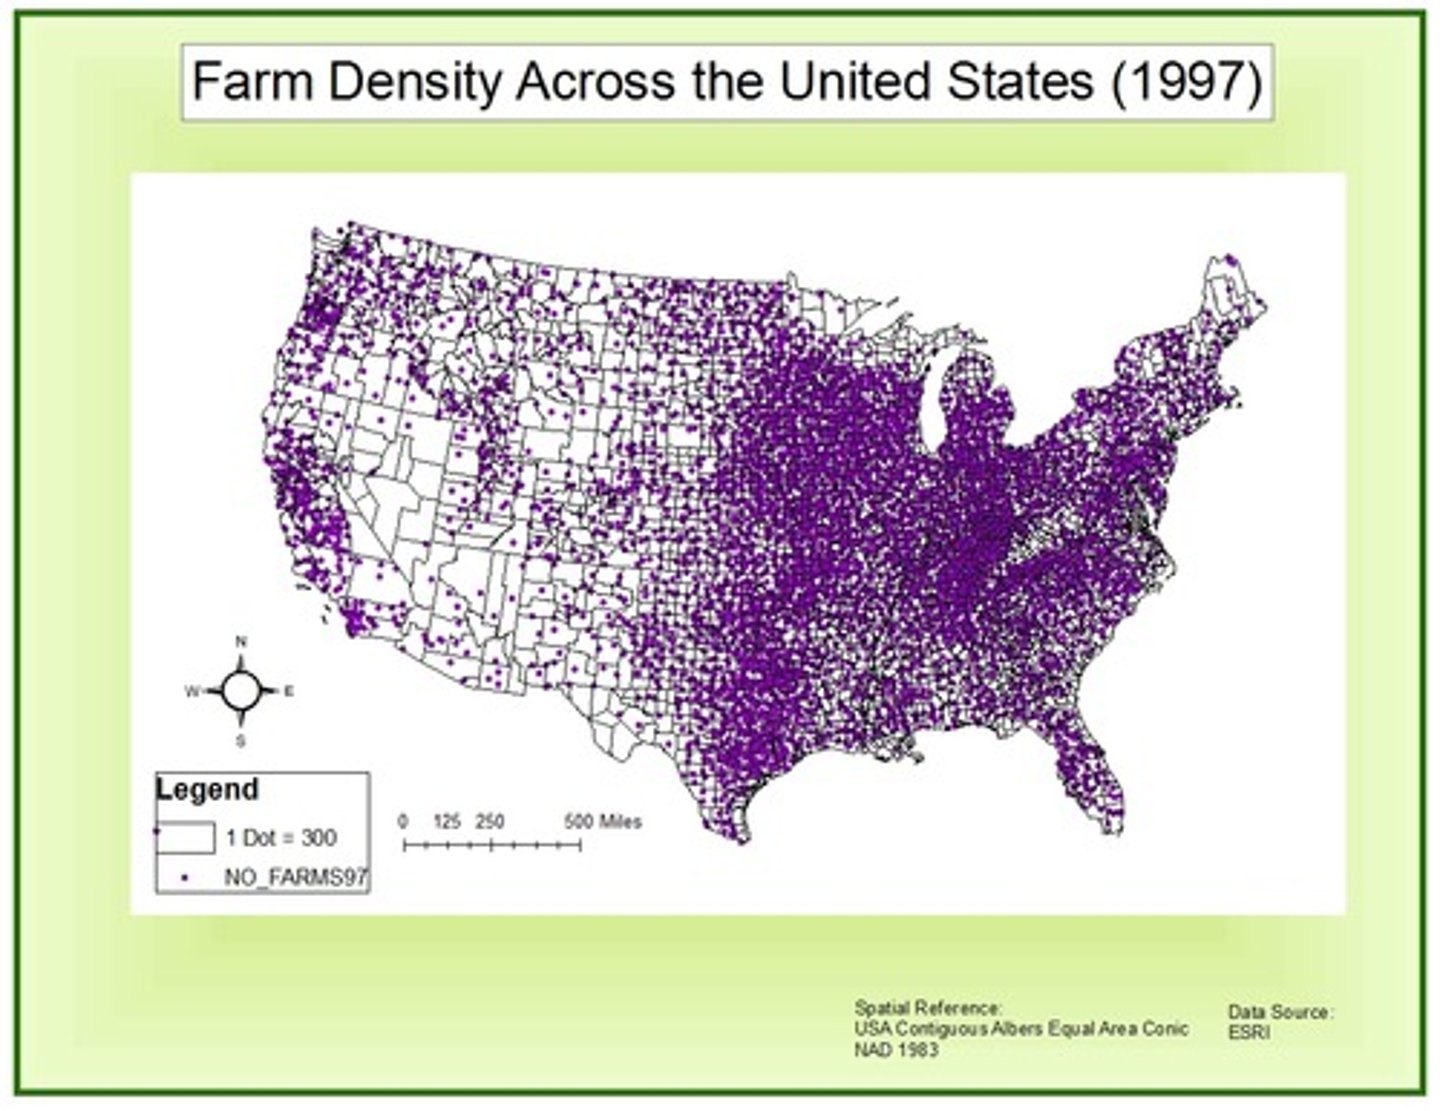
Dot map
- uses a dot symbol to show the presence of a feature or phenomenon
- rely on a visual scatter to show spatial pattern
- dot represents a certain quantity or amount
- effective way to represent variable density
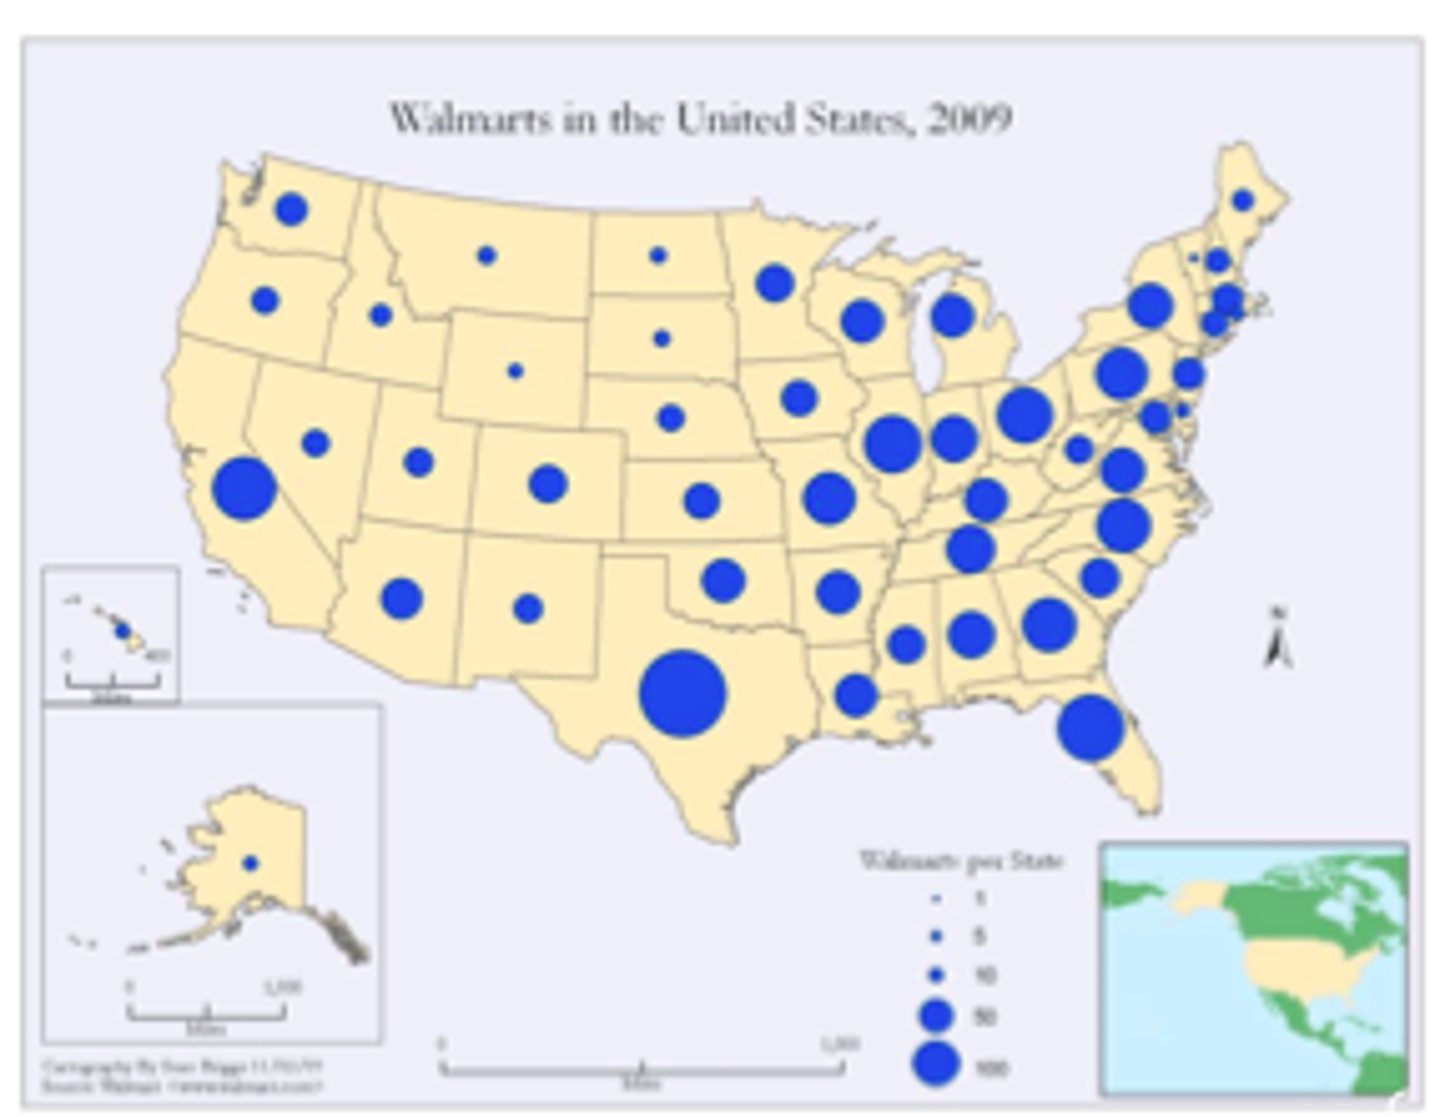
Proportional symbol map
- portrays numerical quantities
- symbols usually circles/squares drawn to proportion size of value at location
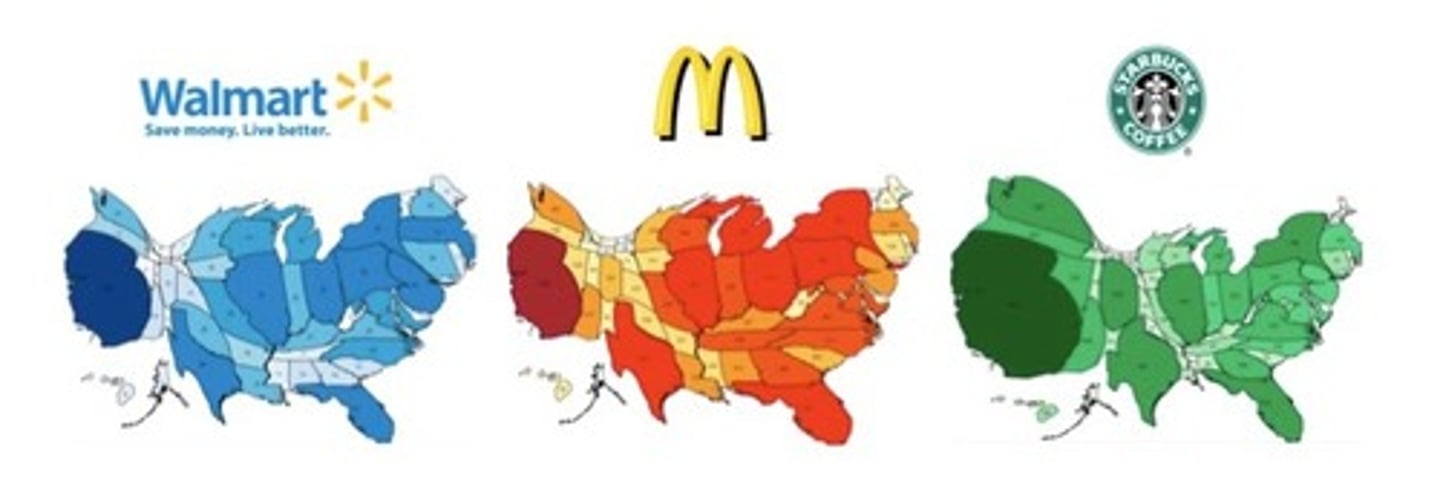
Cartogram
- shapes and areas are distorted on purpose
- emphasize the relationship between the mapped variable and the size of the affected population
- thematic map
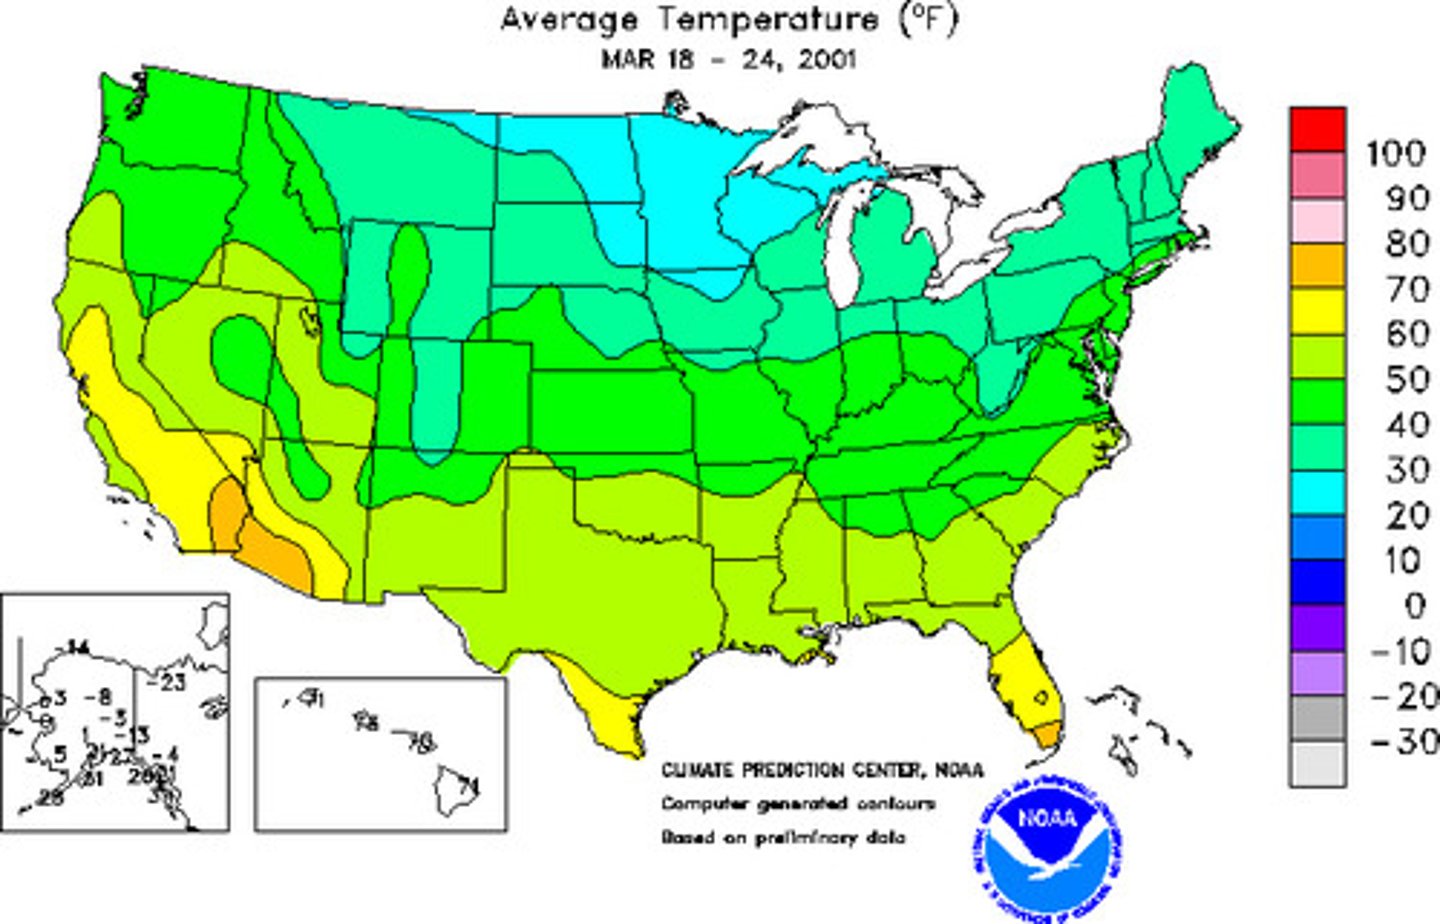
Isoline map
- used to portray quantities that vary continuously over space
- frequently used for climate variables
- thematic map
- points with equal values for lines to show equal attributes