Ch26- Large Scale Patterns
1/25
There's no tags or description
Looks like no tags are added yet.
Name | Mastery | Learn | Test | Matching | Spaced |
|---|
No study sessions yet.
26 Terms
biological diversity
the number of living organisms inhabiting the Earth
Most diverse group of organisms?
Insects, they have over 1 million species
Long-term evolutionary changes in global diversity have largely been the result of…
Speciation and extinction
Mass extinctions: End of the Permian (225 mya)
90% of marine invertebrates lost mostly likely due to volcanic activity
Mass extinctions: End of the Cretaceous (65 mya)
Dinosaurs and many other species went extinct likely due to asteroid
Mass Extinctions: During the Pleistocene (10,000 years ago)
Ice-age mammals went extinct, caused by movement of ice sheets and/or hunting by humans
Mass Extinctions: Modern extinctions (since 1600)
75% of extinctions have been the result of human activity
Global and regional patterns of species richness arise from shared ecological and evolutionary drivers:
1. Energy availability
2. Climate
3. Habitat heterogeneity
4. Evolutionary history
5. Area & isolation
Patterns of Species Diversity: Latitudinal Diversity Gradient
biodiversity increases from the poles toward the tropics.
High latitudes have fewer species than low latitudes
Arctic tundra has fewer species than tropical rainforests
This pattern is seen in both aquatic and terrestrial environments
Vascular plants tend to show peak diversity in…
the region around the equator
Species richness for cactuses is ____ in the equatorial region
low; they have adapted to desert regions
Over 25 different mechanisms have been proposed to explain the relationship between latitude and diversity, including:
age of the community
climate stability over time
spatial heterogeneity of the environment
ecosystem productivity
Tree movement during the ice ages can show the effects of climate stability. What does it look like in North America and tropical regions?
North America: glaciers pushed trees south and then north again as they melted
Tropical regions: didn’t have this back-and forth movement, so their plant communities stayed more stable
PET (potential evapotranspiration)
High PET means lots of energy, and more energy supports more life
higher biomass
bigger populations
more species
productivity
more plant growth, more resources, more environmental energy, more species
Ocean net primary production [NPP] increases or decreases from the equator toward the poles?
increases, seasonality shapes marine biodiversity, especially in the Northern Hemisphere during the summer
In higher latitudes, surface
waters are ____ ______
in spring and summer and
____ in winter
very low in winter
highly productive; very low
Vertebrate species richness relates more strongly to ________ than to plant productivity
temperature and thermal energy; temp affects animals directly whether they are endo (spend less energy on heating their bodies when it is warm) or ectotherms (rely on an external heat source)
As elevation increases, biodiversity ____
decreases; temperature and productivity decreases so there are less species
Patterns of Species Diversity: Island Biogeography Theory
Species richness on an island reflects a balance between immigration and extinction; large islands support more species, and small islands have fewer, which are also more vulnerable to stochastic events
Distance of islands from the mainland also matter:
near islands have higher immigration rates and more species richness
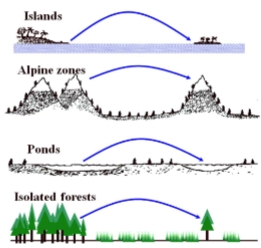
Island Biogeography Theory can be applied to any isolated habitat, not just islands, such as: (name 3)
alpine zones (mountain tops)
ponds
isolated forests
Regional Patterns of Diversity: Alpha diversity
the local species diversity of individual communities; ex: one acre in florida
Regional Patterns of Diversity: Beta Diversity
variation in species composition among communities in a geographic area (ex: species in a swamp vs a nearby scrub habitat)
Regional Patterns of Diversity: Gamma diversity
total species diversity across all communities in a region (ex: the entire Everglades region)
hotspots
regions of unusually high diversity both in species richness and endemism (endemic species). There are 35 hotspots, 2.3% of Earth’s land area contains 50% of global endemic plant species, 29% of global endemic freshwater fish species, and 77% of all terrestrial vertebrate species