Production, Costs and Revenue
1/54
There's no tags or description
Looks like no tags are added yet.
Name | Mastery | Learn | Test | Matching | Spaced | Call with Kai |
|---|
No analytics yet
Send a link to your students to track their progress
55 Terms
Define Production.
Production describes the process of transforming inputs (factors of production) into outputs (finished goods).
Define factors of production.
Factors of production are inputs into the productive process.
Define productivity.
Output per unit of input.
Define labour productivity.
Output per worker (per period of time).
Define capital productivity.
Output per unit of capital.
Define productivity gap.
The difference in labour productivity between, for example, the UK and other developed countries.
Briefly outline the UK’s productivity puzzle and potential causes.
2008- Uk labour productivity fell significantly , it had still not recovered to to its pre-recessionary level by 2014, falling in some years and only rising by a little in others.
This is due to labour ‘hoarding’, employers kept workers despite not needing them (as output fell) as they believed that it would be difficult to re-recruit and so there was low output per worker.
‘Zombie’ firms have low labour productivity, they are earning just enough sales revenue to pay interest on its debts (as they were low) (2014- BOE rejected this explanation).
Takes time for declining firms to drop labour and fast growing ones to gain it
Define firm.
A firm is a productive organisation which sells its output of goods and/or services commercially.
Define capital productivity.
Output per unit of capital.
Define productivity gap.
Productivity gap is the difference in labour productivity between different countries.
Define short run.
The time period in which at least one factor of production is fixed and cannot be varied. The only way to increase output in the short run is the increase more variable factors of production to the fixed factor(s).
Define long run.
The scale of all of the factors of production are variable.
Define specialisation.
Firms, regions, countries and workers only performing one task or a narrow range of tasks.
Define division of labour.
The production process is divided into individual tasks and workers specialise in a single/small number of tasks. Different workers performing different tasks in the course of producing a good or service
What are advantages of division of labour/ specialisation?
Benefits for the workers: improved skill/productivity and higher pay (assuming productivity increases). Benefits for firms: Lower training costs, higher output (high revenue and more competitive), higher productivity/lower costs, less equipment needed (lower capital costs).
What are disadvantages of labour/ specialisation?
Firms: Higher staff turnover, production lines are vulnerable to breakdowns, quality of workers may suffer.
Workers: Boredom, limited range of skills (may struggle if they loose their job), easily replaceable by capital.
Give an example of specialisation.
Adam Smith pin factory. Three aspects of the division of labour: the increase of dexterity in each particular workman, the saving of time which is commonly lost in passing from one species of work to another and the invention of machines which enable one man to do the work of many.
Define trade.
The buying and selling of goods and/or services.
Define exchange.
To give something in return for something else received e.g money. Money allows for specialisation and a greater division of labour than is possible with barter as there is no need for a double coincidence of wants and it is universaling.
Define marginal returns to labour.
Marginal returns to labour is the change in the quantity of total output resulting from the employment of one more worker, holding all the other factors of production fixed.
What is the law of diminishing marginal returns?
A short run law which states that, as a variable factor of production is added to a fixed factor of production, both the marginal and eventually the average returns to the variable factor will begin to fall.
It occurs when adding more of a variable input to a fixed input leads to a smaller increase in output then when the previous unit of varaible input was added to the fixed input. If at least one factor is fixed, its usefulness in relation to other factors is limited.
Why does the law of diminishing marginal returns occur?
The productivity of the variable inputs is constrained by the fixed input, the productivity of the variable inputs will begin to decrease at a point. For example, additional units of labour initially increase productivity and output (due to the division of labour and utilisation of the fixed factors) until the fixed factors constrain production (MP decreases as workers get in each others way).
When does the law of diminishing marginal returns occur
Diminishing marginal returns sets in when MP is at its maximum point
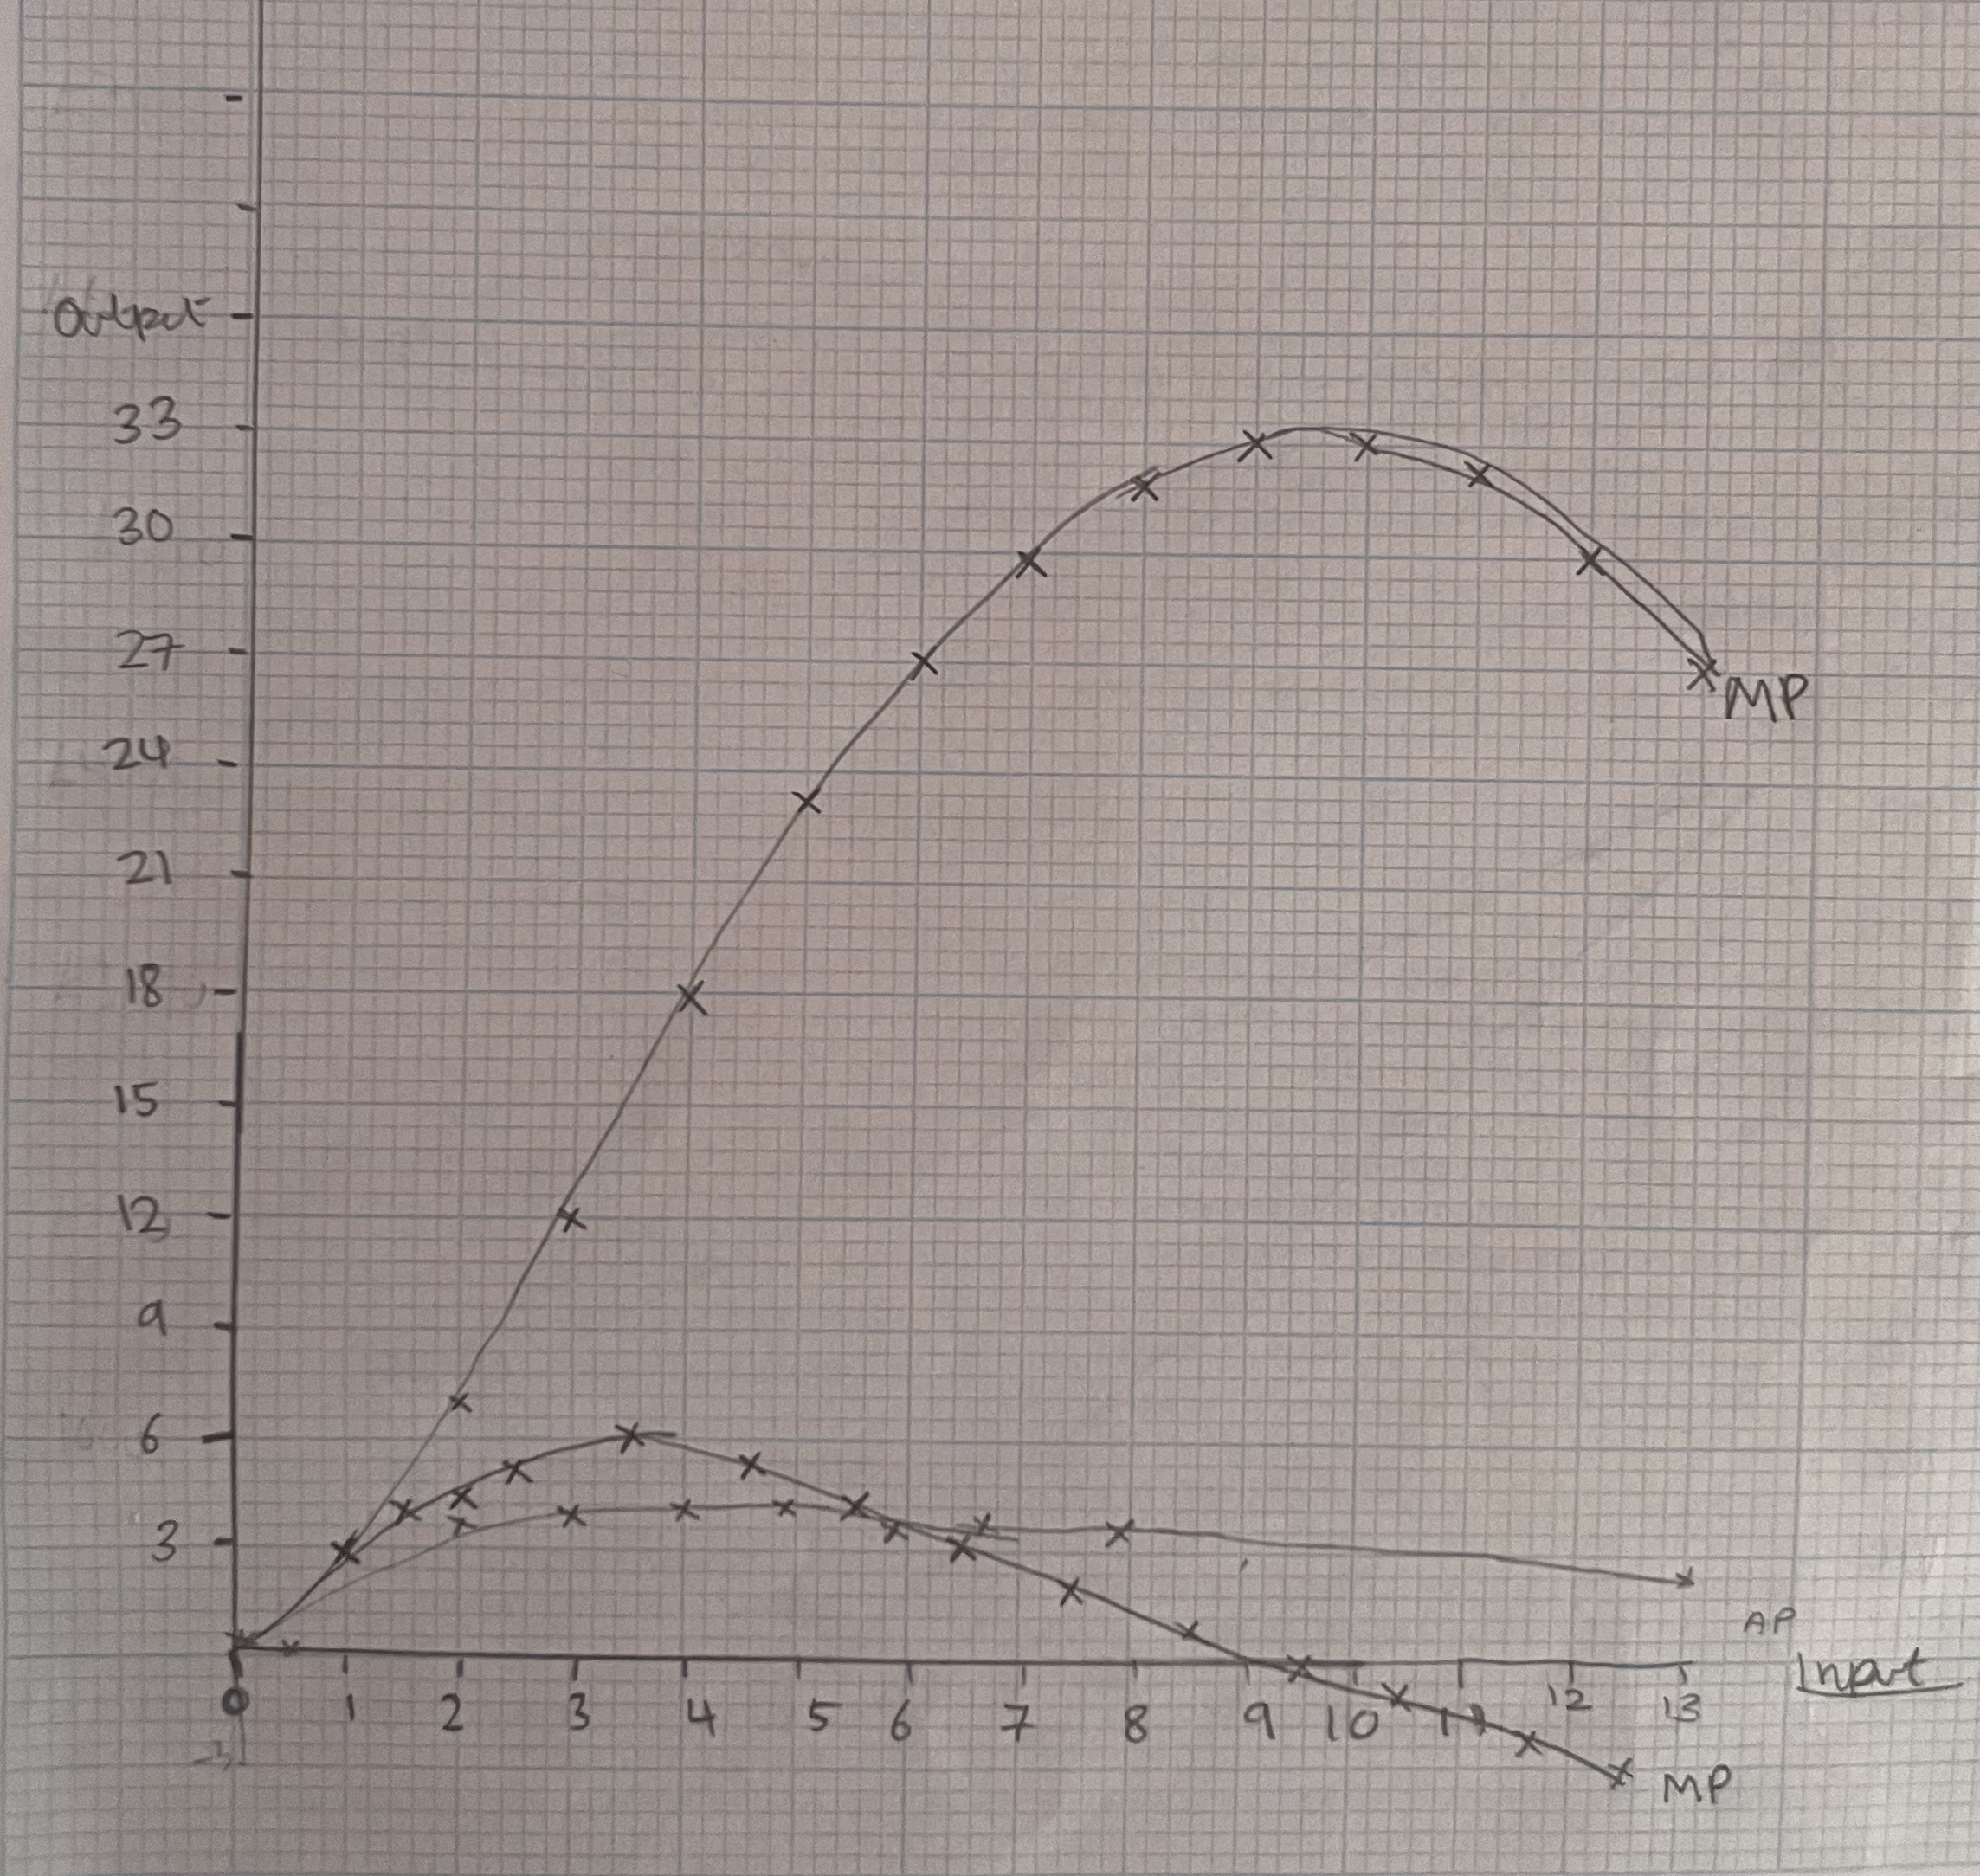
What does the graph displaying diminishing marginal returns look like (what happens to TP, MP and AP as input increases? Why, what are the relationships between them?
The MP curve is the gradient function of the TP curve, initially, both MP and TP are rising but as input continues to increase, the marginal product per additional unit of input begins to decrease and so the TP continuous rising at an increasingly slower rate until MP=0, at which point TP reaches its maximum value and from there begins to decrease along with MP. TP is maximised when MP is zero. AP increase until MP decreases.
What is the relationship between the TR curve and the MR curve?
MR is the gradient function of the TR curve.
Define returns to scale.
Returns to scale is the rate by which output changes if the scale of all factors of production is changed, it occurs in the long run. Increasing returns to scale occurs when output increases at a faster rate than the increase in the scale of the factors of production. Constant returns to scale occurs when output increases at the same rate as the scale of the factors of production. Decreasing returns to scale occurs when output increases at a slower rate then the scale of all of the factors of production employed.
What are fixed costs and what type of cost are they?
Fixed costs are costs of production which, in the short run, do not vary with output, e.g rent, they are explicit costs.
What are variable costs?
Variable costs are costs of production which vary with output e.g raw material costs, they costs are explicit.
What type of cost is opportunity costs?
Implicit costs.
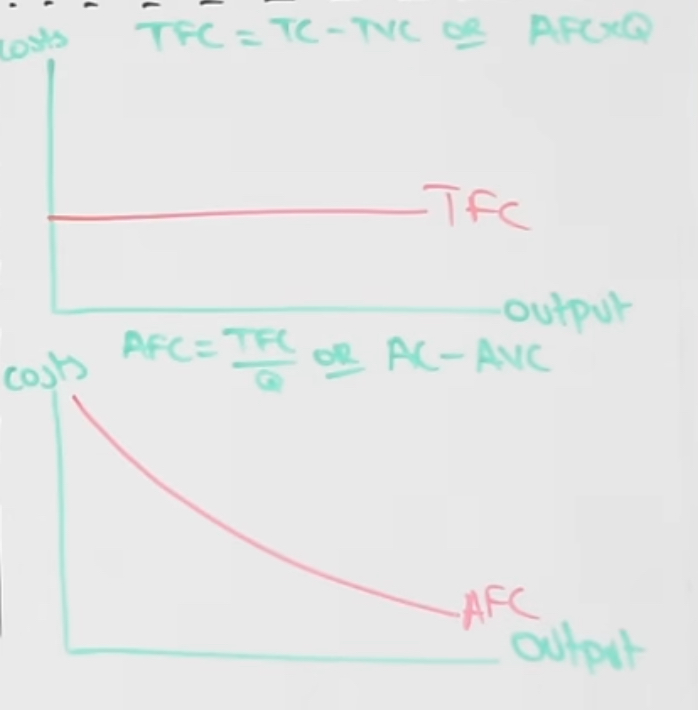
What does TFC and AVF look like plotted on a graph?
These are unrelated to the law of diminishing marginal returns.
What type of costs are long run costs
Long run costs are always variable costs.
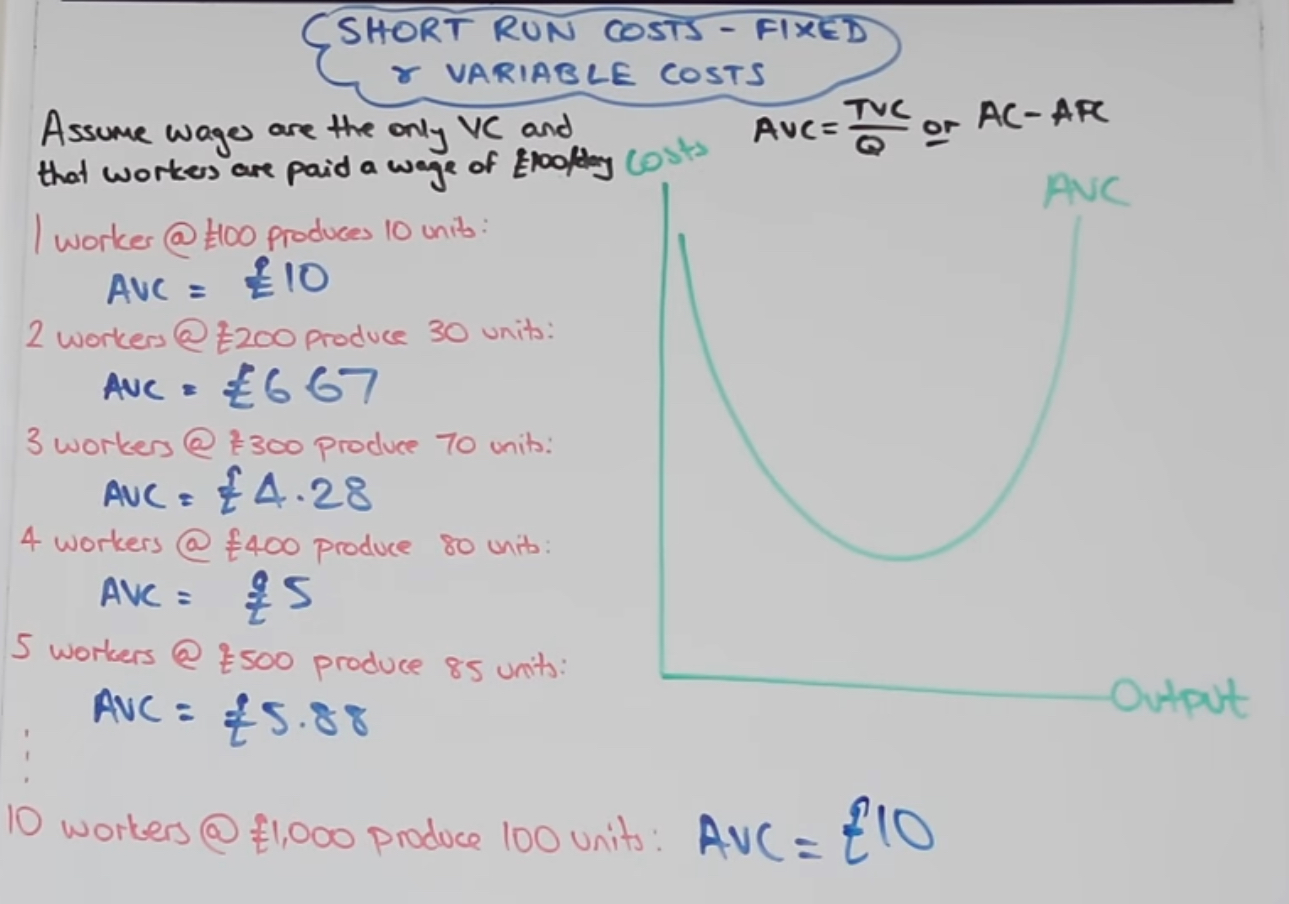
Explain the shape of the AVC curve.
It is a reflection of the AP curve (and so is a tick or drunken J shape) as it is determined by the law of diminishing marginal returns. As output increases, costs increase as there is a higher cost per unit due to decreasing labour productivity.
What does the AVC curve look like as output increases and why?
As productivity increases, MP increases and so AVC fall, however in the short run, this increase in productivity will be constrained and will decrease due to the fixed factor(s) of production, causing MP and productivity to decrease and so AVC to increase (the law of diminishing marginal returns).
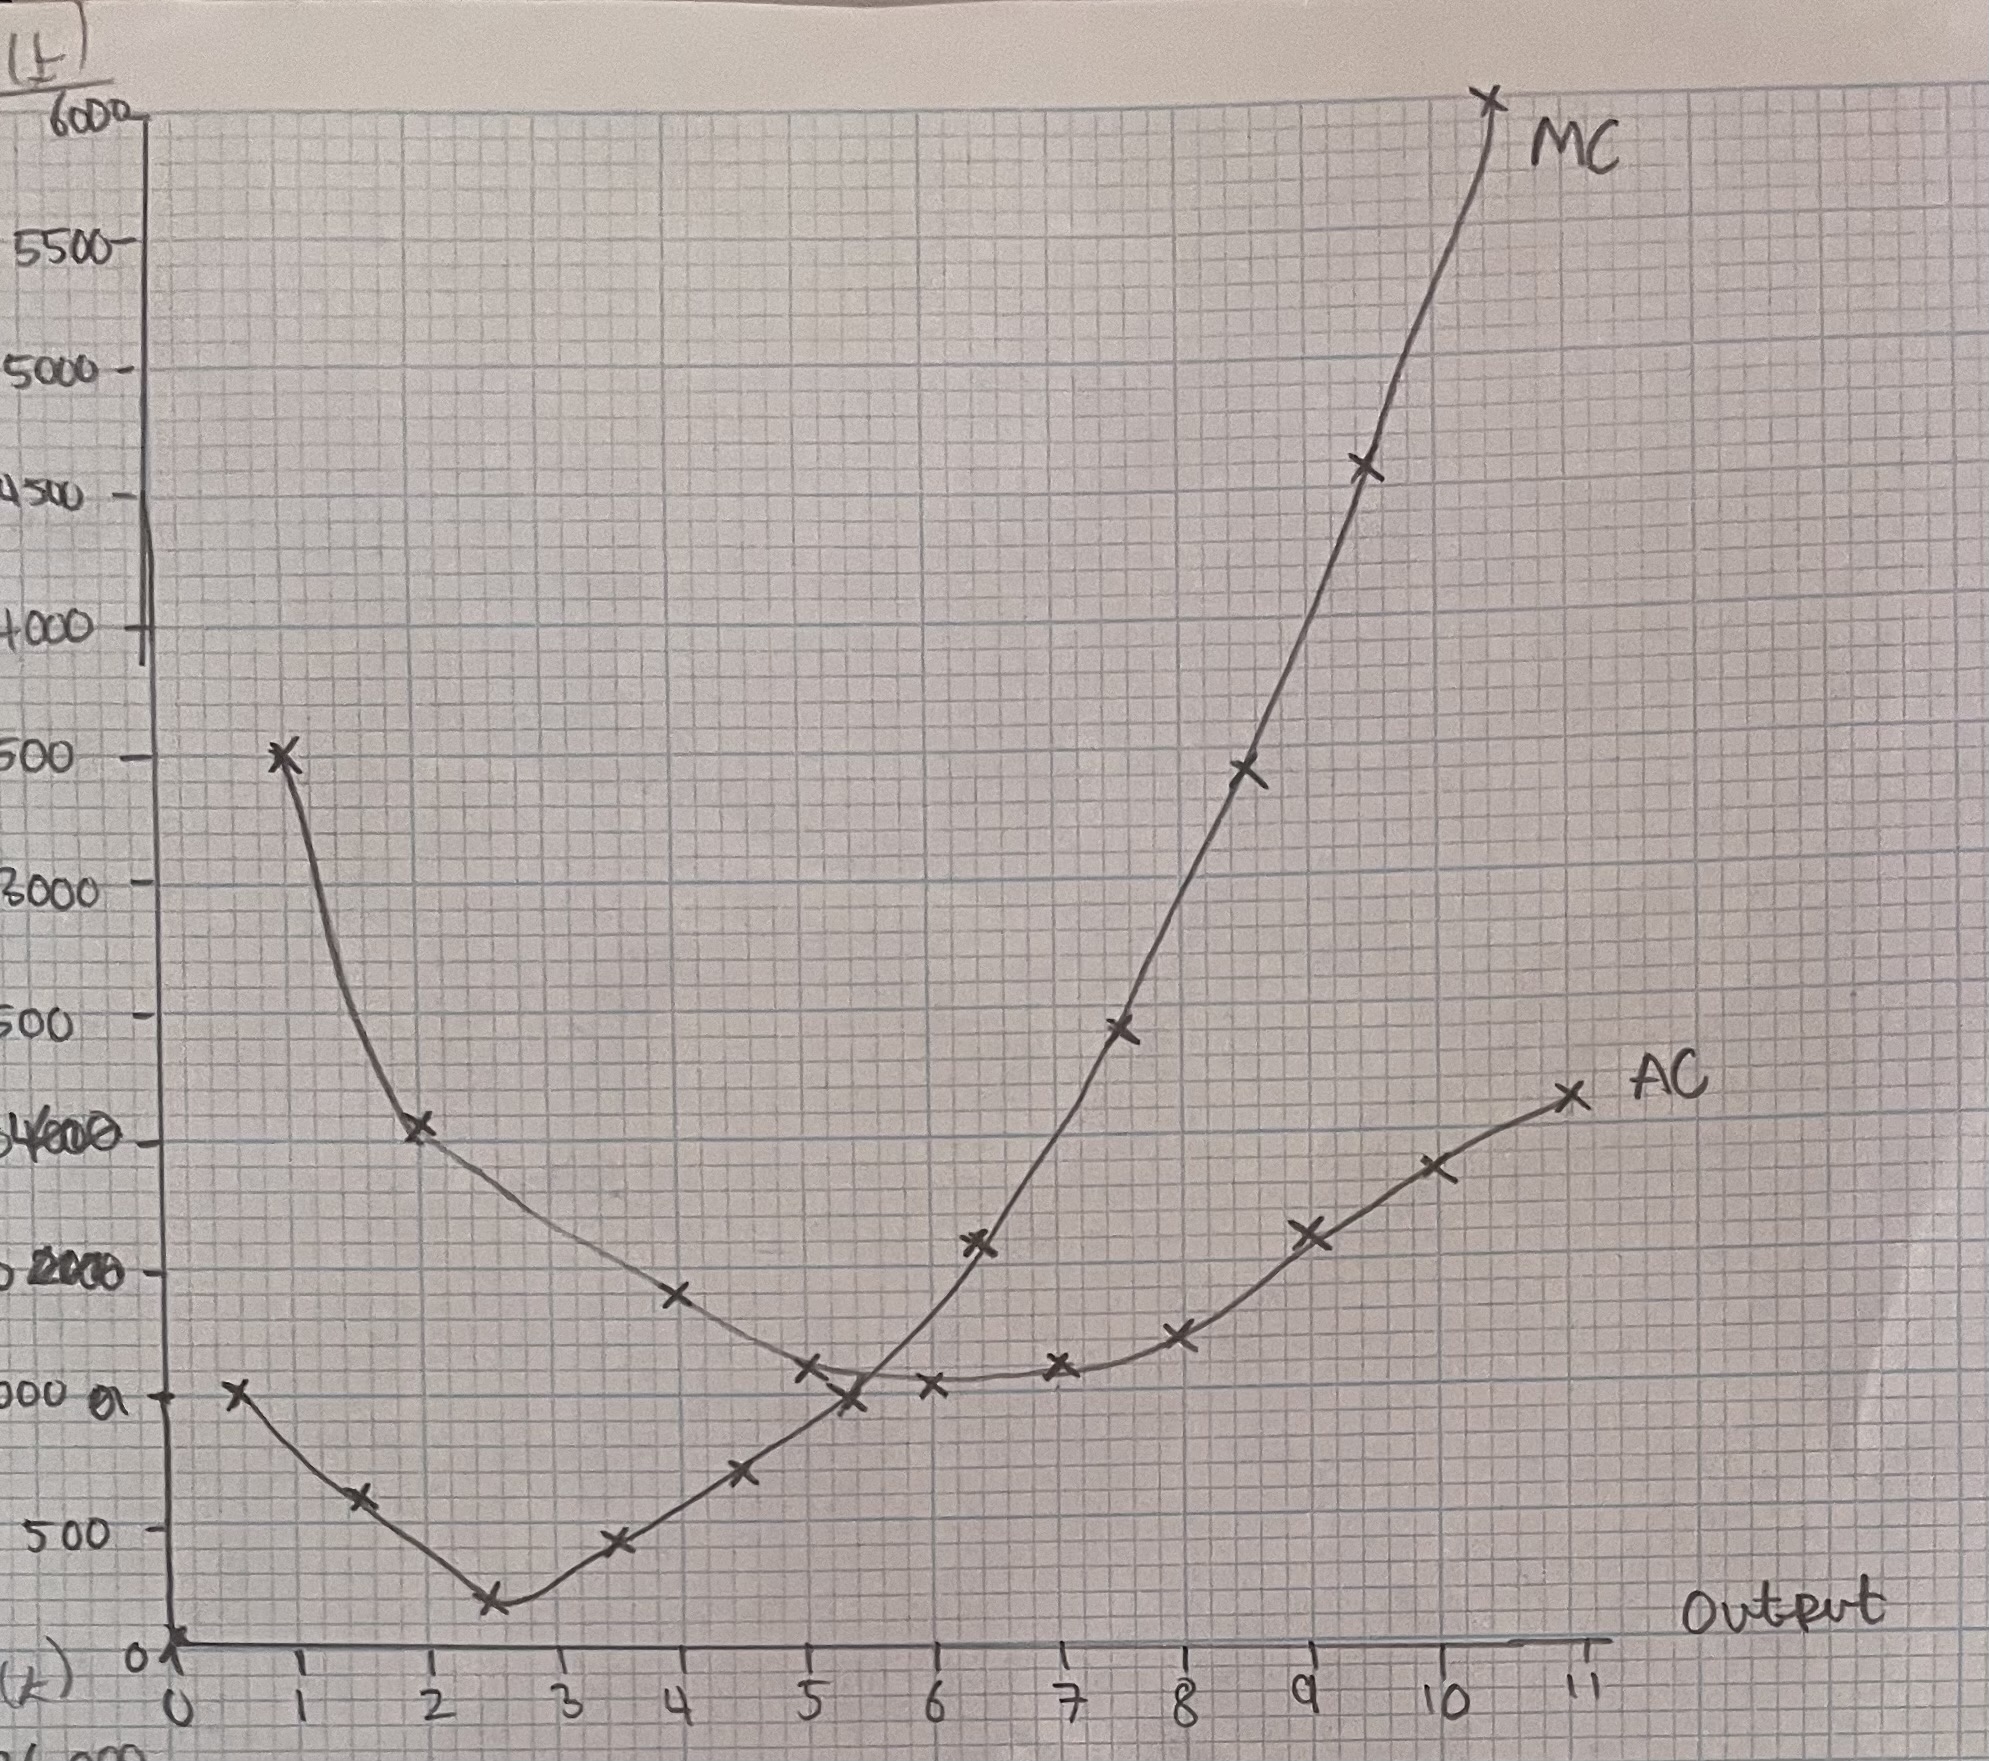
What do the MC and AC curves look like plotted against output? Why? What is interesting about them in relation to two other curves?
MC and AC are reflections of MP and AP. As productivity and MP increase, MC decrease, however when MP reaches it’s maximum point (is equal to 0), MC will begin to increase as productivity/MP is decreasing.
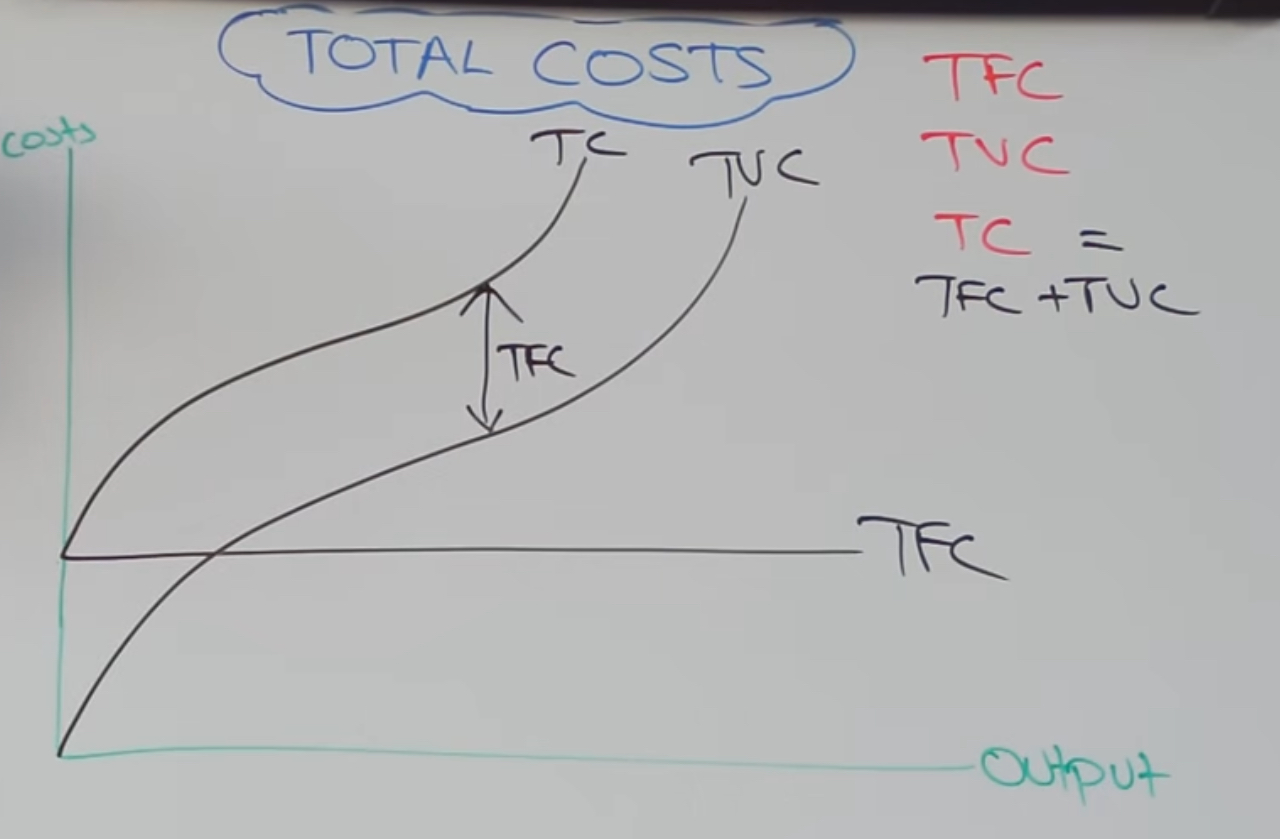
What does the graph plotting TC, TVC and TFC look like and why
Initially, TVC are increasing quickly (high costs in relation to output) due to productivity gains and increasing returns to labour ( due to the division of labour), however on the second half of the curve, diminishing marginal returns sets in and there are decreasing returns to labour due to lower productivity.
Define economies of scale.
As output increases, long run average costs Decreasing average costs due to an increase in the size and scale of a firm. LRAC curve is sloping downwards as LRAC are decreasing.
Define diseconomies of scale.
As output increases, long run average costs rise.
How is the long run average cost curve formed
The LRAC curve is an envelope of all of the minimum points of the short run average cost curves at different levels of output (different sizes of the firm).
What does the LRAC curve look like
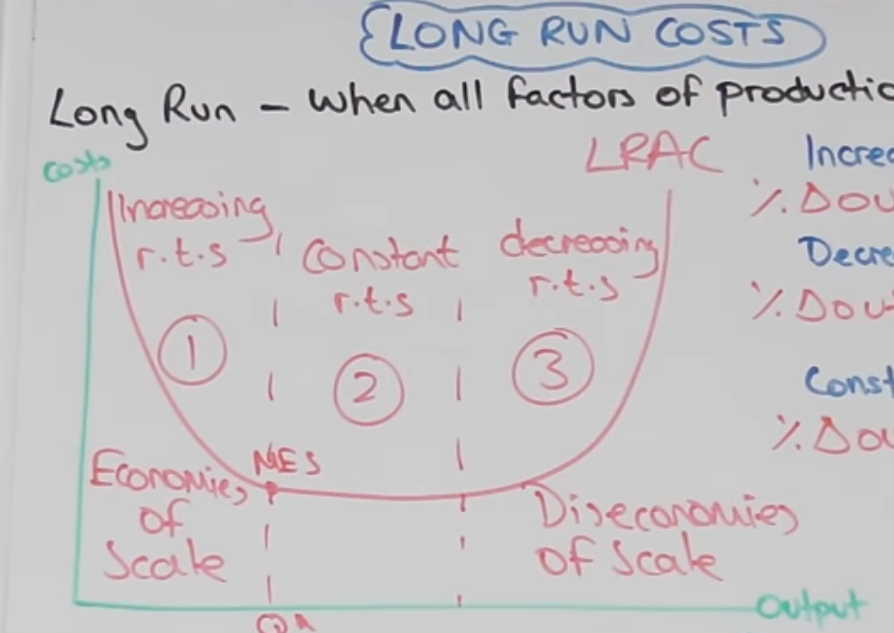
What is the minimum efficient scale point
The lowest level of output required to exploit full economies of scale.
What are internal economies and diseconomies of scale
Changes in long run average costs of production resulting from changes in the size or scale of the firm or plant.
What are the reasons for internal economies of scale
Really Funny Mums Try Making Pies.
Risk bearing economies, financial economies, managerial economies, technical economies, marketing economies, purchasing economies.
AC=TC/Q quantity is increasing by a faster rate then total costs, lowering average costs.
What are risk bearing economies of scale
Larger firms are able to attempt to market riskier products as failure has less effect. Larger firms can group and spread their risks by diversifying their output, markers, sources of supply, finance, and their productive proceess
Define managerial economies of scale
The larger the scale of the firm, the greater its ability to employ specialist managers who can monitor and boost the productivity of different operations of the workforce and bring in specialist skills.
Define technical economies.
Reduction in average costs by making better use of capital equipment and technology and improving large scale production process. Specialist machinery, making better use of current capital and a greater division of labour.
What are purchasing economies of scale
Larger firms will need a greater amount of inputs so they buy in bulk, them may be able to negotiate discounts. Larger firms are likely to find it easier and cheaper to borrow from banks then smaller (higher interest rate) firms are as larger firms pose less of a risk (lower interest rate). Larger firms also have means of gaining finances (e.g shares).
What are marketing economies of scale
The cost per unit of marketing is smaller for larger firms.
What are external economies of scale
Decreasing average costs due to the positive externalities of an industry or economy growing in size
What is allocative efficiency and where does it occur
Where resources are allocated to meet consumer demand, where society surplus and net social welfare is maximised. It occurs when D= S, MSB=MSC and when P=MC.
Impact on consumer resources follow consumer demand, low pr
What is productive efficient and where does it occur
Productive efficiency occurs when goods and services are produced at their lowest possible costs (no resources are wasted), it occurs when firms are operating on the minimum point of their AC curve
What is X efficiency and where does it occur. When might it occur
X efficiency occurs when firms when a firm is minimising their waste. It occurs when they are producing on their AC curve.
It might occur in monopolies or public sector organisations.
What is dynamic efficiency
The reinvestment of long run supernormal profits back into the firm. Dynamic efficiency’s occur over time.
What is static efficiency
Efficiency’s that occur at one specific production point. X efficiency, productive efficiency and allocative efficiency
Where do firms produce
At the profit maximising point, where MC=MR