ECGs
1/86
There's no tags or description
Looks like no tags are added yet.
Name | Mastery | Learn | Test | Matching | Spaced |
|---|
No study sessions yet.
87 Terms
Anatomical locations for V1-V6
V1 4th Intercostal space, right of the sternum
V2 4th Intercostal space, left of the sternum
V4 5th Intercostal space, on left midclavicular line
V6 On the left mid-axillary line, level with V4
V3 Midway between V2 and V4
V5 Midway between V4 and V6
V4R 5th Intercostal space, on the right midclavicular line
Which are the Lateral Leads and what part of the heart does each lead look at and what arteries supply the blood.
Left Circumflex (LCx) or LAD
Lead I (Superior part of the left ventricle) LCx
aVL (Superior part of the left ventricle) LCx
V5 (Lateral wall of the left ventricle) (LCx) and the diagonal branches of the (LAD)
V6 (Lateral wall of the left ventricle) (LCx) and the diagonal branches of the (LAD)
Which are the Inferior Leads and what part of the heart does each lead look at and what arteries supply the blood.
Right Coronary Artery (RCA) or sometimes Left Circumflex Artery (LCx) (in left dominant hearts)
Lead II: Inferior wall of the left ventricle
Lead III: Inferior wall of the left ventricle
aVF: Inferior wall of the left ventricle
Which are the Septal & Anterior Leads and what part of the heart does each lead look at and what arteries supply the blood.
Left Anterior Descending Artery (LAD)
V1: septum
V2: septum
V3: Anterior wall of the left ventricle
V4: Anterior wall of the left ventricle
Which are the Non localizing leads and what part of the heart does each lead look at and what arteries supply the blood.
aVR
No direct artery; reflects global ischemia or reciprocal changes
Which are the Right Leads and what part of the heart does each lead look at and what arteries supply the blood.
Right Coronary Artery (RCA)
V4R (Anterior Wall Right Ventricle)
Normal Axis angle
Left Axis angle
Right Axis angle
Extreme Axis angle
-30° to +90°
-90° to -30°
+90° to 180°
180° to -90°
What lead findings indicate normal axis
lead I and aVF are both positive OR
Lead I is Positive and aVF is negative and lead II is positive
lead I and aVF are positive, what is the axis
normal
What lead findings indicate right axis
Lead I in negative and aVF is positive
Lead I is negative and aVF is positive, what is the axis
Right
What lead findings indicate extreme axis
lead I and aVF are both negative
lead I and aVF are both negative, what is the axis
Extreme
What lead findings indicate left axis
Lead I is Positive and aVF is negative and lead II is negative
what’s the time period of the following
one small square
one large square
5 large squares
40 milliseconds/0.04 seconds
200 milliseconds/ 0.2 seconds
1 second
Calculating Rate, 300 ÷ the number of large square between each QRS
1
2
3
4
5
6
50
60
75
100
150
300
Irregularly irregular heart rhythms are most commonly associated with?
Atrial Fibrillation (AF)
Atrial Flutter with Variable Conduction
Multifocal Atrial Tachycardia (MAT)
Ventricular Fibrillation (VF)
An irregularly regular heart rhythm is associated with what rhythms?
Second-Degree AV Block (Type I - Wenckebach) Progressive lengthening of the PR interval until a beat is dropped
Second-Degree AV Block (Type II - Mobitz II) Sudden failure of a P wave to conduct to the ventricles
Bigeminy or Trigeminy (PACs or PVCs)
During deep inspiration _______ waves and __________waves disappear in lead ___________
small Q waves
inverted T waves
III
P wave criteria
Positive in lead II
duration less that 120ms (3 small squares)
Amplitude of less that 2.5 mm (2.5 small squares) in limb leads
Amplitude of less that 2.5 mm (2.5 small squares) in precordial leads
Abnormal P Wave Features
P wave > 120 ms → Suggests left atrial enlargement (P mitrale).
P wave > 2.5 mm → Suggests right atrial enlargement (P pulmonale).
Biphasic P wave in V1 → Can indicate atrial enlargement (left or right).
Inverted P wave in lead II → May suggest an ectopic atrial rhythm or junctional rhythm.
what can U waves indicate
hypokalemic patients or normal finding
Criteria for a Normal P-R Interval
Normal range: 120–200 ms (3–5 small squares)
Even duration every time
Abnormal P-R Intervals
short?
Long?
Varying?
Pre-excitation syndromes (e.g., Wolff-Parkinson-White Syndrome - WPW)
First-degree AV block if consistent
Second-Degree AV Block (Mobitz Type I – Wenckebach)
Electrolyte disturbances (e.g., hyperkalemia).
Second-Degree AV Block (Mobitz Type I – Wenckebach)
Second-Degree AV Block (Mobitz Type II)
Complete (Third-Degree) AV Block
Multifocal Atrial Tachycardia (MAT)
Criteria for a Normal QRS Complex
Normal: < 120 ms (< 3 small squares)
Should have a normal progression across precordial (chest) leads:
V1-V2: Small R wave, deep S wave.
V3-V4: Transition zone (R and S waves approximately equal).
V5-V6: Large R wave, small S wave.
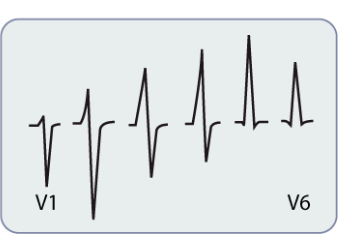
QRS Abnormalities
Criteria for a Normal Q Wave
Bundle branch block (BBB), ventricular rhythms, WPW
LVH, RVH, hypertrophic cardiomyopathy
Pericardial effusion, obesity, hypothyroidism, COPD
Criteria for a Normal Q Wave
< 40 ms (0.04 sec, 1 small square)
< 25% of the R wave height in the same lead
Abnormal Q Waves
Wide (> 1 small square)
≥ (25%) of the R wave height
Seen in prior myocardial infarction (MI) if present in infarcted leads
Can suggest previous MI, hypertrophic cardiomyopathy, or conduction abnormalities
Normal ST Segment criteria
Should be isoelectric (baseline) or show only slight deviations.
Normal: < 0.20 sec (5 small squares)
ST Elevation (Normal)
Normal: ≤ 1 mm (1 small square) in limb leads (I, II, III, aVL, aVF)
Normal: ≤ 2 mm (2 small squares) in precordial leads (V1-V6)
ST Segment criteria for MI
Elevation > 1 mm (limb) or > 2 mm (precordial) → STEMI
Depression > 0.5 mm in contiguous leads → Ischemia/NSTEMI
Concave (pericarditis or early repolarization (Mabey))
convex (STEMI), down sloping (ischemia)
reciprocal depression → STEMI
Normal criteria for T waves
Criteria for Limb leads (I, II, III, aVL, aVF): ≤ 5 mm (0.5 mV)
Precordial leads (V1-V6): ≤ 10 mm (1.0 mV)
Abnormal T waves
Tall, peaked T waves (> 10 mm in precordial leads, > 5 mm in limb leads)
Low amplitude T waves (< 1 mm)
Flattened or biphasic
Hyperkalemia
Hypokalemia, pericardial effusion, hypothyroidism
Hypokalemia, ischemia
Criteria for Normal Q-T interval
less than half the preceding R-R interval
Abnormal Q-T interval
less than half the preceding R-R interval
> 440 ms in men (11.75 small squares) LQTS, meds, hypokalemia
> 460 ms in women (12 small squares) LQTS, meds, hypokalemia
<350 ms in either (8.75 small squares) Hypercalcemia, digoxin
Long PR interval criteria and causes
A distance of more than five small squares from the start of the P wave to the start of the R wave (or Q wave if there is one)
First-Degree AV Block (most common)
Second-Degree AV Block (Type I - Mobitz I/Wenckebach)
It rarely requires action, but in the presence of other abnormalities might be a sign of hyperkalemia, digoxin toxicity, or cardiomyopathy.
why is the Q wave negative and which leads should we see it?
The Q wave depolarizes the left ventricle first so the overall direction is left to right, away from so they can be seen in the lateral/ left leads, I, aVL, V5, V6
Q waves should not be seen in Right sided/ anterior leads leads, V1-V3 this could indicate anterior myocardial infarction (MI), structural heart disease, or conduction abnormalities.
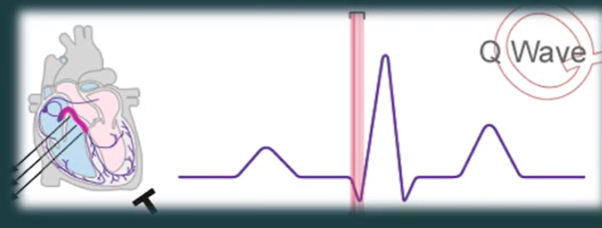
Pathological Q waves
> 40ms (1mm wide)
2mm deep
more that 25% of QRS complex
seen in V1, V2, V3
can indicate current it past anterior MI
prolonged Q-T
what is it for men a women?
what can it indicate?
Prolonged if >440ms in men, >460ms in women
Normal QT is less than half the preceding RR interval
Causes:
Hypokalaemia
Hypomagnesaemia
Hypocalcaemia
Hypothermia
Myocardial ischaemia
ROSC (Return of Spontaneous Circulation)
Raised ICP (Intracranial Pressure)
Congenital long QT syndrome
Medications / drugs
what are the 3 common R wave abnormalities
Dominant R wave in V1
Dominant R wave in aVR
Poor R wave progression
what can Dominant R wave in V1 indicate
Normal in children and young adults
Right ventricular hypertrophy → Pulmonary embolism, left-to-right shunt
Right Bundle Branch Block
Posterior Myocardial Infarction
what can Dominant R wave in aVR indicate
sodium channel blocking dugs poisoning

what can Poor R wave progression indicate
Prior anteroseptal MI
LVH (Left Ventricular Hypertrophy)
Inaccurate lead placement
What is J point
the junction between the termination of the QRS and the beginning of the S-T
Normal T waves criteria
Upright in all leads except aVR and V1
Amplitude <5mm in limb leads, 10mm in precordial leads
Draw as many T wave patters as you can and label what they indicate
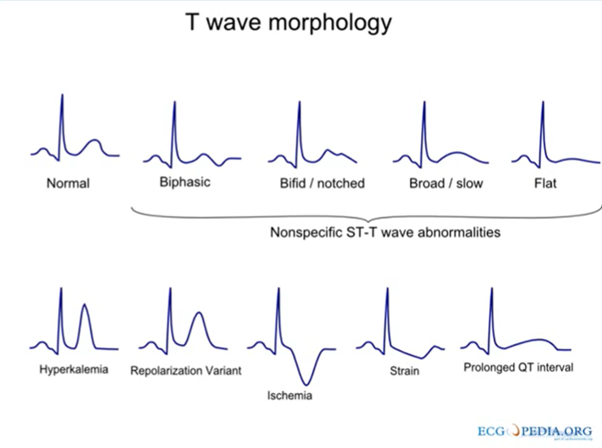
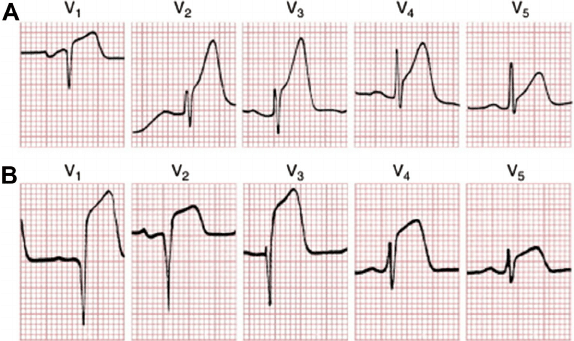
what is that and what can it indicate
Hyperacute T waves, can be first sign of MI
What is a U wave?
When will you see it?
What can it indicate?
The U wave follows the T wave and represents delayed repolarisation of the Purkinje Fibers.
U wave becomes visible when the heart rate slows below <60 bpm
Abnormalities of U waves:
Prominent U waves: Bradycardia, severe hypokalaemia, digoxin
Inverted U waves: Coronary artery disease, hypertension, valvular heart disease, cardiomyopathy
what is a delta wave
what does it look like
what does it indicate
pre-excitation of the ventricles
The Delta wave is a slurred upstroke in the QRS complex
Often associated with shortening of the PR interval
Most associated with pre-excitation syndromes such as Wolff-Parkinson-White

Left ventricular hypertrophy can be identified with the Sokolow–Lyon index explain it
Does the sum of the S wave in lead V1 and the R wave in V6 add up to more than 3.5 mV, ie, 35 small or seven big squares?
A wide QRS complex despite sinus rhythm is the hallmark of bundle branch block. Left bundle branch block (LBBB) can cause the ECG to look extremely abnormal
Both LBBB and RBBB cause a wide QRS complex due to delayed conduction.
what changes are you looking for in what leads to differentiate L from R BBB
Look at Leads V1 & V6
V1 is a right-sided chest lead.
V6 is a left-sided chest lead.
The bundle branch that is blocked will cause a delayed activation of that ventricle, producing characteristic patterns.
Lead | LBBB | RBBB |
|---|---|---|
V1 | Deep S wave ("W" pattern) | R-S-R' ("M" pattern, "Rabbit ears") |
V6 | Broad, notched ("M" pattern) R wave | Broad R wave with slurred S wave |
LBBB: V1 shows a deep wide S wave, V6 shows a broad notched R wave.
RBBB: V1 shows an R-S-R' (M pattern or "Rabbit ears"), V6 shows a wide slurred S wave.
AV Node
where is it located ?
What artery supplies it?
What’s is its inherent rate?
what id its function
inferior portion of the right atrium within atrioventricular septum
RCA
40-60
connects electrical structure of atrial to the ventricles and acts to delay impulses to the ventricles to allow them to fill with blood.
Bundle if Hiss
where is it located ?
What artery supplies it?
What’s is its inherent rate?
what id its function
Location: Originates at the AV node (inferior part of Right atrium) and moved down the introventricular septum.
Artery Supply: Right coronary artery (in most people)
Inherent Rate: 30-45 beats per minute
Function: Conducts electrical impulses from the AV node to the L & R BB
Bundle branches
What artery supplies them?
What’s is its inherent rate?
what id its function
Artery Supply: Left anterior descending (LAD) artery and right coronary artery (RCA)
Inherent Rate: 20-40 beats per minute
Function: Transmit electrical impulses from the Bundle of His to the Purkinje fibers for ventricular contraction
Purkinje fivers
where is it located ?
What’s is its inherent rate?
what id its function
Myocardium muscle
What’s is its inherent rate?
Purkinje Fibers Location: Inner ventricular walls (subendocardial layer)
Inherent Rate: 20-40 beats per minute
Function: Rapidly conduct electrical impulses to the ventricles, ensuring coordinated contraction
What are the pacemaker sites of the heart and what are the rates?
sinoatrial (SA) Node: 60-100 beats per minute (primary pacemaker)
Atrioventricular (AV) Node: 40-60 beats per minute (backup pacemaker)
Bundle of His: 30-45 beats per minute
Bundle Branches: 20-40 beats per minute
Purkinje Fibers: 20-40 beats per minute
Respiratory Sinus arrythmia RSA
Who gets it
What causes it
Describe the mechanism
Young healthy people
Breathing causes reflex changes in vagal tone
Inspiration > negative pressure > reduces vagal tone > faster HR
Exhalation > thoracic cavity pressure increases > increases vagal tone > slower HR
The five steps of the cardiac electrical cycle are
Sinoatrial (SA) Node Activation – The pacemaker generates an impulse, causing atrial depolarization (P wave).
Atrioventricular (AV) Node Delay – The impulse slows to allow ventricular filling (PR interval).
Ventricular Depolarization – The impulse rapidly travels down the Bundle of His and Purkinje fibers, triggering ventricular contraction (seen as the QRS complex on an ECG).
Ventricular Repolarization – The ventricles recover and relax (T wave).
Diastolic Resting Phase – The heart resets electrically, preparing for the next cycle (TP segment).
Sick sinus syndrome caused by 3 key arrhythmias
Sinus arrest or pause, pause of 3 seconds or more without atrial activity
Sinoatrial exit block, interruption of signal from SA node to atria
Tachy-brady syndrome, bradycardia alternating with SVT
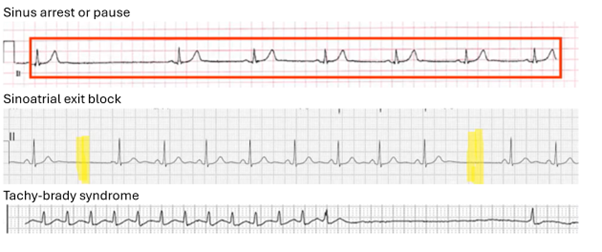
What are the four types of Rhythms and where they originate
Sinus Rhythms . SA Node
Atrial Rhythms. Atria
Junctional Rhythms AV Node or hiss bundle
Ventricular Rhythms Ventricles
Sinus Rhythms
types and characteristics
Normal Sinus Rhythm (NSR): 60–100 bpm, regular, normal P waves before each QRS.
Sinus Bradycardia: <60 bpm, regular rhythm.
Sinus Tachycardia: >100 bpm, regular rhythm.
Sinus Arrhythmia: Irregular rhythm, varies with respiration.
Sinus Pause/Arrest: Sudden failure of SA node to fire, causing missed beats.
Sinoatrial Exit Block: SA node fires but impulse fails to exit, causing dropped beats.
Atrial Rhythms
types and characteristics
Premature Atrial Complexes (PACs): Early P waves with abnormal morphology.
Atrial Tachycardia: 150–250 bpm, abnormal P waves.
Multifocal Atrial Tachycardia (MAT): Irregular rhythm, multiple P wave morphologies, often in COPD.
Atrial Flutter: Sawtooth P waves (F waves), atrial rate ~250–350 bpm, typically 2:1 conduction.
Atrial Fibrillation (AFib): Irregularly irregular rhythm, no distinct P waves, atrial rate >350 bpm.
Supraventricular Tachycardia (SVT): Narrow complex tachycardia >150 bpm, often sudden onset/termination.
Wolff-Parkinson-White Syndrome (WPW): Pre-excitation syndrome with short PR interval, delta wave, and wide QRS, can trigger SVT or AFib.
Junctional Rhythms
types and characteristics
Premature Junctional Complexes (PJCs): Early beats, no or inverted P wave.
Junctional Escape Rhythm: 40–60 bpm, narrow QRS, absent or inverted P waves.
Accelerated Junctional Rhythm: 60–100 bpm, same characteristics as junctional escape rhythm.
Junctional Tachycardia: >100 bpm, absent or inverted P waves, narrow QRS
Atrioventricular Nodal Reentrant Tachycardia (AVNRT): Most common type of SVT, caused by a reentry circuit within the AV node, producing a regular, narrow-complex tachycardia (140–250 bpm).
Atrioventricular Reciprocating Tachycardia (AVRT): A reentrant tachycardia involving an accessory pathway (e.g., WPW Syndrome), leading to narrow or wide QRS tachycardia depending on conduction direction.
Ventricular Rhythms
types and characteristics
Premature Ventricular Complexes (PVCs): Early, wide QRS, no preceding P wave.
Idioventricular Rhythm: 20–40 bpm, wide QRS, no P waves.
Accelerated Idioventricular Rhythm (AIVR): 40–100 bpm, wide QRS, no P waves.
Ventricular Tachycardia (VT): >100 bpm, wide QRS, no P waves.
Torsades de Pointes: Polymorphic VT with prolonged QT, twisting QRS.
Ventricular Fibrillation (VF): Chaotic electrical activity, no cardiac output.

what’s the rhythm
what’s the cause/mechanism
Atrial fibrillation
Multiple chaotic electrical impulses in the atria
what causes AF
Instead of a single signal from the SA node, multiple random signals fire across the atria, making them quiver instead of pumping properly.
Conditions that enlarge or strain the atria can trigger AF.
hings like heart disease, high blood pressure, alcohol, or thyroid issues can disrupt normal heart rhythms.

what’s the rhythm
what’s the cause/mechanism
Atrial Flutter with 4:1 conduction ( rate aproxx 75)
Reentrant circuit in the atria
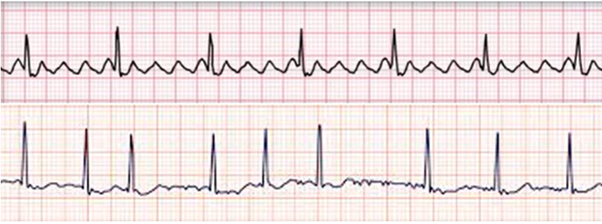
Top first then bottom
what’s the rhythm
what’s the cause/mechanism
Atrial Flutter
Reentrant circuit in the atria
Atrial fibrillation
Multiple chaotic electrical impulses in the atria
mechanism for Premature Atrial Complex (PAC)
Area of the atria has increased automaticity and fires an early electrical impulse before the SA node has a chance to fire.
what are some characteristics of junctional rhythms
what are some ECG characteristics/appearances
Normally 40-60 BPM
Junctional rhythms that are over 60 are accelerated rhythms
There are normally no p wavers
QRS should be normal
Appearance on an ECG
· No P waves
· Inverted P waves
· P waves after the QRS
What are the 4 valves in the heart?
Tricuspid Valve – Between the right atrium and right ventricle
Pulmonary Valve – Between the right ventricle and pulmonary arteries
Aortic Valve – Between the left ventricle and aorta
Mitral (Bicuspid) Valve – Between the left atrium and left ventricle
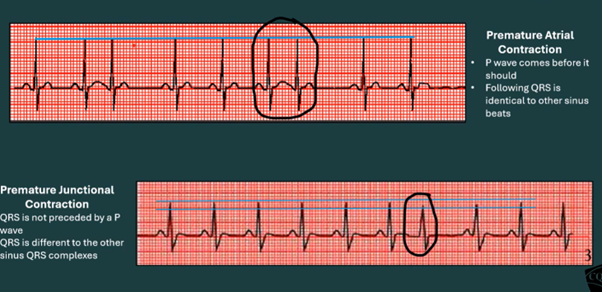
How to tell PAC and PJC apart
PAC: Has a visible, abnormal P wave before the QRS.
PJC: Either has no visible P wave, an inverted P wave, or a P wave buried in the QRS due to the impulse coming from the AV node.
The QRS from the PJS will often be lower in amplitude than the other QRSs
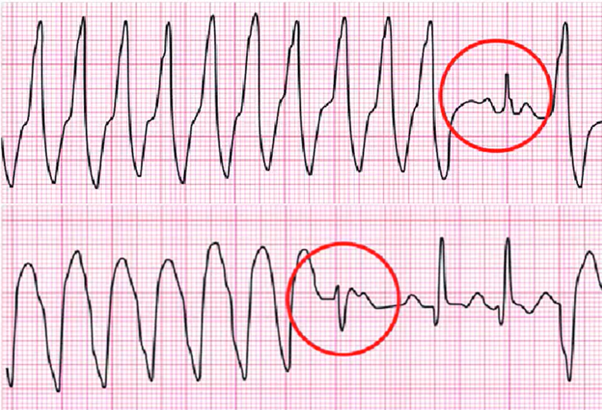
What is this? Top and bottom
Top Capture beat
A occasional atrial beat has reached the ventricles in between the ventricular beats in VT
Bottom Fusion beat
A occasional atrial beat has reached the ventricles in between the ventricular beats in VT but the atrial beat and ventricular beat happen at the same time.

What’s the rhythm?
what’s the mechanism?
How is it managed,
Torsades de Pointes ("Tor-SAHD duh PWAHNT) a form of VT
Inhibition of potassium current causing prolonged repolarisation, then a ectopic (early or extra heartbeat) occurs this causes Torsades de Pointes.
If pulseless or severe hypotension defibrillation and ACLS, then potassium or magnesium supplementation (IV potassium or magnesium sulfate)
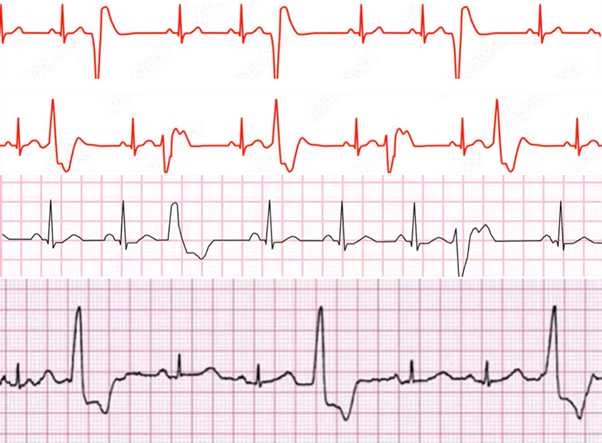
From top to bottom name these rhythms
Trigemini, Unifocal PVC
Bigeminy, Unifocal PVC
Trigemini , Multifocal PVC
Trigemini , Unifocal PVC
what are the three mechanism for SVT
Re-entrant (Most Common - ~90%)
Automaticity (Ectopic Focus - ~10%)
Triggered Activity (Rare)
what effect does calcium, magnesium and potassium have on heart automaticity
Calcium (Ca²⁺)
· Hypercalcemia: Can increase excitability and shorten repolarization
· Hypocalcemia: Reduces automaticity, slowing conduction
Potassium (K⁺)
· Hyperkalemia: Depresses automaticity
· Hypokalemia: Increases automaticity
Magnesium (Mg²⁺)
· Hypomagnesemia: Increases excitability and risk of torsades de pointes
· Hypermagnesemia: Decreases automaticity, leading to bradycardia
BBB causes L and R
LBBB is more often linked to left-sided heart conditions, such as hypertension, cardiomyopathy, ischemic heart disease, and aortic valve disease.
RBBB is commonly associated with right heart strain, pulmonary diseases, congenital heart disease, and ischemic events affecting the right coronary artery.
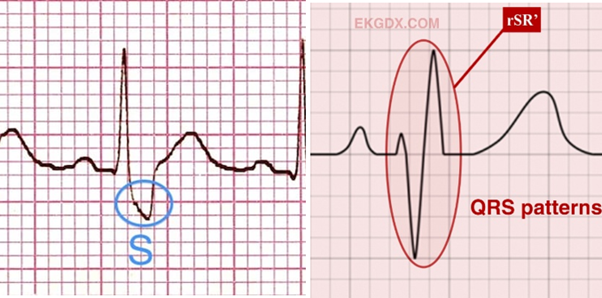
RBBB criteria
QRS > 120ms
rSR pattern in V1-V3 occurs because the right ventricle depolarizes late due to delayed conduction through the right bundle, causing a second R wave (R') as the right ventricle is activated after the left ventricle
Wide slurred S wave in lateral leads delayed right ventricular activation creates an electrical vector directed away from the lateral leads, resulting in a prolonged and widened S
ST depression & T wave inversion in right sided chest leads (maybe) from abnormal repolarisation of the R venticle.
LBBB criteria
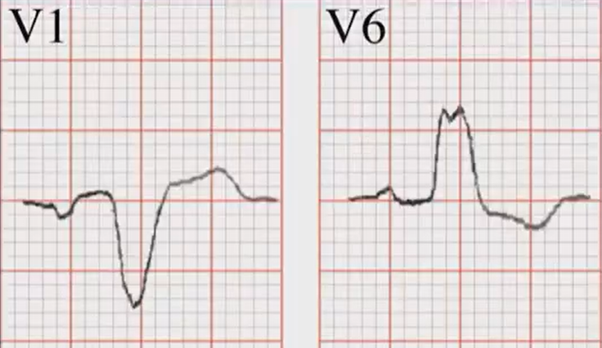
QRS > 120ms
No Q waves in lateral leads Normally, small Q waves appear in the lateral leads due to early left-to-right depolarization of the interventricular septum. In LBBB, the normal conduction through the left bundle is blocked, so the septum is depolarized abnormally from right to left via the right bundle branch.
Wide, broad, monophasic, notched R waves in lateral leads
Deep, broad S waves in leads (V1-V3)
Poor r wave progression
ST elevation in V1-V3 because of abnormal repolarization
ST depression in lateral leads because of abnormal repolarization
non concordant T waves in all leads because of abnormal repolarization

Pacemakers
Two types
explain different chambering
What do ventricular paced rhythms look like
what the the best leads to see the pacing spikes
what is occurring in the image
Fixed, always fires
Demand sensing, kick in when the heart rate drops below 60-70
Pacemakers can chamber just the atria the ventricles or the atria and ventricles
LBBB
V3-V6
Failure to capture of a ventricular chambered pacemaker
STEMI Characteristics
T Waves:
Hyperacute T waves (early stage) – taller than 50% of the QRS complex.
Inverted T waves (later stage) – occur as the infarct evolves.
ST-Segment:
ST elevation in at least two contiguous leads indicates transmural ischemia.
Reciprocal ST depression supports STEMI diagnosis (except in wide QRS, where LBBB must be ruled out).
ST-elevation thresholds:
≥1 mm in at least two contiguous limb leads.
≥2 mm in at least two contiguous precordial leads.
≥1.5 mm in V2-V3 (women).
≥2 mm in V2-V3 (men ≥40 years old).
≥2.5 mm in V2-V3 (men <40 years old).
ST depression ≥0.5 mm in two contiguous leads suggests myocardial ischemia.
Q Waves:
Pathological Q waves (≥25% of the R wave height or ≥1 small square wide) indicate late-stage infarction.
STEMI Criteria
ST-elevation thresholds:
≥1 mm in at least two contiguous limb leads.
≥2 mm in at least two contiguous precordial leads.
≥1.5 mm in V2-V3 (women).
≥2 mm in V2-V3 (men ≥40 years old).
≥2.5 mm in V2-V3 (men <40 years old).
the absence of wide QRS
4 stages of STEMI evolution
Hyperacute T waves (minuets to hours)
S-T elevation (0-12 hours)
Pathological Q waves (1-12 hours)
S-T elevation with T wave inversions (2-5 days)
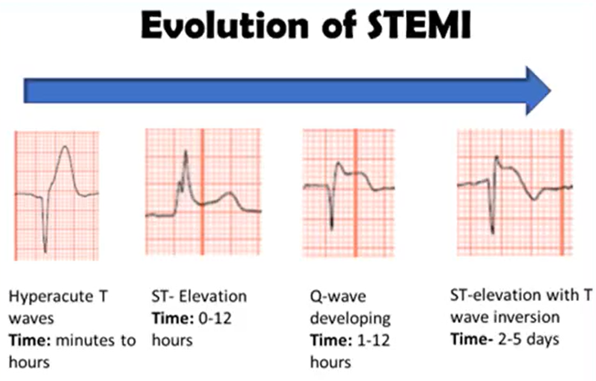

What is occurring here, what ae the stages>?
Progression of STEMI
Hyperacute T waves (minuets to hours)
S-T elevation (0-12 hours form) (fully establisher 12-24 hours)
Pathological Q waves (1-12 hours)
S-T elevation with T wave inversions (2-5 days)
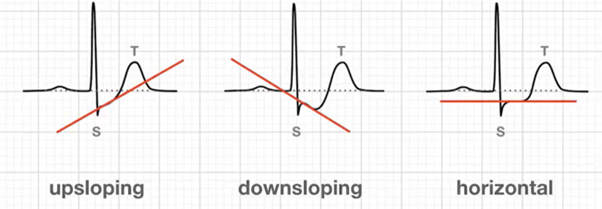
what is the significance of each of these 3 findings
Upsloping ST depression → Less specific for ischemia, can be normal.
Down sloping ST depression → Strongly suggests ischemia, high-risk finding.
Horizontal ST depression → Likely ischemic, seen in ACS and NSTEMI.
What is ischemia, and which part of the heart muscle does it affect first?
What is transmural ischemia, and how does it differ from regular ischemia?
What is infarction, and what causes it?
How does ATP depletion affect potassium ion movement in cardiomyocytes?
What causes ST elevation on an ECG, and what does it indicate?
What ECG change is seen in subendocardial ischemia, and why does it occur?
Ischemia is a reduction in blood flow leading to oxygen deprivation, primarily affecting the subendocardium first. the cells cant product enough ATP.
Transmural ischemia is a complete loss of blood supply affecting the entire thickness of the myocardium.
Infarction is the irreversible cell death of heart tissue due to prolonged ischemia.
The leakage of potassium ions due to ATP depletion leads to early depolarization of cardiomyocytes and an increase in baseline potential.
ST elevation occurs if transmural ischemia (full thickness of the myocardium) is present, as injured cells remain partially depolarized at rest, shifting baseline potentials and leading to ST elevation in affected leads.
ST depression occurs in subendocardial ischemia (inner layer affected but not full thickness) due to repolarization changes that shift the ST segment downward.
Causes of S-T elevation (ELEVATION)
Electrolytes: hyperkalaemia
Left Bundle Branch Block
Early Repolarisation
Ventricular Hypertrophy (left)
Aneurysm (ventricular)
Thailand (Brugada Syndrome)
Inflammation (Pericarditis)
Osborn J waves (hypothermia)
Non-ischemic Vasospasm