stats psych 1-4 + z-scores
1/50
There's no tags or description
Looks like no tags are added yet.
Name | Mastery | Learn | Test | Matching | Spaced |
|---|
No study sessions yet.
51 Terms
descriptive stats
simple statistics that describe situation
inferential stats
generalizing from a sample to a population
population
complete collection of observations or potential observations
sample
smaller collection of actual observations drawn from a population
random sampling
a sample should be randomly selected from a population in order to increase the likelihood that the sample accurately represents the population (drawing from a hat)
convenience sampling
students usually fall into WIERD category
random assignment
Random assignment signifies that each person has an equal chance of being assigned to any group in an experiment
types of data
qualitative, ranked, quantitative
Qualitative
a set of observations where any single observation is a word, letter, or numerical code that represents a class or category (categories/labels)
ranked
A set of observations where any single observation is a number that indicates relative standing
quantitative
A set of observations where any single observation is a number that represents an amount or a count (numerical values/intervals)
levels of measurement
nominal, ordinal, interval/ratio, nonphysical
nominal
Words, letters, or numerical codes of qualitative data that reflect differences in kind based on classification.
example: eye color
ordinal
Relative standing of ranked data that reflects differences in degree based on order
example: rank in contest
interval/ratio
these should have a true zero and equal intervals
example: depression levels
types of variables
discrete, continuous, approximate, idependent, dependent
discrete variable
A variable that consists of isolated numbers separated by gaps
example: # of siblings
continuous
A variable that consists of numbers whose values, at least in theory, have no restrictions
example: weight
approximate
rounding
independent variable
treatment manipulated by the investigator.
dependent variable
variable is believed to have been influenced by the independent variable
confounds
An uncontrolled variable that compromises the interpretation of a study.
frequency distribution
A collection of observations produced by sorting observations into classes and showing their frequency (denoted by the letter f) of occurrence in each class
- can be ungrouped or grouped
guidelines
req
- Each observation should be included in one, and only one, class.
List all classes, even those with zero frequencies.
All classes should have equal intervals.
Book doesn’t mention – List in order from most to least
So “1” would be at the bottom and “10” would be at the top
optional
- All classes should have both an upper boundary and a lower boundary.
Select the class interval from convenient numbers, such as 1, 2, 3, … 10, particularly 5 and 10 or multiples of 5 and 10.
The lower boundary of each class interval should be a multiple of the class interval (130 is divisible by 10 which is the class interval).
Aim for a total of approximately 10 classes.
constructing frequency distributions
Range (245-133 is 112)
Class interval (112/10 is 11.2)
Round (11.2 to 10)
Lowest Class begin and end (not 133 instead 130)
Work upward (lowest number on bottom)
Tally then replace with f
Headings
relative frequency distributions
A frequency distribution showing the frequency of each class as a fraction of the total frequency for the entire distribution
cumulative frequency distributions
a frequency distribution showing the total number of observations in each class and all lower-ranked classes
percentile ranks
Percentage of scores in the entire distribution with equal or smaller values than that score
positively skewed distribution
A distribution that includes a few extreme observations in the positive direction (to the right of the majority of observations)
If mean is bigger than median, it's positively skewed
negatively skewed distribution
A distribution that includes a few extreme observations in the negative direction (to the left of the majority of observations)
If median bigger than mean, it's negatively skewed
rounding
Almost all stats in this class will be rounded to two decimal places
.054 will round to .05
.055 will round to .06
.0545 will round to .05
p values
p > .05 - accept the null
p < .05 - reject the null
class interval
a defined range of numerical values within a dataset used to group data points into categories
leading zero
If the statistic can be greater than 1, use a leading 0 (0.24 in)
If the statistic cannot be greater than 1, do not use a leading 0 (p = .04)"
mode
the value of the most recent score (appears most often)
bimodal
Describes any distribution with two obvious peaks
modes have to be exact same?
median
the middle value when observations are ordered from least to most
formula: (n+1) / 2
mean
The mean is found by adding all scores and then dividing by the number of scores
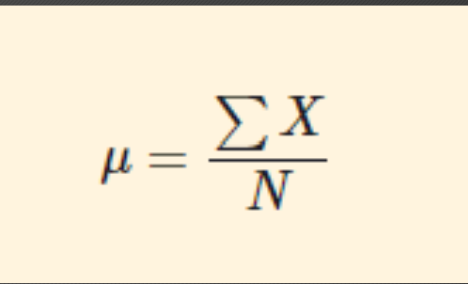
population
A complete set of scores
“mu” equals the sum of the variable X and is divided by the population size which is N
sample
A subset of scores
X bar equals the sum of the variable X and is divided by the sample size which is n
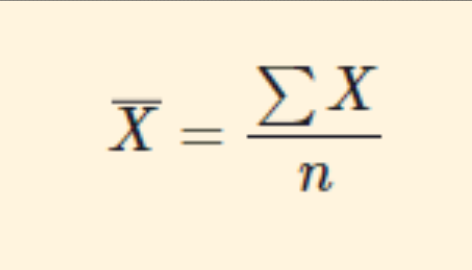
sample size (n)
The total number of scores in the sample
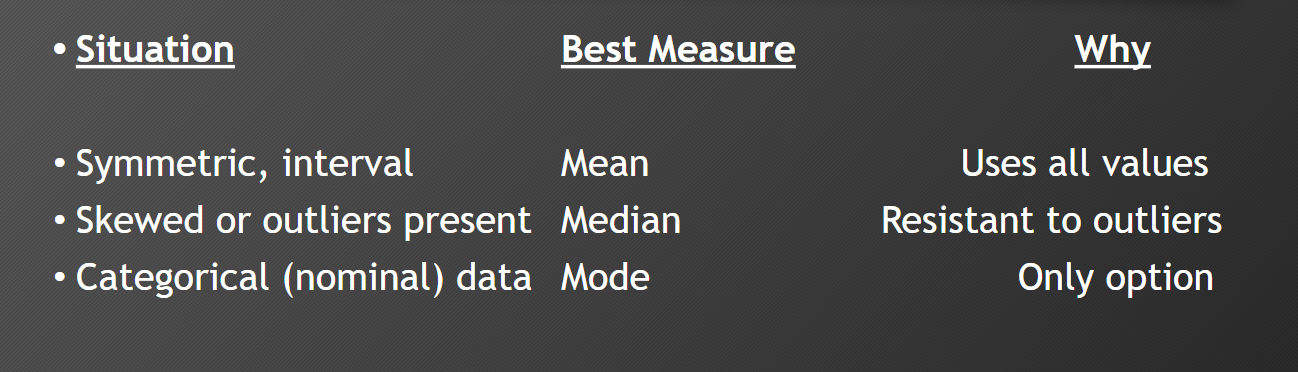
not skewed
mean median mode will be similar
skewed (not symmetric)
mean is sensitive to outliers
FREQUENCY DISTRIBUTIONS FOR QUALITATIVE (NOMINAL) DATA
Mean cannot be used with qualitative data.
The median can be used whenever it is possible to order qualitative data from least to most because the level of measurement is ordinal
measures of variability
Descriptions of the amount by which scores are dispersed or scattered in a distribution
Mean is a measure of position
SD is a measure of distance
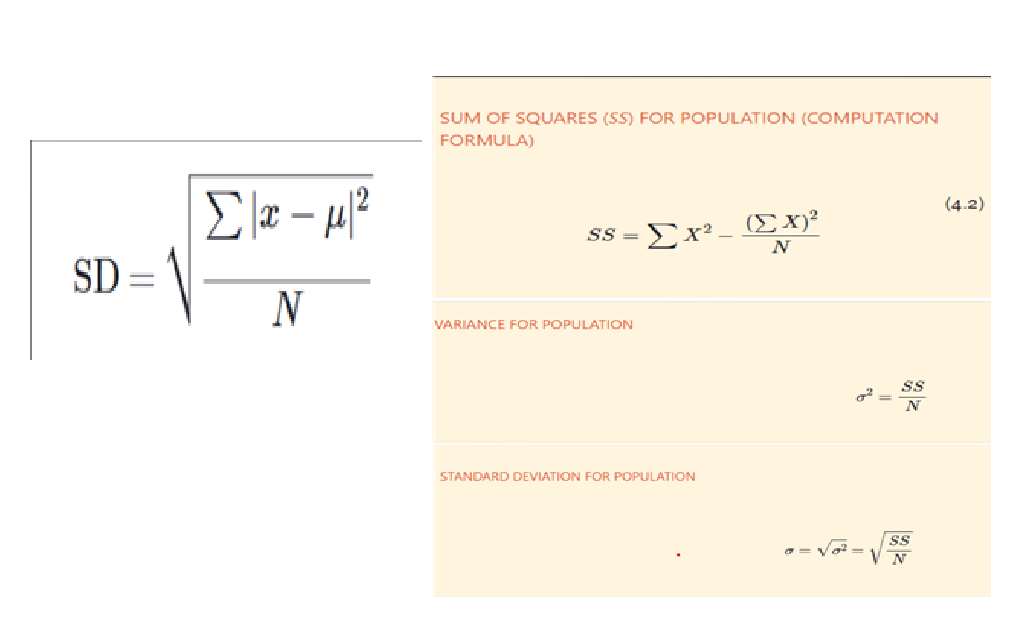
standard deviation
A rough measure of the average (or standard) amount by which scores deviate on either side of their mean
Mean of deviations not useful
The sum of all scores, expressed as positive and negative deviations from the mean, always equals zero
degrees of freedom (df)
The number of values free to vary, given one or more mathematical restrictions
The number of scores that are free to vary once the mean is fixed
methods for standard deviation
First method is more intuitive, but can lead to rounding errors (left)
Second method is less intuitive, but more precise (right)
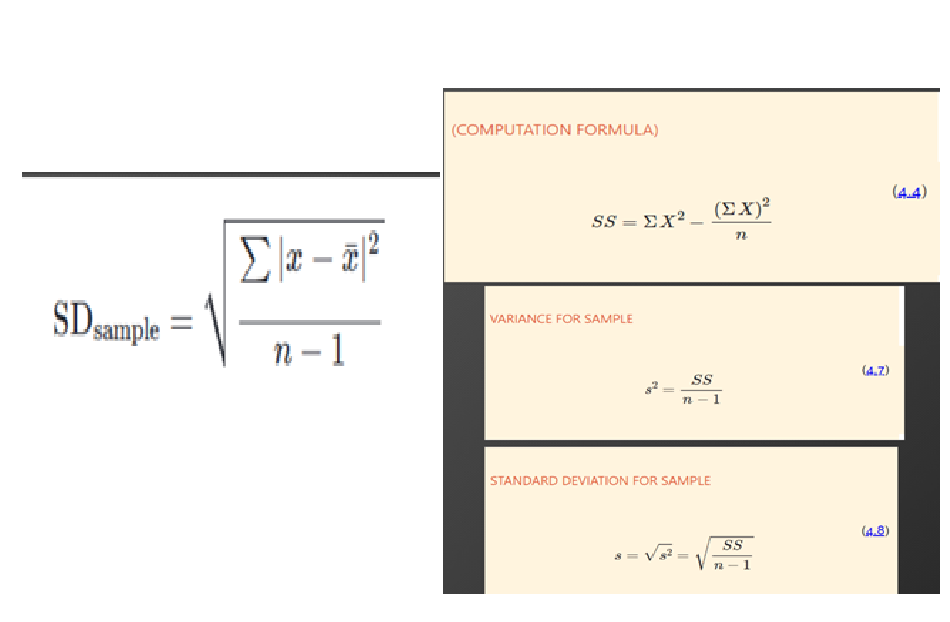
standard deviation for samples
Why n – 1?
Samples underestimate population variance
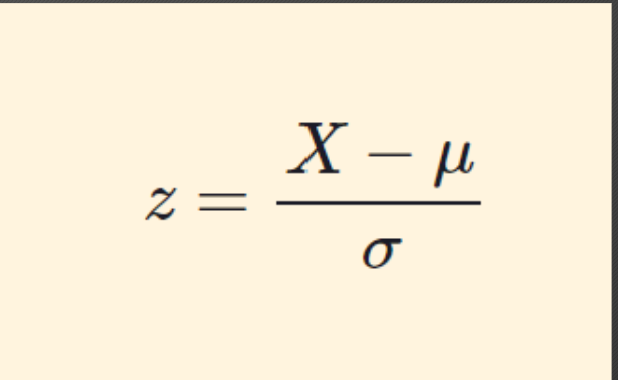
z-score
A unit-free, standardized score that indicates how many standard deviations a score is above or below the mean of its distribution
z-score formula
Our score minus the mean
Divide by the standard deviation