E1: Intro, Biostats
1/86
There's no tags or description
Looks like no tags are added yet.
Name | Mastery | Learn | Test | Matching | Spaced | Call with Kai |
|---|
No analytics yet
Send a link to your students to track their progress
87 Terms
3 elements of EBM (evidence based medicine)
clinical expertise
patient values + pref
best research evidence
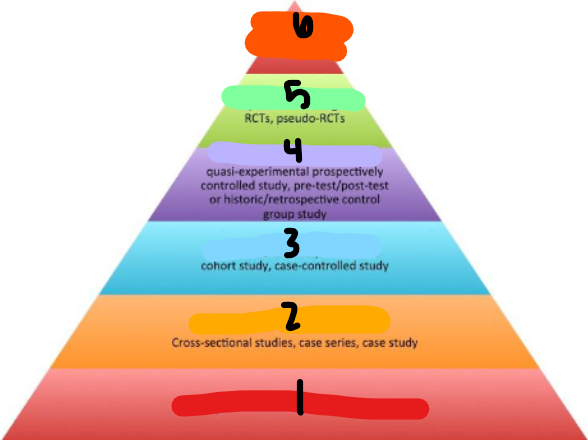
EBM PYRAMID
BG info/expert opinion
observational-descriptive designs
observational-analytic designs
quasi-experimental designs
experimental designs
systemic reviews + meta-analyses
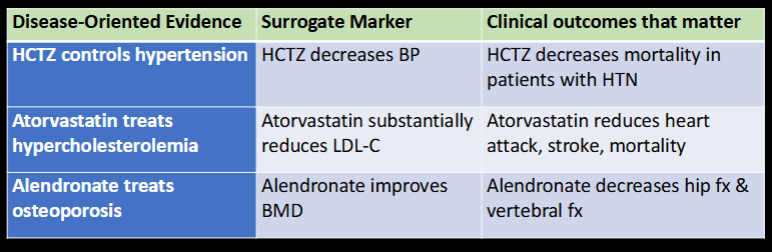
DOE (pathophys/pharmacology/etiology)
vs POEM (clinical endpoints/quality of life)
Which is MORE relevant?
Which uses surrogate markers?
disease-oriented evidence
patient-oriented evidence that matters
POEM
DOE
Label the following as DOE, surrogate marker, or POEM
HCTZ controls HTN
alendronate improves BMD
atorvastatin reduces heart attack, stroke, mortality
alendronate treats osteoporosis
HCTZ decreases mortality in patients with HTN
HCTZ decreases BP
DOE
surrogate
POEM
DOE
POEM
surrogate
What has become the “gold standard” for judging whether a treatment does more good than harm?
Randomized controlled trials
T or F?
Since RCTs are the "gold standard" in EBM, they will always answer the question being asked.
F

_________: a characteristic that is BEING MEASURED
example: math, reading, science
variable
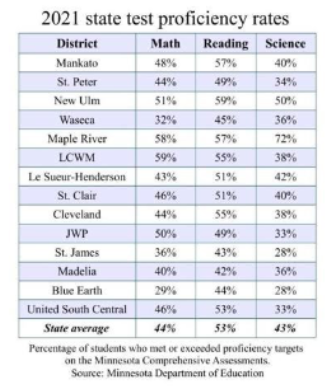
_______: measured VALUES of the variable for each individual member of a study
example: a … of the math proficiency rate is 48% (Mankato)
data
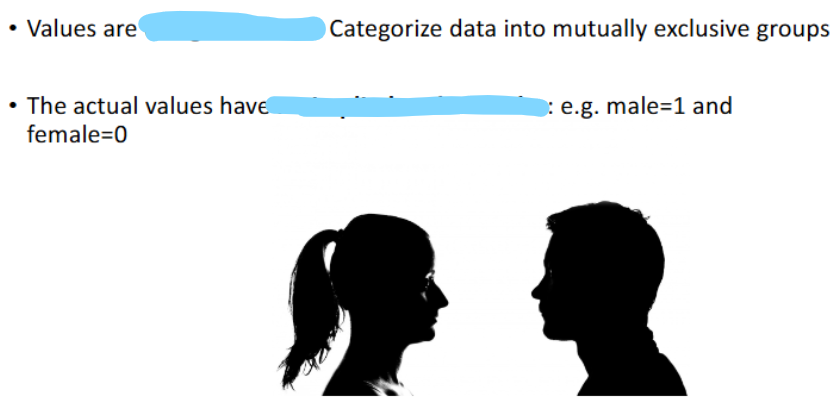
Scales of Measurement of a Variable (1)
______ scales → values are _________
Actual values have _________
nominal → CATEGORIES
no rank/order
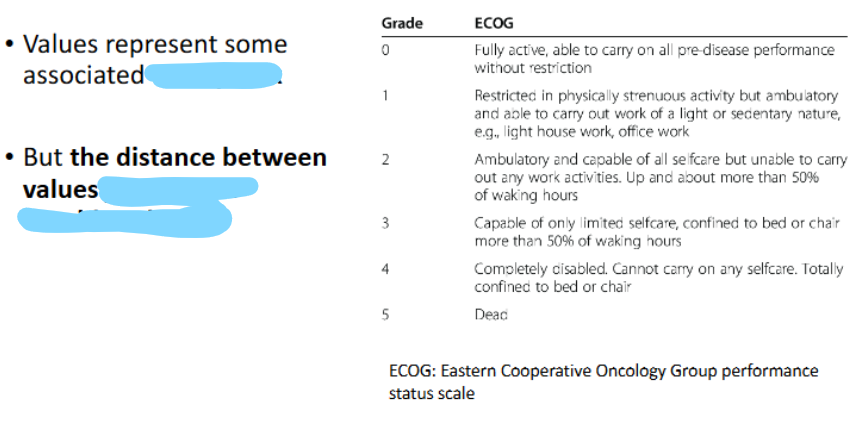
Scales of Measurement of a Variable (2)
______ scales → values represent some associated _______
BUT …
Exs
ordinal → order/rank
increments MAY NOT be equal
pain scale, ECOG performance
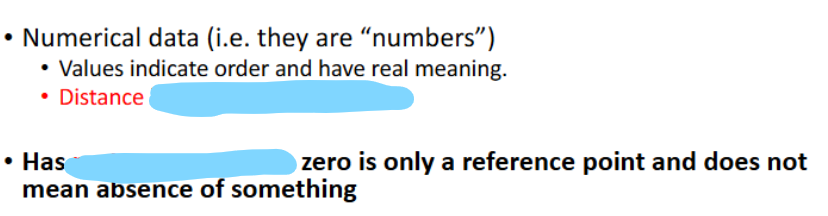
Scales of Measurement of a Variable (3)
_____ scales → ______ data
Distance …
Has _________
Can add, subtract, and but …
interval → numerical
increments ARE EQUAL
NO TRUE ZERO POINT
ratio is meaningless
Scales of Measurement of a Variable (4)
_____ scales → ______ data
Difference between this and interval scale? (3)
Examples → 2
ratio → numerical
increments EQUAL, has TRUE zero point, ratio is meaningful
weight in kg, blood glucose (mg/dL)
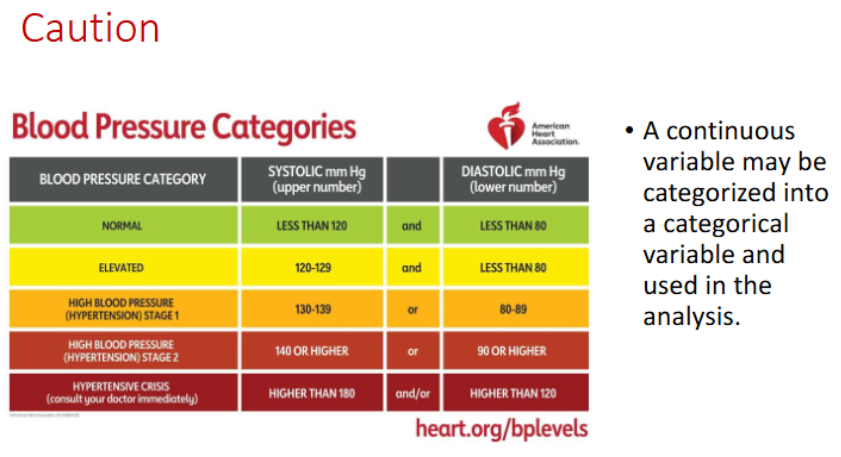
Continuous vs Categorical Variable
continuous = interval/ratio, if ordinal is large
categorical = nominal/ordinal
CATEGORICAL variables may also be referred to as _____
If only has 2 CATEGORIES = _______ or ______
discrete
binary, dichotomous
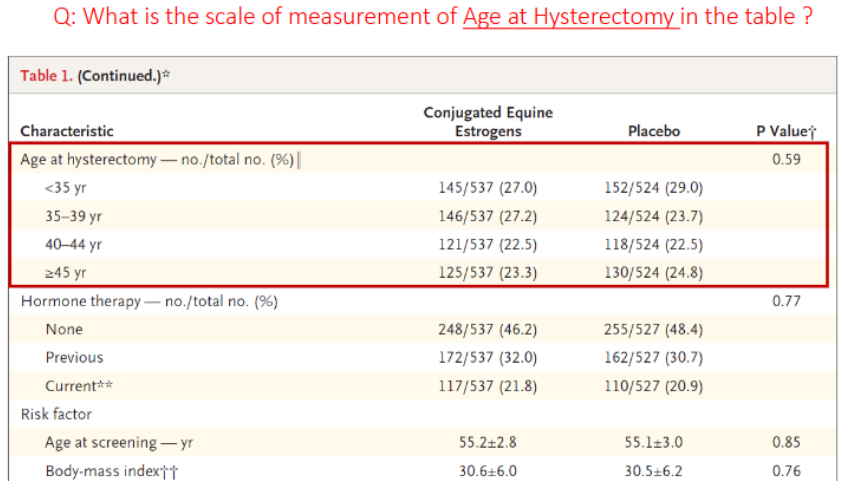
What is the scale of measurement of Age at Hysterectomy in the table?
ordinal
(category + age group ranking)
Describe CONTINUOUS Data
Measures of central location → 3
Measures of spread or variation → 3
mean, median, mode
variance and standard dev, range, inter-quartile range (IQR)
ARITHMETIC MEAN
Most common, the _____
Affected by …
*Most appropriate when data is approximately _____ and _________
avg
extreme values
symmetric, not very skewed
MEDIAN
To calculate, _________ first
If total number (n) is ODD, median is …
If total number (n) is EVEN, median is …
*Is a better measure of central location when data is ________
order the data
middle
avg of middle 2
skewed or ordinal
MODE
Most _______ occurring value
**Most appropriate for _______ data
2 modes =
3 modes =
freq
categorical
bimodal
trimodal
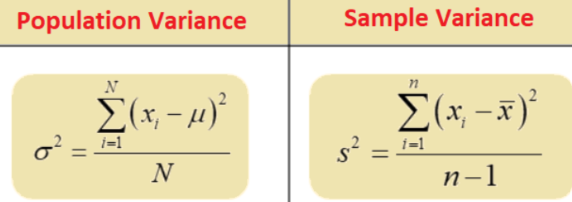
VARIANCE AND STANDARD DEVIATION (SD)
Measures of data __________
VARIANCE:
STANDARD DEVIATION:
variability AROUND the mean
V = SD²
SD = sq root of V
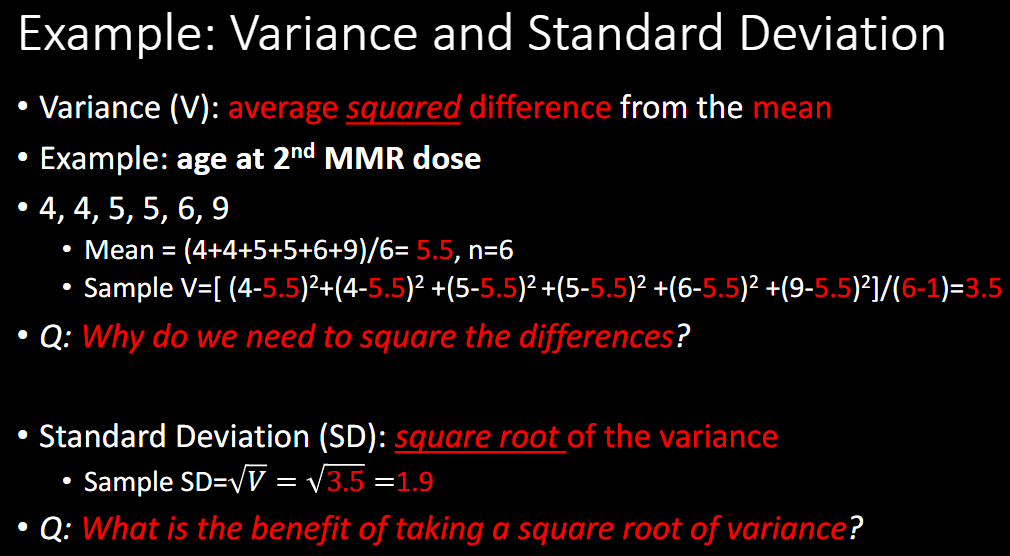
Example: Variance and SD
Age at 2nd MMR dose: 4, 4, 5, 5, 6, 9
n =
mean =
sample V =
SD =
What is the benefit of taking a sq root of variance (SD)?
6
5.5
3.5
1.9
clearer interpretation
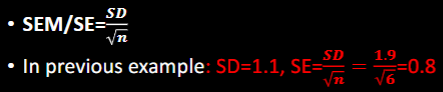
STANDARD ERROR of Mean vs SD
Measures the _____ in an estimated sample mean
Formula (SEM or SE)
Previous Example: 4, 4, 5, 5, 6, 9
SD = 1.9
SE is related to ________
precision
SE = SD/sq root n
0.8
confidence interval
T or F:
Standard Error of the Mean or Standard Error can be used to describe the variability in the data.
F (SD describes variability, SEM/SE describes precision)
RANGE =
max-min
Inter-quartile range (IQR)
1st quartile: 25th percentile
2nd quartile: 50th percentile
3rd quartile: 75th percentile
Median =
IQR =
50th percentile
75th-25th percentile
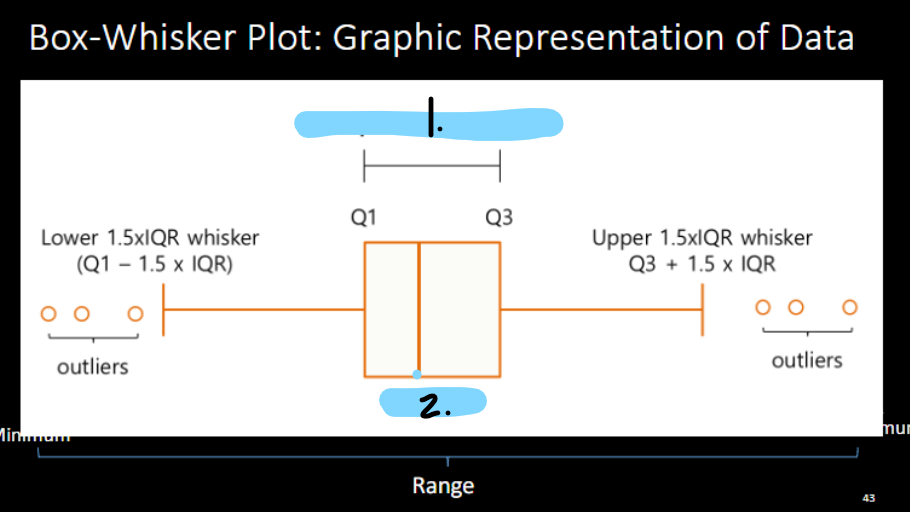
Box-and-Whisker Plot (also called “Boxplot”)
IQR
median
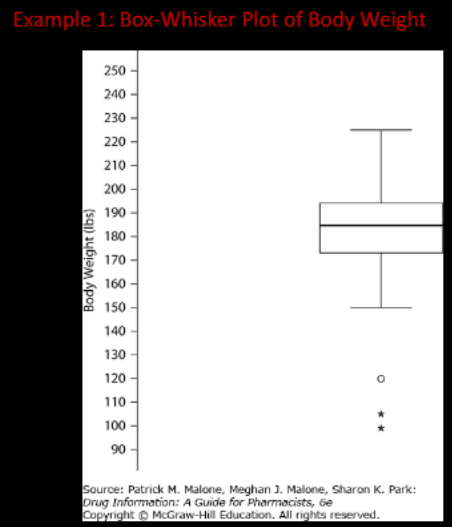
Boxplot of body weight with outliers. Circles represent values 1.5 to 3.0 IQRs from either ends of box, asterisks represent values >3.0 IQRs
What is the maximum BW?
What is the minimum BW?
a. 149
b. 118
c. 98
d. 90
What is the mean BW?
a. 190
b. 185
c. 175
d. can’t be determined
What is the IQR of BW?
a. 130
b. 110
c. 80
d. 20
~225
c
d
d
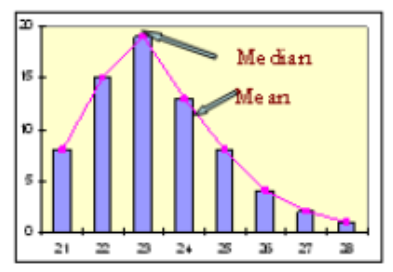
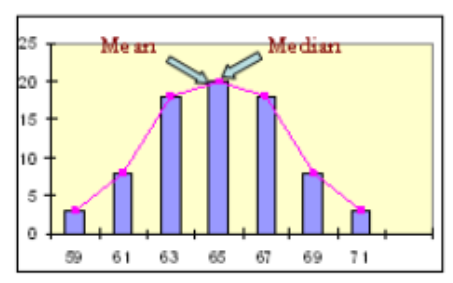
A. Right-skewed (positively skewed)
B. Symmetric
C. left-skewed (negatively skewed)
A (mean>median)
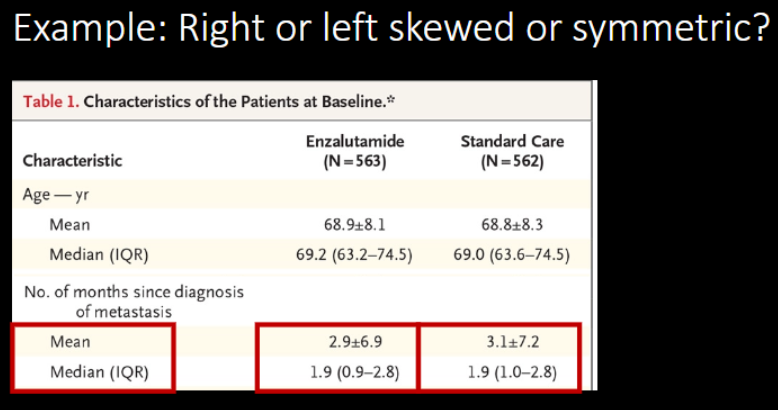
A. Right-skewed (positively skewed)
B. Symmetric
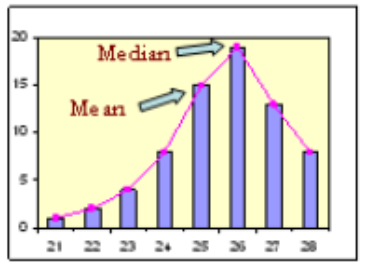
C. left-skewed (negatively skewed)
C (mean<median)
A. Right-skewed (positively skewed)
B. Symmetric
C. left-skewed (negatively skewed)
B (mean=median)
A. Right-skewed (positively skewed)
B. Symmetric
C. left-skewed (negatively skewed)
A
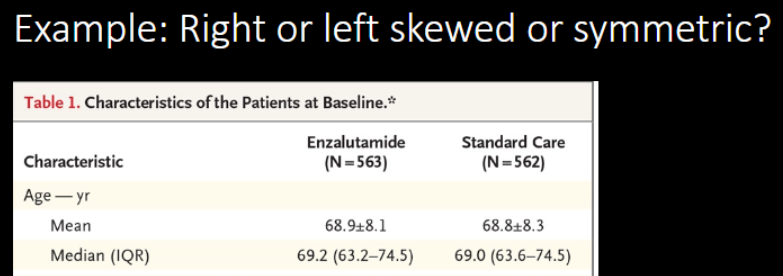
The distribution of the Age is …
A. Right-skewed (positively skewed)
B. Symmetric
C. left-skewed (negatively skewed)
C
CHOICE OF DESCRIPTIVE STATISTICS
If approximately symmetric =
If skewed =
report mean and SD
report median, range/IQR
CHOICE OF STATISTICAL TESTS
If approximately symmetric =
If skewed =
parametric test
nonparametric test
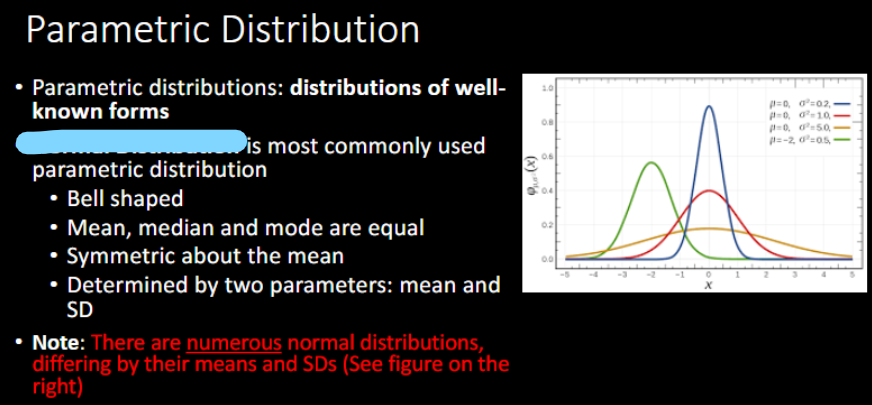
PARAMETRIC TESTS:
Based on _______ that observed data are distributed
_________ is most commonly used parametric distribution
Determined by 2 parameters →
_______ affects the spread of data (flattness)
Which color is the standard normal distribution?
assumption
normal distribution
mean, SD
variance
red → mean = 0, SD = 1
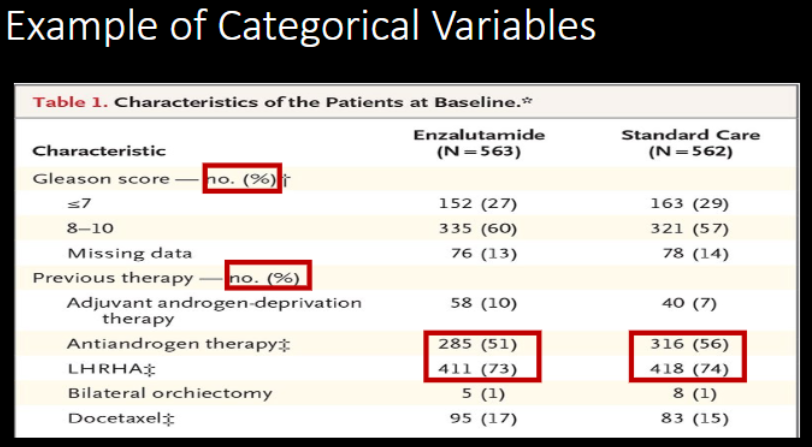
Describe CATEGORICAL Data:
nominal scale → categories, no order
Reported as …
n (%)
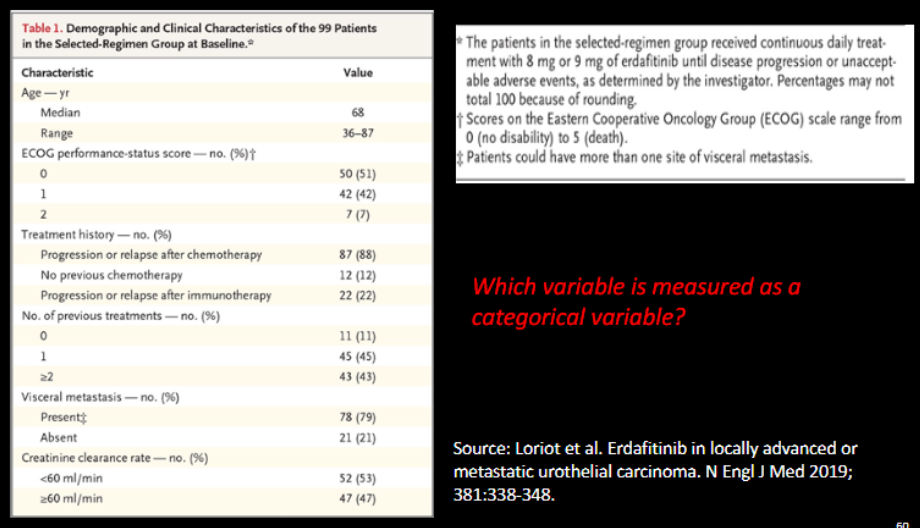
Which variable is measured as categorical variable?
All except age
5 STEPS IN STATISTICAL HYPOTHESIS TESTING:
Step 1: Develop ______ and _________
Step 2: Determine the appropriate _________
Step 3: Determine the ______
Step 4: Calculate the test statistic from the sample data and make decisions →
Step 5: State the ______ in the context of the study
null + alternative hypotheses → null assumed to be true
test statistic
decision rule
reject/fail to reject the null
conclusion
___________ (H0): presumed to be TRUE unless sample data produce overwhelming evidence to prove the contrary
null hypothesis
__________ (Ha): the opposite, or complement of H0
alternative hypothesis
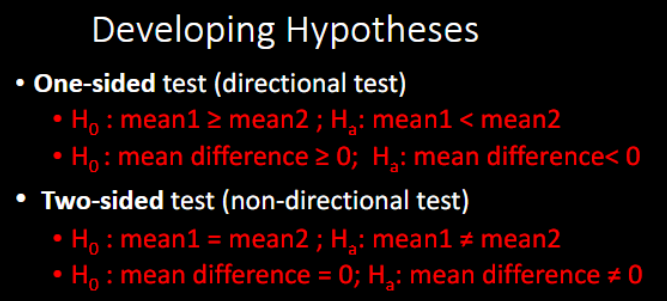
Which type of test is more common?
two-sided
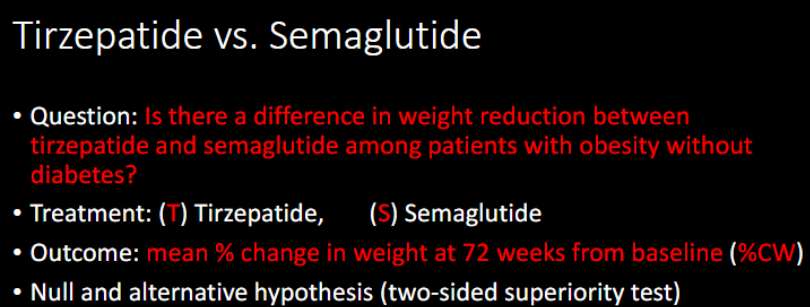
H0 (null)
Ha (alternative)
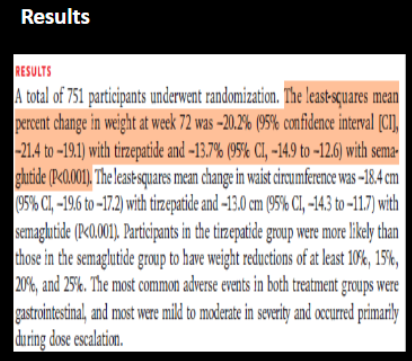
%CW in T = %CW in S
%CW in T does not equal %CW in S
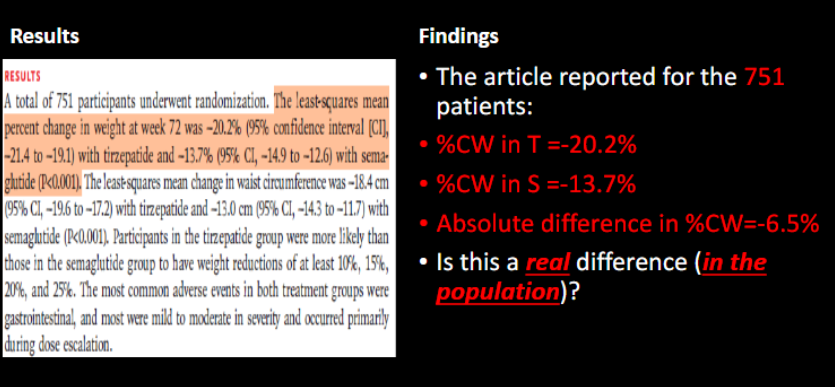
________: the probability of observing the outcome from the study or more extreme values by chance, if the null hypothesis is true.
^ the probability of observing a difference of 6.5% or even larger difference, if in fact there is no difference
P-value
Comparing P-VALUE to ALPHA to determine statistical significance →
alpha = ____ is most common
If …
0.05
P < alpha = statistically significant
Is the result statistically significant?
Reject or fail to reject the null?
yes (P<0.001 is < alpha 0.05)
REJECT
(remember null says there is no diff)
Statistical Significance uses 95% Confidence Intervals (CI)
______ is most common and is equivalent to a _________ test of ________
FOR TESTING MEANS → 95% CI contains … indicates …
FOR TESTING RATIOS → 95% CI contains … indicates …
95% CI, two-sided, no diff at alpha = 0.05
contain 0 = NO diff
contain 1 = NO diff
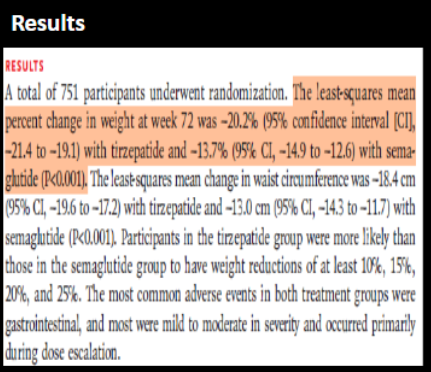
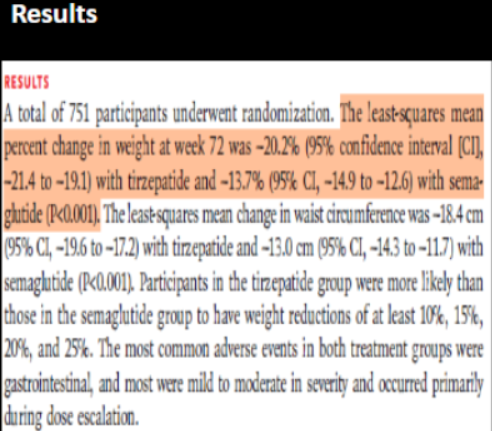
Step 1: statistical significance
For tirzepatide, is there a statistically significant change in weight at 72 weeks from baseline?
For semaglutide, is there a statistically significant change in weight at 72 weeks from baseline?
Step 2: if statistically signficant, interpret the direction
In both groups, there are statistically significant ________ in weight change from baseline to 72 weeks
yes (does NOT contain 0 → 95% CI -21.4 to -19.1)
yes (does NOT contain 0 → 95% CI -14.9 to -12.6)
reduction
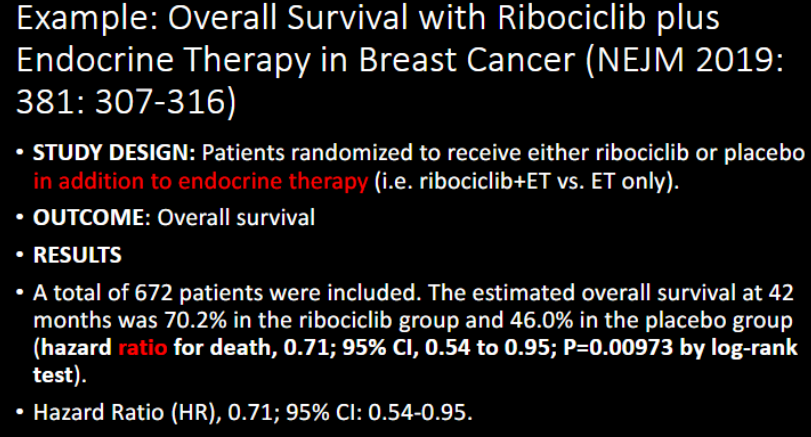
Hazard Ratio (HR), 0.71; 95% CI: 0.54-0.95.
Does Ribociclib plus Endocrine Therapy improve survival in breast cancer patients (compared to Endocrine Therapy alone)? (Yes/No)
Direction? (if statistically significant)
Magnitude of effect
Yes (does NOT contain 1, also P<0.05)
-risk of death (0.71<1), +survival
29% ((1-0.71)x100=29)
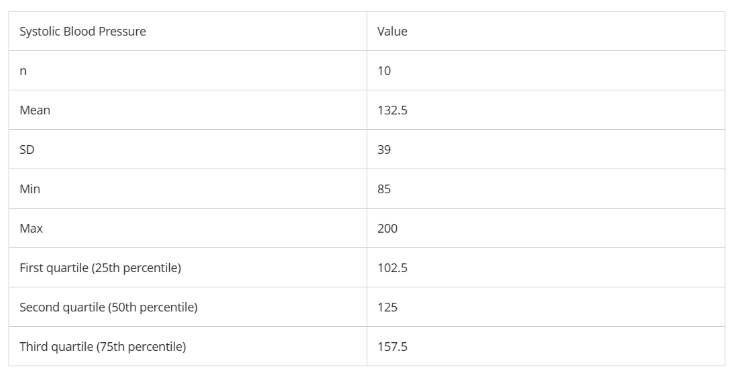
What is the variance?
What is the range?
What is IQR?
What is the median?
1521
115
55
125
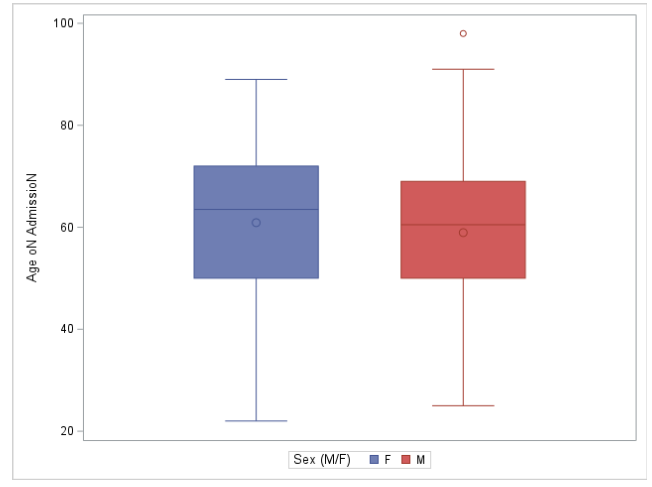
What is the maximum age at admission among males? (Circle in the Box is the mean.)
a. 98
b. 90
c. 87
d. 72
Based on information in the figure, which description about this study sample patients is correct? (Circle in the Box is the mean.)
a. Distribution of age at admission among males is right-skewed
b. The median age at admission is higher among females than males
c. At least 75% of males were 50 or under at admission
d. The IQR of age at admission is about 70 in females
A
B
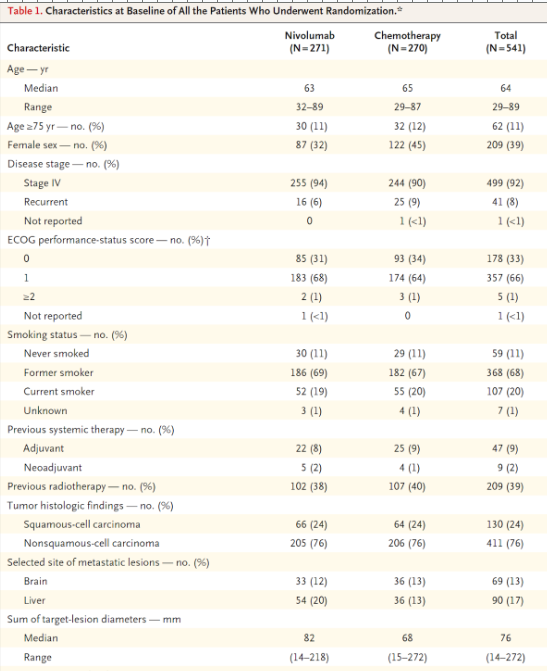
Match with ordinal, nominal, or interval/ratio
Sum of largest-lesion diameters - mm:
Smoking status:
ECOG performance status:
Previous radiotherapy:
interval/ratio
nominal
ordinal
nominal
A randomized, placebo-controlled trial enrolled infants 1 to 24 months of age who were hospitalized with respiratory syncytial virus (RSV) infection. Infants were randomized to receive Ziresovir or placebo. At Day 3, the mean (95% CI) difference in the respiratory rate between Ziresovir vs. placebo was - 0.18 (- 0.32, - 0.04). Which is a correct conclusion from this finding?
A. Ziresovir reduces respiratory rate in hospitalized infants 1 to 24 months of age with RSV
B. Ziresovir increases respiratory rate in hospitalized infants 1 to 24 months of age with RSV
C. Ziresovir has no statistically significant effect on respiratory rate in hospitalized infants 1 to 24 months of age with RSV
A
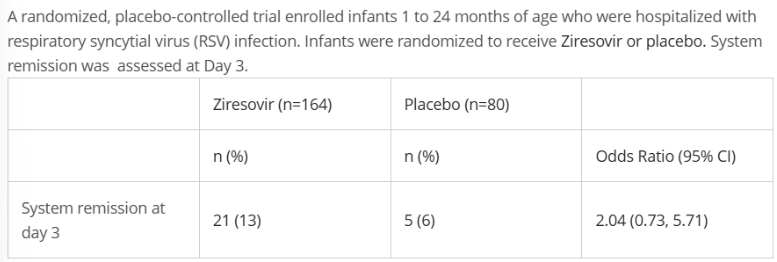
Which is a correct conclusion from this finding?
A. Ziresovir reduces system remission at Day 3 in hospitalized infants 1 to 24 months of age with RSV
B. Ziresovir increases system remission at Day 3 in hospitalized infants 1 to 24 months of age with RSV
C. Ziresovir has no statistically significant effect on system remission in hospitalized infants 1 to 24 months of age with RSV
C
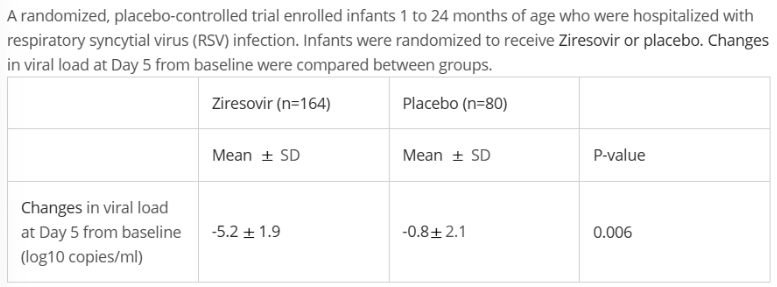
Which is a correct conclusion from this finding?
A. Ziresovir had a larger reduction in RSV viral load at Day 5 than placebo in hospitalized infants 1 to 24 months of age with RSV
B. Ziresovir had a smaller reduction in RSV viral load at Day 5 than placebo in hospitalized infants 1 to 24 months of age with RSV
C. Ziresovir had no statistically significant effect on RSV viral load in hospitalized infants 1 to 24 months of age with RSV
A
Why do we need sample size calculation or power analysis?
Mainly to ensure the study will have sufficient sample size to detect a ____________ if exists
Most often, power is set at _______
true effect
80% or higher
Reject H0 =
Fail to reject H0 =
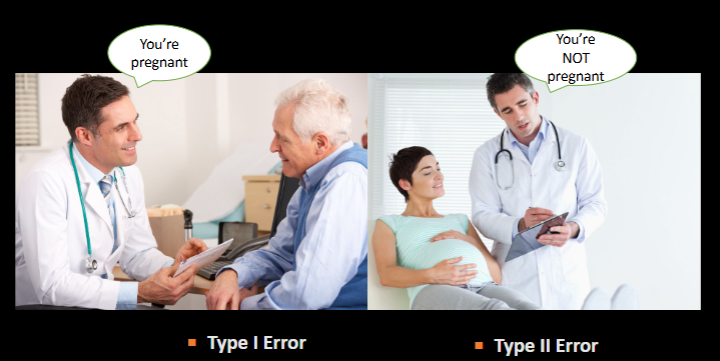
Type I (α)
vs Type II (β) ERROR
diff
NO diff
Type I → H0 is wrongly rejected (false positive) → says there is a diff, but there isnt
Type II → false H0 is wrongly NOT rejected (false negative) → says there is no diff, but there is
The MAXIMUM allowable probability of making a Type I error is denoted as α (alpha) and is referred to as the level of the test, or __________.
Often set at α = ____
significance level, 0.05
The maximum allowable probability of making a Type II error is denoted as β (beta)
_______ is the _______ of the test
1-B, power (0.8 or higher)
ERRORS IN HYPOTHESIS TESTING
Type I error and Type II error are ________ related
The relationship is …
Type I error is ______ related to power
Type II error is ______ related to power
inversely
NOT 1:1
positively
negatively
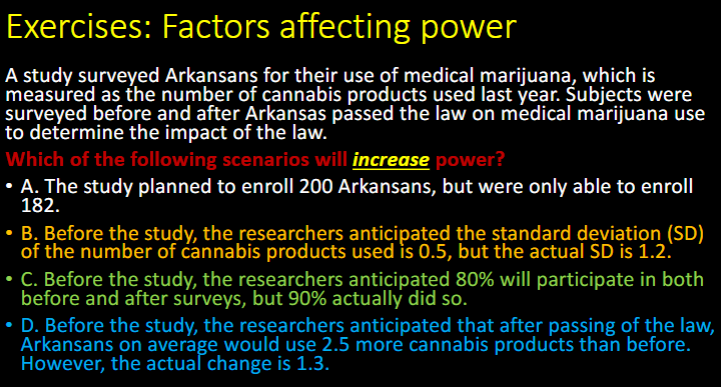
Factors Affecting POWER → 5
effect size
population variations in outcome
type I error (significance level)
sample size
study design
The effect size tells us how large is the difference in study outcome between 2 treatments under comparison
Effect size and power are __________ associated
positively
a between-group difference in the percent change in body weight of 3 percentage points
What is the anticipated effect size?
What is the actual effect size?
3%
6.5%
Variation of the outcome and power are _________ associated
negatively
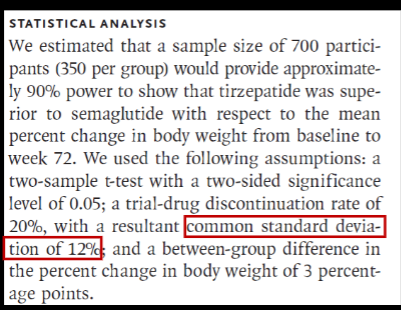
What is the anticipated variation?
12%
Sample size (n) and power are ________ associated
positively
Factors affecting power: summary
Effect size
Population variations in the outcome (σ, standard deviation)
Type I error (α) or significance level
Sample size (n)
Study design
+
-
+
+
depends
C
(A. smaller n = smaller power
B. larger variation = smaller power
C. larger n = LARGER power
D. lower effect size = smaller power)
A study of 20 patients at UAMS found no difference in glucose control between 2 diabetic drugs. What could be a potential error? (Choose all that apply.)
A. Type 1 error
B. False negative error
C. False positive error
D. Type 2 error
E. No potential error
B, D
(reject H0 = diff, fail to reject = no diff
type I = H0 is wrongly rejected = u say there is a diff but there is not
type II = H0 is wrongly failed to reject = u say there is no diff but there is)
Which statement is INCORRECT? (Choose all that apply.)
A. Type 1 and Type 2 errors are inversely related.
B. Type 1 and power are inversely related.
C. Type 2 error is when there is no difference, but you conclude there is a difference.
D. Population variation in the outcome is inversely related to power.
B, C
Before the study, a power analysis found that a sample size of 80 patients per group can detect a mean difference of 10 mm Hg in the reduction of systolic blood pressure (primary outcome) at 6 months after treatment between a new drug and a standard drug with 90% power. A standard deviation of 9 mm Hg was used in the power analysis.
The anticipated effect size used in this power analysis is ______
10
Before the study, a power analysis found that a sample size of 80 patients per group can detect a mean difference of 10 mm Hg in the reduction of systolic blood pressure (primary outcome) at 6 months after treatment between a new drug and a standard drug with 90% power. A standard deviation of 9 mm Hg was used in the power analysis. After the study started, which of the following scenario will REDUCE power? (Choose all that apply. No partial credit is allowed.)
A. Study enrolled 82 patients in the new drug group and 85 in the standard drug group.
B. A 5 mm Hg difference in the reduction of systolic blood pressure was observed between the new drug and the standard drug.
C. The actual standard deviation in the study was 5 mm Hg.
D. Four patients from the new drug group and 7 patients from the standard drug group unexpectedly died and could not be assessed for reduction in systolic blood pressure at 6 months.
B, D
Patients with obstructive sleep apnea were randomly assigned to receive either Tirzepatide (n=120) or placebo (n=115). The primary end point was the change in the apnea–hypopnea index (AHI, the number of apneas and hypopneas during an hour of sleep) from baseline. The mean change in AHI at week 52 was −25.3 events per hour (95% confidence interval [CI], −29.3 to −21.2) with tirzepatide and −5.3 events per hour (95% CI, −9.4 to −1.1) with placebo, for an estimated treatment difference of −20.0 events per hour (95% CI, −25.8 to −14.2). Which of the following statement is CORRECT?
A. There was a statistically significant decrease in AHI in the placebo group at week 52 compared to baseline.
B. There was a statistically significant increase in AHI in the placebo group at week 52 compared to baseline.
C. There was no statistically significant change in AHI in the placebo group at week 52 compared to baseline.
A
Patients with obstructive sleep apnea were randomly assigned to receive either tirzepatide (n=120) or placebo (n=115). The primary end point was the change in the apnea–hypopnea index (AHI, the number of apneas and hypopneas during an hour of sleep) from baseline. The mean change in AHI at week 52 was −25.3 events per hour (95% confidence interval [CI], −29.3 to −21.2) with tirzepatide and −5.3 events per hour (95% CI, −9.4 to −1.1) with placebo, for an estimated treatment difference of −20.0 events per hour (95% CI, −25.8 to −14.2). Which of the following statement is CORRECT? (Choose all that apply. No partial credit is allowed.)
A. At week 52, there was no difference in the change in AHI between tirzepatide and placebo.
B. At week 52, tirzepatide reduced AHI from baseline.
C. At week 52, tirzepatide reduced AHI more than placebo.
B, C
Study design:
___________: same group observed multiple times
___________: patient pairs matched on some characteristics
independent or dependent?
repeated measures
matched groups
dependent (related)
Ask Five Questions for Choice of Statistical Tests
What is the scale of measurement?
How many samples?
Study design →
Sample size → what is considered “small?”
For continuous variable (interval/ratio, large ordinal) →
nominal, ordinal, continuous (interval/ratio)
samples vs groups
independent/unrelated (randomized), dependent/related (repeated, matched)
overall study <30 or category counts <10
symmetric = parametric (normal distribution), skewed = nonparametric
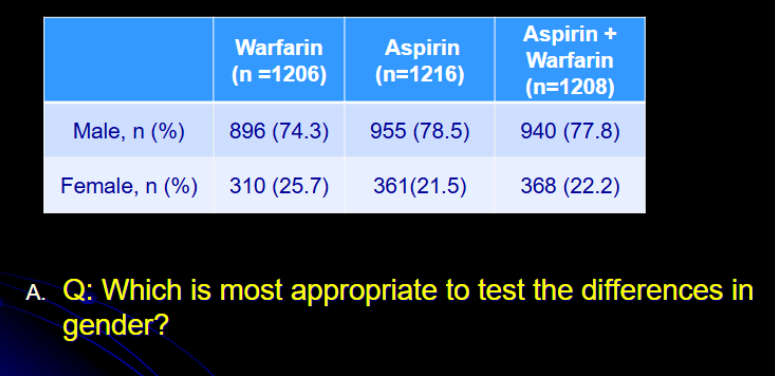
Subjects are randomized to receive
Warfarin
Aspirin
Warfarin + Aspirin
Baseline patient demographic characteristics are compared. Which is most appropriate to test the differences in gender across the three treatment groups?
Variable?
Scale of measurement?
How many samples?
Independent or dependent?
Which test to be used based on the table?
Gender
nominal
3
independent (randomized)
Chi square
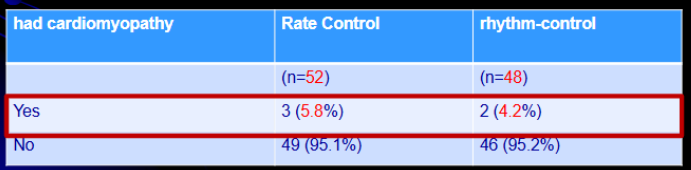
A hundred patients with atrial fibrillation were randomized to either rate-control (n=52) or rhythm-control treatment strategies (n=48). At baseline, 4.9% of subjects in the rate-control group and 4.8% in the rhythm-control group had cardiomyopathy.
Which is most appropriate to test the difference in the baseline cardiomyopathy across the two groups?
Variable?
Scale of measurement?
How many samples?
Independent or dependent?
Which test to be used based on the table?
had cardiomyopathy
nominal
2
independent (randomized)
Fisher (“yes” category <10)
One hundred randomly selected diabetes patients participated in a disease management program (DMP). At the baseline, only 50% achieved glycemic control (HbA1c<=7.0%). Six months after the start of the program, 72% achieved glycemic control.
Which is most appropriate to test the effectiveness of the DMP program?
Variable?
Scale of measurement?
Number of samples?
independent or dependent?
Which test to be used based on the table?
glycemic control (A1c)
nominal (% achieving A1c<7%)
2
dependent (same patients 6m later)
McNemar
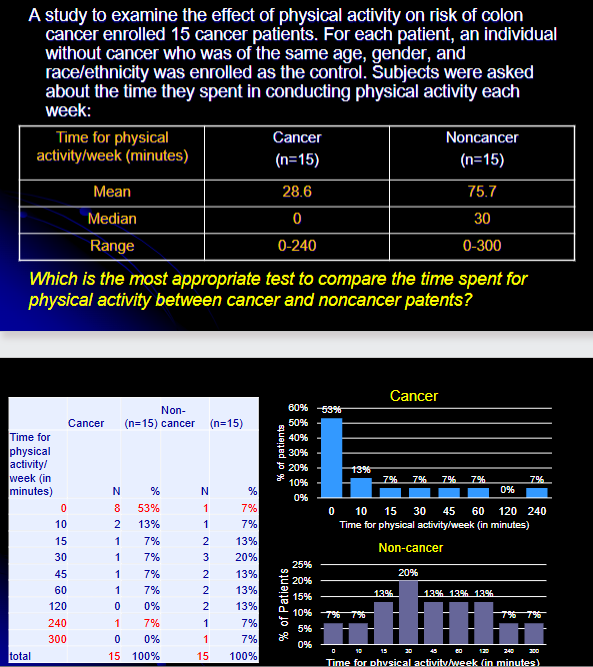
Which is the most appropriate test to compare the time spent for physical activity between cancer and noncancer patents?
Variable?
Scale of measurement?
Number of samples?
Independent or dependent?
Which test to be used based on the table?
time for physical activity (in min)
continuous
2
dependent
Wilcoxon signed-rank (mean>median right skewed)
Patients received atorvastatin (n=341). Serum cholesterol level was first measured at baseline. Then at three months, the changes in serum cholesterol level from the baseline were measured (mean±SD, in mg/dL): -20±10.
Which is most appropriate to compare the mean changes in cholesterol level?
Variable?
Scale of measurement?
Number of samples?
Independent or dependent?
Which test to be used based on the table?
cholesterol
continuous
2
dependent
Paired t (reported mean/SD = normal)
Seven hundred patients were randomized to receive either atorvastatin (n=341) or simvastatin (n=359). At three months, the changes in serum cholesterol level from the baseline were measured (mean±SD, in mg/dL): -20±10 in atorvastatin group vs. -17±10 in simvastatin group.
Which is most appropriate to compare the mean changes in cholesterol level between the two groups?
Variable?
Scale of measurement?
Number of samples?
Independent or dependent?
Which test to be used based on the table?
mean changes in cholesterol
continuous
2
independent
independent t (mean/SD = normal)
A study examined the gastric bypass surgery on appetite. A randomly selected 20 patients who were scheduled to receive gastric bypass surgery were enrolled and the baseline appetite before a meal was measured using a visual analogue scale (VAS). The appetite was assessed again three months after the surgery to measure the changes in appetite.
Which test is most appropriate for testing changes in appetite from the baseline?
*Visual analog scale (VAS) scale of hunger and satiety sensations (0-10)
Variable?
Scale of measurement?
Number of samples?
Independent or dependent?
Which test to be used based on the table?
change in appetite
ordinal
2
dependent
Wilcoxon signed-rank
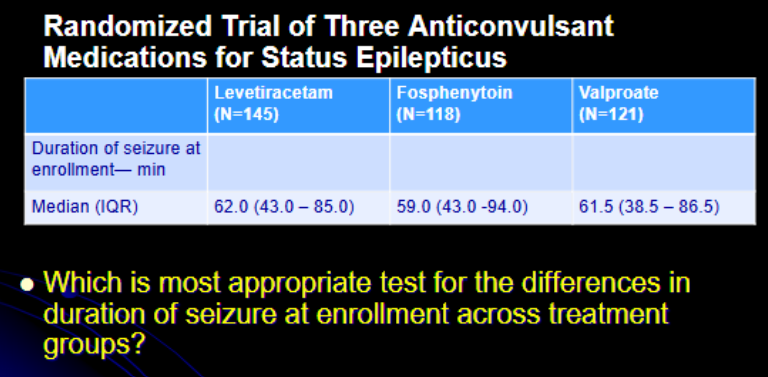
Variable?
Scale of measurement?
Number of samples?
Independent or dependent?
Which test to be used based on the table?
diff in duration of seizure
continuous
3
independent
One-way ANOVA (large n)
Patients with obstructive sleep apnea were randomly assigned to receive either tirzepatide (n=120) or placebo (n=115). The primary end point was the change in the apnea–hypopnea index (AHI, the number of apneas and hypopneas during an hour of sleep) from baseline. The mean change in AHI at week 52 was −25.3 events per hour (95% confidence interval [CI], −29.3 to −21.2) with tirzepatide and −5.3 events per hour (95% CI, −9.4 to −1.1) with placebo, for an estimated treatment difference of −20.0 events per hour (95% CI, −25.8 to −14.2). Which is the most appropriate test for the change in AHI at week 52 from baseline in the tirzepatide group?
Variable?
Scale of measurement?
Number of samples?
Independent or dependent?
Which test to be used based on the table?
change in AHI in T
continuous
2
dependent
paired t (mean=normal)
Patients with obstructive sleep apnea were randomly assigned to receive either tirzepatide (n=120) or placebo (n=115). The primary end point was the change in the apnea–hypopnea index (AHI, the number of apneas and hypopneas during an hour of sleep) from baseline. The mean change in AHI at week 52 was −25.3 events per hour (95% confidence interval [CI], −29.3 to −21.2) with tirzepatide and −5.3 events per hour (95% CI, −9.4 to −1.1) with placebo, for an estimated treatment difference of −20.0 events per hour (95% CI, −25.8 to −14.2). Which is the most appropriate test for comparing the change in AHI at week 52 from baseline between tirzepatide and placebo?
Variable?
Scale of measurement?
Number of samples?
Independent or dependent?
Which test to be used based on the table?
change in AHI btwn T+P
continuous
2
independent
independent t (mean=normal)
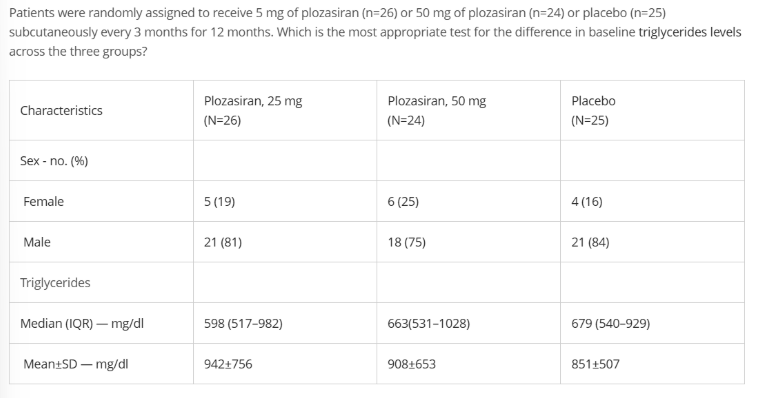
Variable?
Scale of measurement?
Number of samples?
Independent or dependent?
Which test to be used based on the table?
diff in TG
continuous
3
independent
Kruskal-Wallis (mean>median = right skewed)
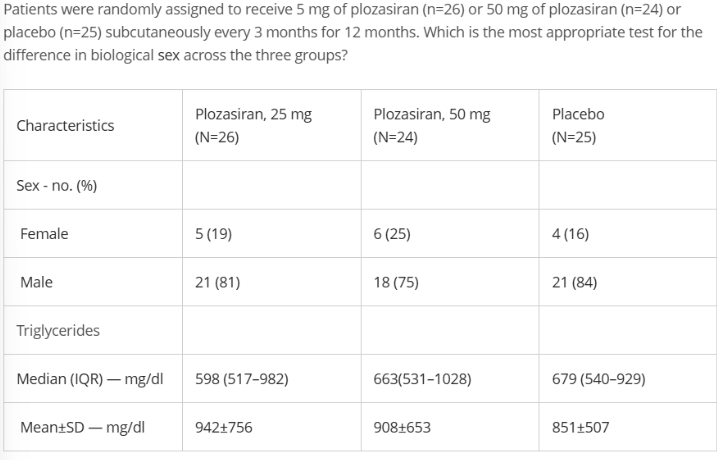
Variable?
Scale of measurement?
Number of samples?
Independent or dependent?
Which test to be used based on the table?
gender
nominal
3
independent
Fisher (small group<30)