COMM 404: Quantitative Research Methods - Midterm Exam
1/121
Earn XP
Description and Tags
Week 1 - Week 6
Name | Mastery | Learn | Test | Matching | Spaced |
|---|
No study sessions yet.
122 Terms
Define Science
A method of inquiry, a way of knowing things about the world around us [although there is no agreed upon definition]
Define Theory
A systematic explanation for the observations that relate to a particular aspect of life, an explanation for what we see
A set of systematic, informed hunches about how the way things work
systematic: organized and structured
informed hunches: Don’t really know the answer to our question, but have done a literature review and know what’s out there
Define Research
Define Epistemology
All about knowledge, how they know what they claim to know.
The Ways of Knowing
What are the problems with ordinary knowledge?
How does science attempt to account for these errors?
With ordinary knowledge it can hold inaccurate observations, maybe only remembering some information, but not all
Science is intentional, whereas ordinary human inquiry is not
As ordinary humans, we might overgeneralize
seeing a few events and thinking its true for the majority
Science aims to generalize
Selective Observation
Paying attention to things that go with your beliefs and not paying attention to things that go against your beliefs, you see what you want to see
Illogical Reasoning
conclusion doesn’t actually represent truth
gambler’s fallacy
thinking you have a higher chance of a different outcome after multiple times of the same outcome (ex: flipping a coin)
What does Science do?
Scientific inquiry guards against the errors of ordinary inquiry through careful and deliberate efforts
Characteristics of Science
Being conscious, done in a careful and unhurried way, rigorous, exhaustive, thorough, accurate, logical, and empirical
Exhaustive
Mutually Exclusive
Empirical
Exhaustive
It covers everything, everyone can answer the question, one option must occur
ex: adding “none of the above” and/or “other” as an option to get a response from everyone
Mutually Exclusive
A statistical term describing two or more events that cannot happen simultaneously
Everyone can only answer one of the options
Empirical
Data that accounts for your research, systematic understanding, results, factual, evidence, seen, and verified
Determining Causality
How variables impact each other, one thing causes the other
relating to or acting as a clause, causation
Events are connected, variable seen as an outcome or result of the other, consequent events is determined by what happened before, cause-and-effect
correlation does not mean causation
ex: the ground is wet because it rained
Paradigm
Ways of looking at things, although they do not explain things
Theories are explanations for what we see
2 types of Paradigms
positivism
Interpretivism
Positivism Paradigm
[Quantitative]
Assumption: there is a logically ordered and objective reality that can be known better through science
1 reality for everyone, general truth to something, objective reality that can be known better through science
Objective reality that is knowable only through empirical observation
Developing theories make possible predictions and explanations
Search for generalized laws
Observations through quantitative data
variables/attributes, measured in a universal/objective way
ex: Love - under a positivism paradigm, love would be measured as an increase in heart rate (Hard core positivists would not study Love because it is outside the realm of science)
Interpretivism Paradigm
[Qualitative] Focuses on measuring and analyzing variables to identify patterns and relationships
Uses statistical measurements and experiments
Aims to generalize findings across populations and establish causal relationships
Everyone has their own reality, everyone is different, the world is based on individuals interpretations of reality
The wheel of science
Observation: [Induction starts here] The initial stage where scientists gather information about a phenomenon through direct observation or existing data, Induces generalizations
Empirical Generalizations: Process of forming propositions based on empirical evidence, based on observation or experiences.
Theory: [Deduction starts here] A systematic explanation for the observations/generalization that relate to a particular aspect of life. Forming concepts, developing and arranging theoretical propositions
Hypothesis: A proposed explanation or prediction based on the initial observations and questions which can be tested through experimentation
![<p><strong>Observation:</strong> [Induction starts here] The initial stage where scientists gather information about a phenomenon through direct observation or existing data, Induces generalizations</p><p><strong>Empirical Generalizations: </strong>Process of forming propositions based on empirical evidence, based on observation or experiences. </p><p><strong>Theory:</strong> [Deduction starts here] A systematic explanation for the observations/generalization that relate to a particular aspect of life. Forming concepts, developing and arranging theoretical propositions</p><p><strong>Hypothesis:</strong> A proposed explanation or prediction based on the initial observations and questions which can be tested through experimentation</p>](https://knowt-user-attachments.s3.amazonaws.com/3b9edc1e-175e-4378-af76-3a8ac447f4bf.png)
Inductive Logic
[Qualitative] Moves from specific observations to the discovery of a pattern that represents order among all the given events
Moving from specific details —> broader generalizations
Starts with data collect/specific observations —> what is in common —> theory
Derived from general principles, ideal to build theories, begins with data you collected
![<p>[Qualitative] Moves from specific observations to the discovery of a pattern that represents order among all the given events</p><ul><li><p>Moving from specific details —> broader generalizations</p></li><li><p>Starts with data collect/specific observations —> what is in common —> theory</p></li><li><p>Derived from general principles, ideal to build theories, begins with data you collected</p></li></ul><p></p>](https://knowt-user-attachments.s3.amazonaws.com/4331c43d-d76e-49ab-a284-e46612aaed35.png)
Deductive Logic
[Quantitative] Moves from a pattern that is theoretically expected to observations that test if the expected pattern occurs
Begin with theory —> we know what we are looking for —> able to derive conclusions from the assumptions of the theory
Broader generalizations —> specific details/observations
drawing conclusions from available information
Starts with a theory —> collect data to see if its true
Derived from rational observation, applies the principle to a case, ideal to test theories
![<p>[Quantitative] Moves from a pattern that is theoretically expected to observations that test if the expected pattern occurs</p><ul><li><p>Begin with theory —> we know what we are looking for —> able to derive conclusions from the assumptions of the theory</p></li><li><p><span>Broader generalizations —> specific details/observations</span></p></li><li><p>drawing conclusions from available information</p></li><li><p>Starts with a theory —> collect data to see if its true</p></li><li><p>Derived from rational observation, applies the principle to a case, ideal to test theories</p></li></ul><p></p>](https://knowt-user-attachments.s3.amazonaws.com/75411ba8-5c91-49cf-b1bb-d94753c7626c.png)
Variables
Any entity/thing that can take on different values
Concrete Variables
Set understanding of what something is, how they stay consistent across contexts
ex: gender, sex
Abstract Variables
Constructs that are not directly measurable
ex: happiness, commitment
Attributes
Specific categories of a variable; how the variable varies; descriptions of the variable, specificity, specific category of a variable
ex: Sex (male/female), socioeconomic status (lower/middle/high class)
( ) = attributes
Values
The numerical aspect directly associated with a specific attribute
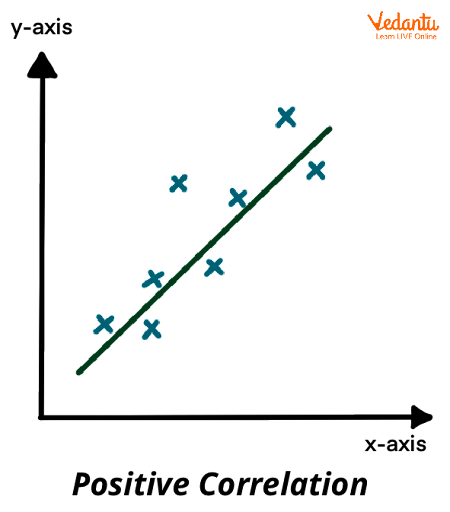
Positive Relationships
Movement in the same direction
An increase in one variable corresponds to an increase in another
A decrease in one variable corresponds to a decrease in another
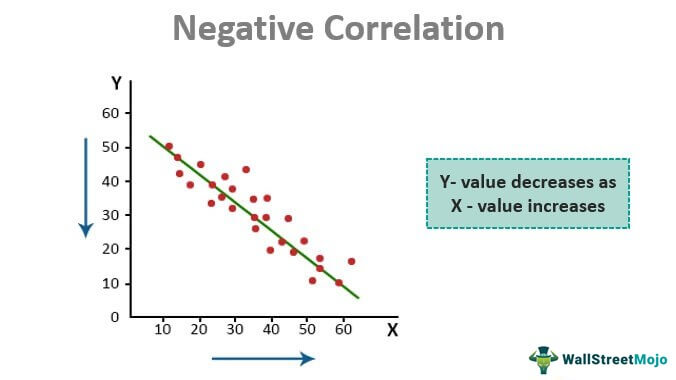
Negative Relationships
Variables are going in opposite directions
A decrease of one variable corresponds to an increase in another
An increase of one variable corresponds to a decrease in another
Differences
When the scores from two or more groups significantly differ from each other
ex: giving two groups a survey and then examining the average scores of the two groups
Independent Variables
The variable expected to account for the changes in the dependent variables
The manipulated Variable
The “cause”
“Gender” and “sex” = usually are going to be independent variables
Dependent variable
A variable assumed to depend on another
The variable to be explained
The “effect” of one or more independent variables
“Outcome” = usually going to be dependent variable
Levels of Measurement
Nominal
Ordinal
Interval
Ratio
Nominal Measurement
Categorical with no ranking, frequency, or “count” data
Objects are distinguished from one another by a name/labeling data
Values are associated to a number
Weakest measurement because we can do the least with nominal data
ex: biological sex will always be nominal, religion, favorite beverage
Ordinal Measurement
Categorical data in which the categories have some rank based upon them
Differences between ranks are meaningless because they are not equal
ex: the word “rank” means it is an ordinal measurement, ranking your top 5 beverages
Interval Measurement
Differences between increments have meaning because they are equal, but no absolute zero
ex: the typical scales we think about (Likert)
Ratio Measurement
Ratios are meaningful and the zero point is fixed
Most complex because we can do the most with ratio data
The goal is to get a ratio-level measurement because it has an absolute zero
ex: Ideal number of children, family income in dollars, amount of Facebook friends you have, age, weight
At all levels of measurement, the attributes must be…
Exhaustive
Mutually Exclusive
Equivalent
With a range, each range should have the same increments
Types of scales
Likert Scale
Semantic Differential Scale
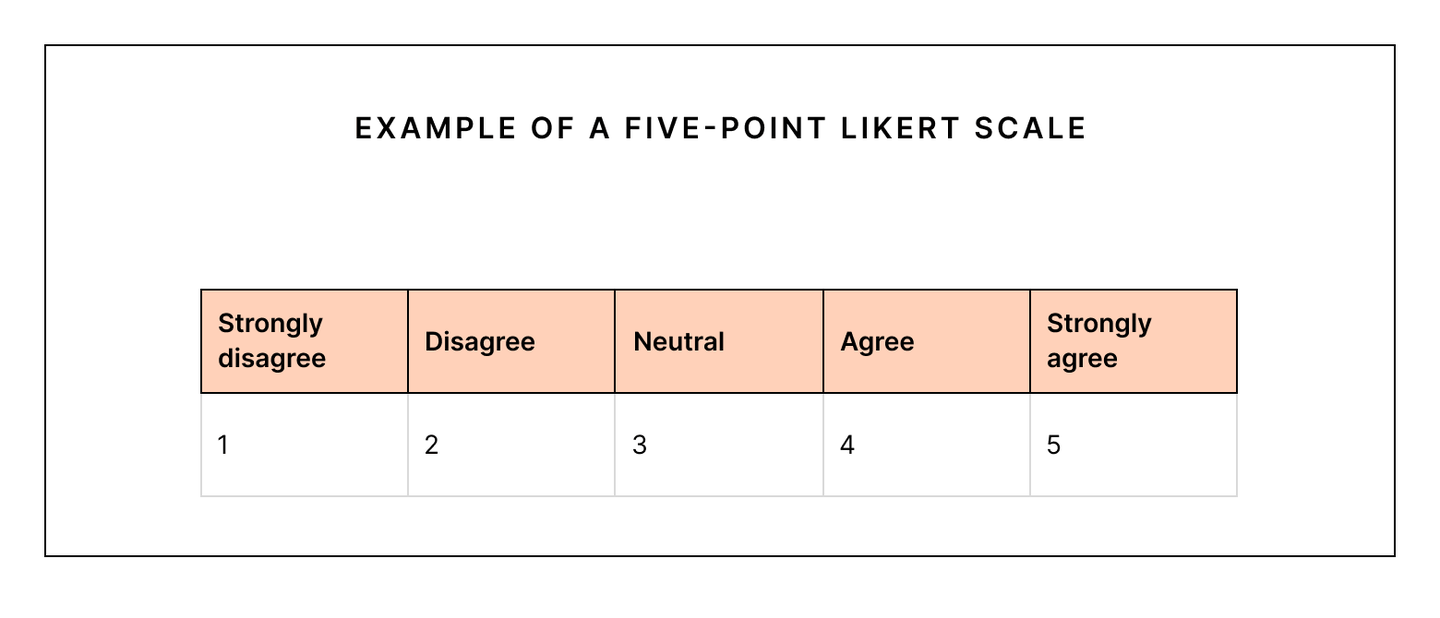
Likert Scale
Each respondent is asked to rate a statement on a scale | Interval Level
Used for agreement, frequency, importance, quality
ex: Rate XYZ on a scale ranging from 1 (strongly disagree) to 5 (strongly agree)
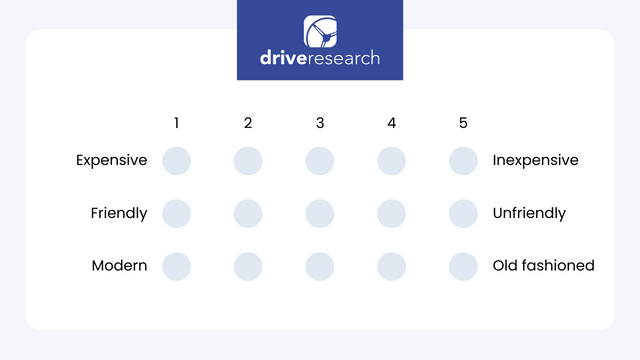
Semantic Differential
Consists of a series of adjectives that are oppositely worded
a series of steps exist between the two opposing adjectives
measures moods, attitudes, and emotions
ex: good/bad, happy/sad, eventful/uneventful
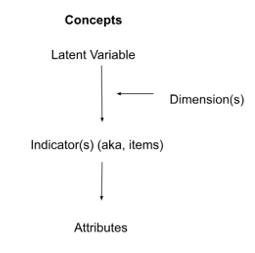
Conceptualization
A process of defining the agreed meaning of the terms used in a study
Indicators
Identified to mark the presence or absence of a concept
specific, observable, and measurable variables or items that provide evidence of a broader construct or concept

Dimensions
Concepts that have more than one aspect or facet, factors
Broader categories or aspects of a construct that encompass several indicators of a single overarching concept
Operationalization
The process of research, the creation of something, how are you going to measure a concept?
The procedures used to measure a concept
Measurement Reliability
Can the measure consistently measure the variables with similar results
reliability = consistency
reliability is the prerequisite for validity, but it does not ensure validity
Measurement Validity
Is the measurement measuring what it is saying it is measuring?
validity = accuracy
If its accurate, it’s going to be reliable but if its reliable it is not always accurate
Types of reliability assessment
Test-Re-Test
Split Half [Parallel Forms]
Internal Consistency [Cronbach’s Alpha]
Test-Re-Test
Testing and measuring the same person on two separate occasions and then looking at the correlation among the two measurements
Split Half [Parallel Forms]
A measure consisting of several questions is given to a sample of participants
Questions are divided up into halves randomly
Each half is treated as a subtest with the result of the two subjects correlated to obtain an estimate of reliability
Internal Consistency [Cronbach’s Alpha]
The researcher examines the relationships among all questions simultaneously
The questions is to what extend the measures are homogenous (correlated) and measuring the same concept
This is what we do!
Types of Validity Assessments
Content Related
Face Validity
Expert Panel Validity
Criterion Related
Predictive Validity
Concurrent Validity
Construct Related
Convergent Validity
Discriminant Validity
Face Validity
[Content Related]
Does it look right to you? Does it look like it measures?
Expert Panel Validity
[Content Related]
Does it look right to experts?
Predictive Validity
[Criterion Related]
The extent to which a score on a test predicts scores or outcomes on another measure taken later
ex: SAT, ACT, SOL
Concurrent Validity
[Criterion Related]
The degree to which test scores correspond to scores from an established measure that is administered simultaneously
ex: a therapist may use two separate depression scales with a patient to confirm a diagnosis. As long as both the assessments give the same results, they are concurrently valid
Convergent Validity
[Construct Related]
The extent to which two different measures of the same construct yield similar results
ex: A measure of self-esteem and a measure of extroversion, are likely to be correlated
Discriminant Validity
[Construct Related]
The extent to which a test or measure is unrelated to other measures that are theoretically different
ex: The scores of two tests measuring security and loneliness theoretically should not be correlated.
Key Sampling Terms
Population
Parameter
Sample
Statistic
Sampling Error
Population
Group compromising of all units (people or things) possessing specific attributes
The groups to which you want to generalize
Parameter
Specific characteristics under study
ex: just adults? children?
Sample
Subset of a population
Statistic
An estimate of the parameter
Sampling Error
The amount that a given sample statistic deviated from the population parameter
Probability Sampling
All cases in the population have a known and equal change of being selected [random]
Non-Probability Sampling
The chance of selecting any case is not known because cases are selected non-randomly
Types of Probability Sampling
Simple Random
Systematic
Stratified Random
Cluster
Simple Random
Case selected is based on randomly selecting cases from the entire population, often used when little is known about the population
Systematic
Randomly choose first element, then randomly select every blank number after…
The list from which you select elements should be randomized
ex: our class getting in alphabetical order by last name and Lane counting off and every sixth person gets selected
Stratified Random
The population is divided into two or more mutually exclusive segments [strata]
a simple random sample is drawn from each group
subsamples are joined to form a complete stratified sample
Advantages: able to capture key population characteristics in the sample
Picking parts so everyone is represented, good variety
Cluster
Population is broken down into small groups [clusters]
clusters are generally based on natural groupings, a sample of the clusters are drawn, cases are they only draw from the sample clusters
ex: states, countries, cities, blocks
picking a group from a larger group
Factors determining sample size
Heterogeneity of the population [Different, diverse]
Desired precision
Sampling design
Power needed
Heterogeneity of the population
The more dissimilar a population the larger the required sample
if the population was completely homogenous [the same], then a sample of one would suffice
Desired precision
All the things equal, a larger sample will yield a better population estimate
Sampling design
Some designs require a smaller sample to get the same level of precision as other designs
ex: stratified vs. simple random sample
Power Needed
How strong is the effect your looking for?
The Milgram Study
people were brought in and people got shocked, participants listened because of authority, led to the Belmont Report
Ethical Principles outlined by the Belmont Report
Respect for persons
Beneficence
Justice
Informed Consent
Respect for persons
Treat participants as independent thinkers
Beneficence
Well-being of participants is protected
do not harm
Maximize possible benefits
Minimize possible risks
Justice
Treating participants equally and fairly
equitable selection of participants
avoiding populations that may be unfairly coerced into participating
Informed consent
A “person’s voluntary agreement, based upon adequate knowledge and understanding of relevant information to participate in research”
anyone with dementia or under the age of 18 needs consent from caretaker/adult
participants have to be able to volunteer, they can’t feel forced into volunteering
Institutional Review Boards (IRB)
Panel that reviews research proposals to guarantee protection of participants’ rights and interests
make sure research follows ethical guidelines
ensures risks to human participants are minimal
protect the agency/institution from legal action
IRB Proposals
Objectives of the study
The population and sample
The nature of informed consent
The procedures
The protection of participants’ identity
An analysis of risks and benefits of the study
Copies of all study documents
Informed consent, debriefing, measurements
Anonymity
The researcher cannot connect participants to responses, nothing is identifiable
Can never guarantee it
Confidentiality
You can still identify participants if you need too, but information is protected
Ethical issues in reporting research
Ensuring accuracy and objectivity
State limitations of the study
Avoiding plagiarism
Protecting identities of participants
Advantages of survey research
Ability to provide detailed information and precise information about a heterogeneous [diverse, different] population
wide ranging applicability
When compared to an experiment, surveys have a greater number of topics/variables that can be examined
secondary data is generally low/no cost to the user
Secondary data
data sets that you did not create yourself
Disadvantages of survey research
Limits ability to make causal claims
experiments are better for making causal claims because you are more in control
Once the survey is in the field it is difficult to make changes
susceptible to reactivity from respondents
social desirability bias
respondents might get tired or bored of the experiment
Social Desirability Bias
Participants give you the answers they think the researcher is looking for
Cross-Sectional design
most common, information on a population gathered at a single point in time
Longitudinal design
Gathering data over a period of time, examine changes in the population, and attempt to describe and/or explain them
panel
trend
cohort designs
Panel - Longitudinal Design
Same individual people that you are surveying each time
Trend - Longitudinal Design
Same age group of people, but not the same individuals, participants do not get older
ex: using participants in COMM 211 each semester
Cohort - Longitudinal Design
Same group, different people
Response Rate
The percent of individuals contacted who respond to a survey
Non-response Rate
Systematic distortion of a statistic as a result of unit and item nonresponse
there could be something about the people who choose not to respond vs. those who decide to respond
Ex: only reviewing a professor if you have a negative experience, but not highlighting the positives
Survey Question wording problems
Define Experiment
When a researcher purposefully manipulates one or more variables (IV) in hopes of seeing how this manipulation effects change or the lack of change in the other variables of interest (DV)
Internal Validity
The extent to which the variations in the DV can be attributed to the IV