Static
 Call Kai
 Learn
Learn Practice Test
 Spaced Repetition
 Match
Match Flashcards
 Knowt Play
1/3

There's no tags or description
Looks like no tags are added yet.
Name | Mastery | Learn | Test | Matching | Spaced | Call with Kai | Chat |
|---|
No analytics yet
Send a link to your students to track their progress
4 Terms
The pie charts show the size of classes in primary schools in four states in Australia in 2010. 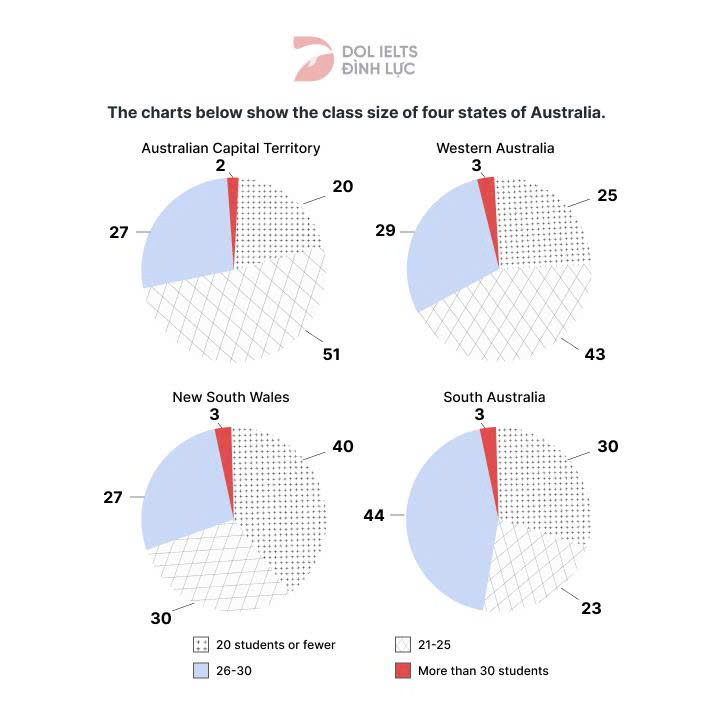 ACT: 21-25, 26-30, 20 or fewer, more than 30 WA: 21-25, 26-30, 20 or fewer, more than 30. NSW: 20 or fewer, 21-25, 26-30, more than 30 SA: 26-30, 20 ss of fewer, 21-25, more than 30. | Write an overview for this chart Here is a structured outline of the paragraph: I. Main Trend
II. Regional Variations in Class Sizes
|
Overall, it is clear that classes with more than 30 students were the least popular across the board. While the majority of classes in Australian Capital Territory (ACT) and Western Australia accommodated between 21 and 25 students, the typical class size in New South Wales (NSW) was no more than 20 students, and that in South Australia was from 26 to 30.
The pie charts show the size of classes in primary schools in four states in Australia in 2010. ACT: 21-25, 26-30, 20 or fewer, more than 30 WA: 21-25, 26-30, 20 or fewer, more than 30. NSW: 20 or fewer, 21-25, 26-30, more than 30 SA: 26-30, 20 ss of fewer, 21-25, more than 30. | Write the 1st body paragraph (ACT & WA) Class sizes in ACT and Western Australia displayed a high degree of 1. _______. More than 2. _______ of classes in the former, and 3. _______ of those in the latter had between 21 and 25 learners, the 4. _______ figure in each location, respectively. 5. _______, 29% of classes in Western Australia accommodated 26 to 30 students, 2% 6. _______ than the figure for ACT. A slightly broader 7. _______ was seen in the percentage of classes hosting fewer than 20 students (25% for Western Australia 8. _______ 20% for ACT). However, it was 9. _______ for classes to have more than 30 students in both areas as the figures stood at 10. _______ than 3%. |
Class sizes in ACT and Western Australia displayed a high degree of congruity. More than half of classes in the former, and 43% of those in the latter had between 21 and 25 learners, the highest figure in each location, respectively. Meanwhile, 29% of classes in Western Australia accommodated 26 to 30 students, 2% higher than the figure for ACT. A slightly broader disparity was seen in the percentage of classes hosting fewer than 20 students (25% for Western Australia versus 20% for ACT). However, it was rare for classes to have more than 30 students in both areas as the figures stood at no more than 3%.
The pie charts show the size of classes in primary schools in four states in Australia in 2010. ACT: 21-25, 26-30, 20 or fewer, more than 30 WA: 21-25, 26-30, 20 or fewer, more than 30. NSW: 20 or fewer, 21-25, 26-30, more than 30 SA: 26-30, 20 ss of fewer, 21-25, more than 30. | Write the 2nd body paragraph (NSW & SA) While the [Extreme Category] continued to be unpopular in [Region A] and [Region B], constituting [X]% of the [items] in both areas, these two regions had different patterns. In [Region A], the most popular [metric] was [Category 1], at [Percentage 1]%, while the same size only accounted for [Percentage 2]% of [items] in [Region B]. By contrast, most [items] in [Region B] fell into [Category 2], at [Percentage 3]%, [Z]% higher than their counterparts in [Region A]. Finally, [Percentage 4]% and [Percentage 5]% of [items] in [Region B] and [Region A] belonged to [Category 3]. |
While the largest class size continued to be unpopular in New South Wales and South Australia, constituting 3% of the classes in both areas, these two regions had different patterns. In New South Wales, the most popular class size was for no more than 20 students, at 40%, while the same size only accounted for 30% of classes in South Australia. By contrast, most classes in South Australia had 26 to 30 students, at 44%, 17% higher than their counterparts in NSW. Finally, 30% and 23% of classes in South Australia and New South Wales had between 21 and 25 learners.
The pie charts show the size of classes in primary schools in four states in Australia in 2010. ACT: 21-25, 26-30, 20 or fewer, more than 30 WA: 21-25, 26-30, 20 or fewer, more than 30. NSW: 20 or fewer, 21-25, 26-30, more than 30 SA: 26-30, 20 ss of fewer, 21-25, more than 30. | The pie charts illustrate the proportion of four class sizes in four states of Australia in 2010. Overall, it is clear that classes with more than 30 students were the least popular across the board. While the majority of classes in Australian Capital Territory (ACT) and Western Australia _____________ (hosted) between 21 and 25 students, the ________ (popular/common) class size in New South Wales (NSW) was no more than 20 students, and that in South Australia was from 26 to 30. Class sizes in ACT and Western Australia displayed a high degree of ______________ (The quality or state of agreeing or being suitable). More than half of classes in the former, and 43% of those in the latter _____ between 21 and 25 learners, the highest figure in each location, respectively. Meanwhile, 29% of classes in Western Australia accommodated 26 to 30 students, 2% higher than the figure for ACT. A slightly ________ _______ (larger gap) was seen in the percentage of classes _________ (accommodating) ______ (ít hơn) than 20 students (25% for Western Australia versus 20% for ACT). However, it was ______ (hiếm) for classes to have more than 30 students in both areas as the figures stood at no more than 3%. While the largest class size continued to be ___________ (không phổ biến) in New South Wales and South Australia, ____________ (making up) 3% of the classes in both areas, these two regions had different __________. In New South Wales, the most popular class size was for no more than 20 students, at 40%, while the same size only accounted for 30% of classes in South Australia. By contrast, most classes in South Australia had 26 to 30 students, at 44%, 17% higher than their ____________ (vật tương tự, người tương tự) in NSW. Finally, 30% and 23% of classes in South Australia and New South Wales had between 21 and 25 learners. |
accommodated, typical, congruity, had, broader disparity, hosting, fewer, rare, unpopular, constituting, patterns, counterparts