Overview of Evidence-Based Medicine Principles
1/125
There's no tags or description
Looks like no tags are added yet.
Name | Mastery | Learn | Test | Matching | Spaced |
|---|
No study sessions yet.
126 Terms
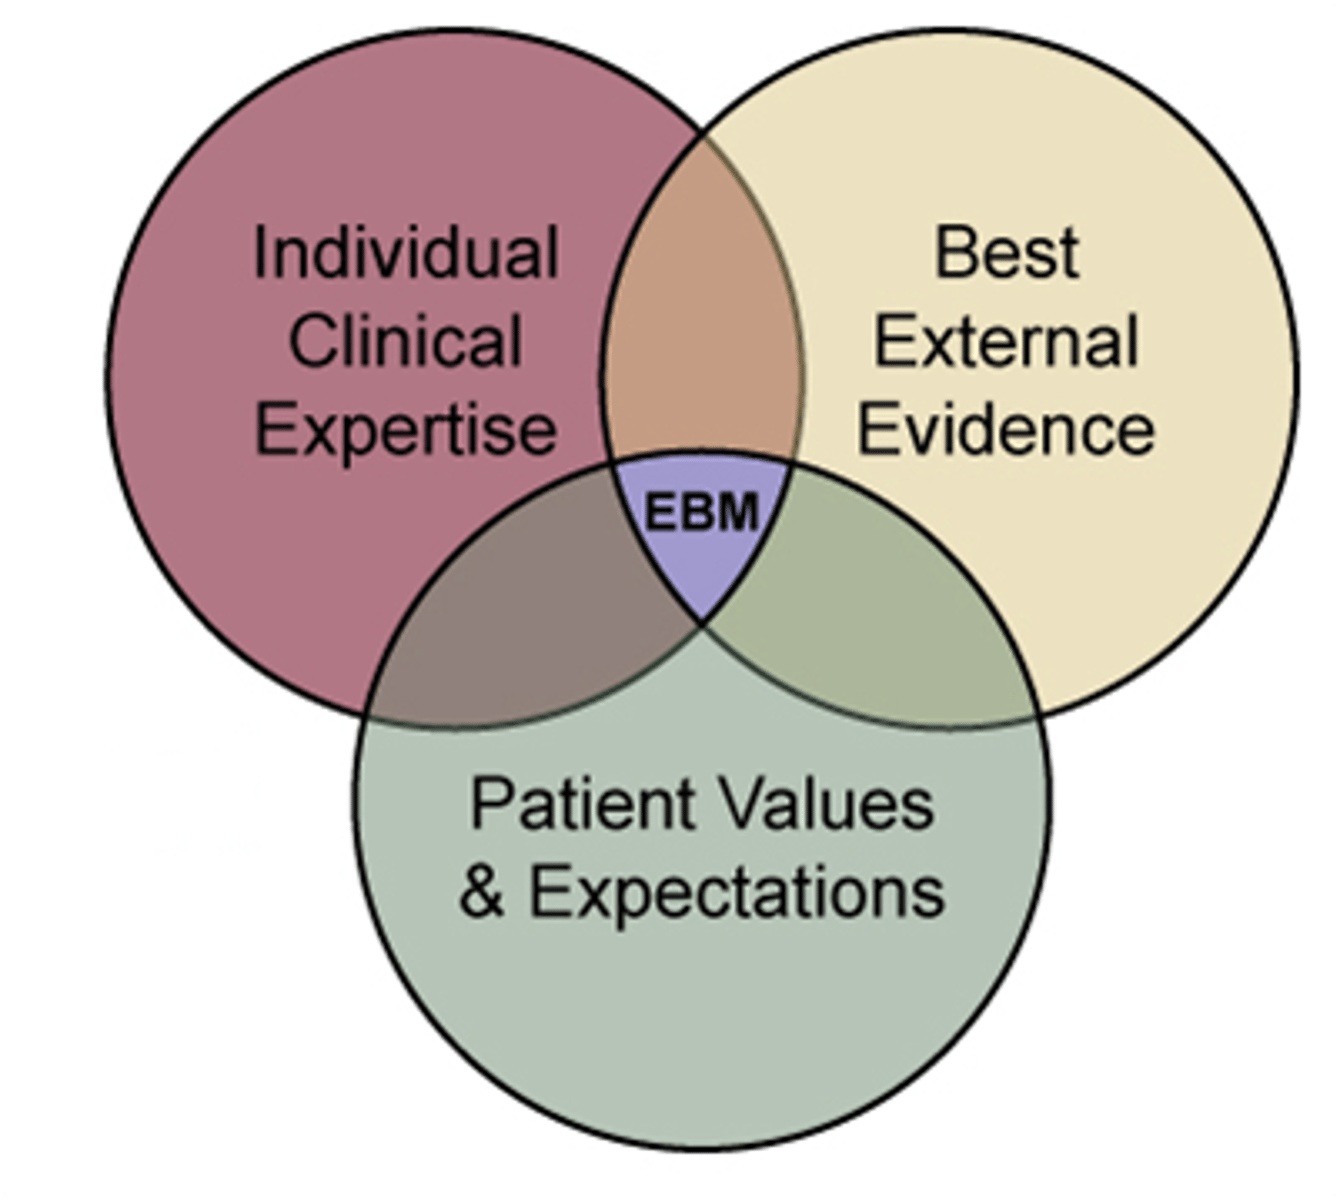
Evidence-based medicine
The integration of best research evidence with clinical expertise and patient values
Five Steps of Evidence-Based Medicine
Ask clinical question, Acquire best evidence, Appraise evidence, Advise patient, Assess clinical practice
Hierarchy of Evidence
A ranking system for the quality of evidence, with systematic reviews/meta-analyses at the top.
Meta-analysis
RCT
Cohort study
Case-control
Case series
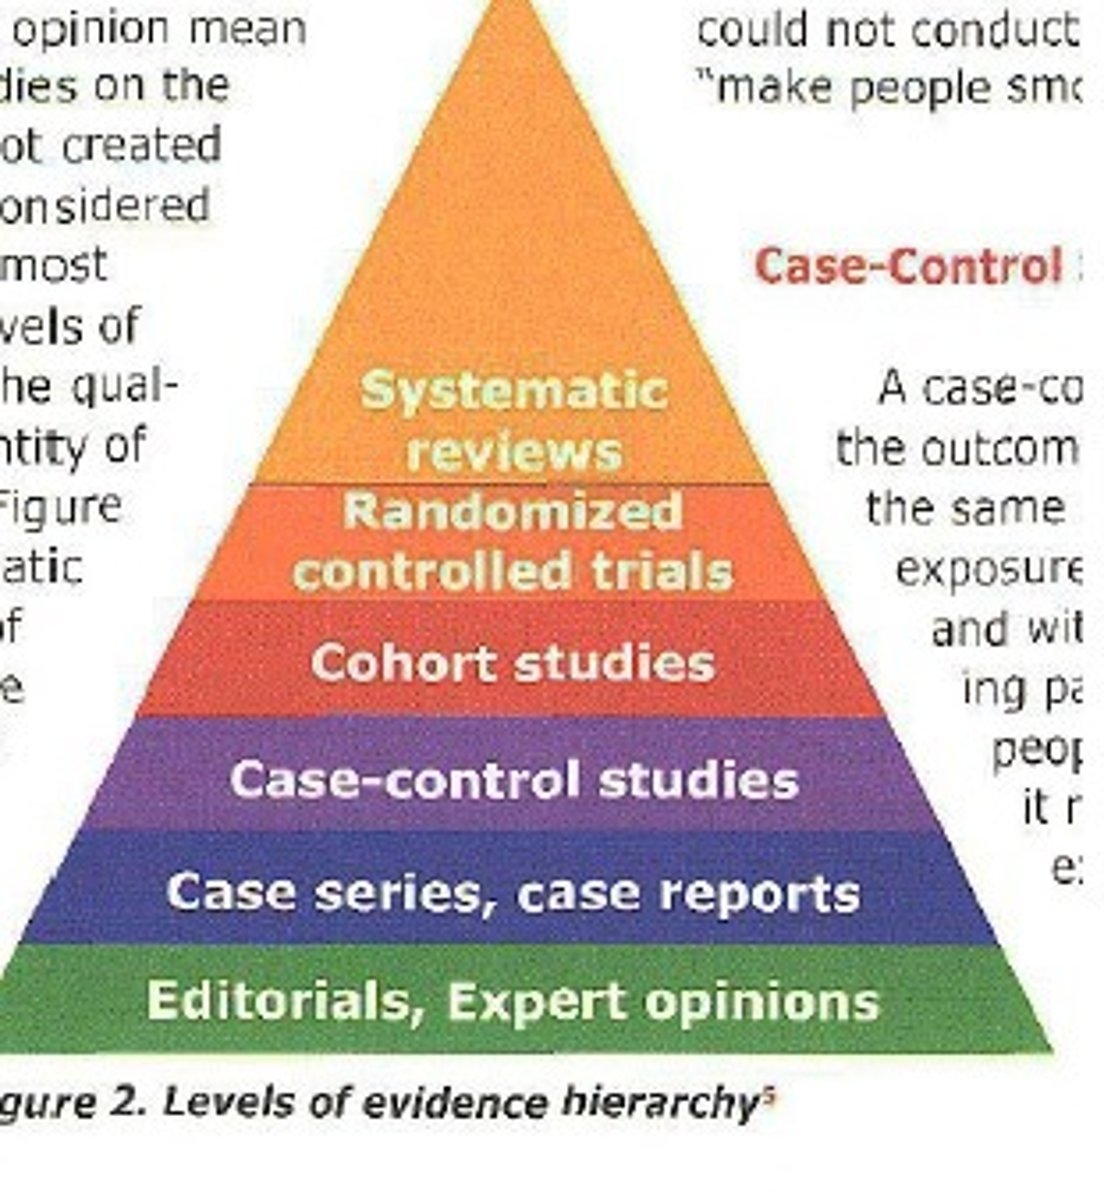
Systematic reviews/meta-analyses
The highest level of evidence, synthesizing results from multiple randomized controlled trials (RCTs).
Randomized Controlled Trials (RCTs)
Experiments that randomly assign participants to treatment or control groups to evaluate the effectiveness of an intervention.
Cohort control studies
Observational studies that follow a group of individuals exposed to a certain factor and compare them to a non-exposed group.
Case-control studies
Observational studies that compare individuals with a specific condition to those without it.
Consensus conference
A gathering of experts to reach a collective agreement on a medical issue.
Expert opinion
Guidance provided by specialists based on their knowledge and experience.
Observational studies: Direction
Cohort: Exposure > Outcome; Case-Control: Outcome > Exposure; Cross-sectional: Snapshot.
What are the two types of clinical questions
background and foreground questions
Background Questions
Questions that seek general knowledge about a disorder
Foreground Questions
Questions that seek specific knowledge about managing patients with a disorder
PICO
A framework for formulating clinical questions: Patient/Problem, Intervention, Comparison, Outcome.
The best primary evidence for therapy is ______
RCT
What are the tree steps in using an article about therapy
· Are the results of the study valid? (Validity)
· What are the results and are they important? (Importance)
· How can you apply these results to patient care? (Utility)
What is used to assess importance of a therapy
precision and magnitude of tx effect
Intention-to-treat analysis
A strategy that compares patients in the groups to which they were originally randomly assigned, regardless of dropouts.
Concealed random allocation
A method to prevent bias in assigning treatments by keeping the allocation hidden.
Experimental Event Rate (EER)
The proportion of patients in the treatment group who had the outcome of interest.
Control Event Rate (CER)
The proportion of patients in the control group who had the outcome of interest.
Relative Risk (RR)
The ratio of EER to CER.
Hazard Ratio (HR)
A weighted relative risk over the entire study, used in survival/time-to-event analysis.
Relative Risk Reduction (RRR)
Calculated as 1 - RR, usually expressed as a percentage.
Odds Ratio (OR)
The odds of an event calculated by dividing the odds in the treated group by the odds in the control group.
Absolute Risk Reduction (ARR)
The absolute difference in risk between the treated and control group, calculated as (EER - CER)
Number Needed to Treat (NNT)
The number of patients that need to be treated to prevent one additional bad outcome, calculated as NNT = 1/ARR.
Number Needed to Harm (NNH)
The number of patients that need to be treated to cause one additional bad outcome, calculated similarly to NNT.
Magnitude of treatment effect
The size of the effect of an intervention, often measured by various statistical metrics.
Cohen's d effect size (small, medium, large)
.2= Small
.5= Medium
.8+= Large
correlation coefficient value of ____ shows no effect
0
P Value
The probability that any particular outcome would have arisen by chance, with p < .05 indicating statistical significance.
a p value of <0.05 means that
there is less than 1 chance in 20 that the difference between the treated and control group is due to chance
Confidence Interval (CI)
the range of values within which we can be 95% sure that the true value for the population lies (consistent with the sample data)
Upper Bound of CI
Indicates maximum possible true effect size.
Lower Bound of CI
Indicates minimum possible true effect size.
Larger samples yield _____ confidence intervals
narrower
the smaller the trial, the ____ the CI
wider (less precise)
if the CI crosses or includes ___, the results are not ____
1, not statistically significant
Statistical Significance
CI crosses 1 for OR, RR, HR indicates insignificance.
Point Estimate
single result which represents our best estimate of the treatment
Adjusted Risk
Patient's risk compared to study population risk.
NNT Calculation
NNT = 1/ARR --> (ARR= EER-CER)
Diagnostic Test Validity requires independent ____ with the _____
Independent comparison with a gold standard required
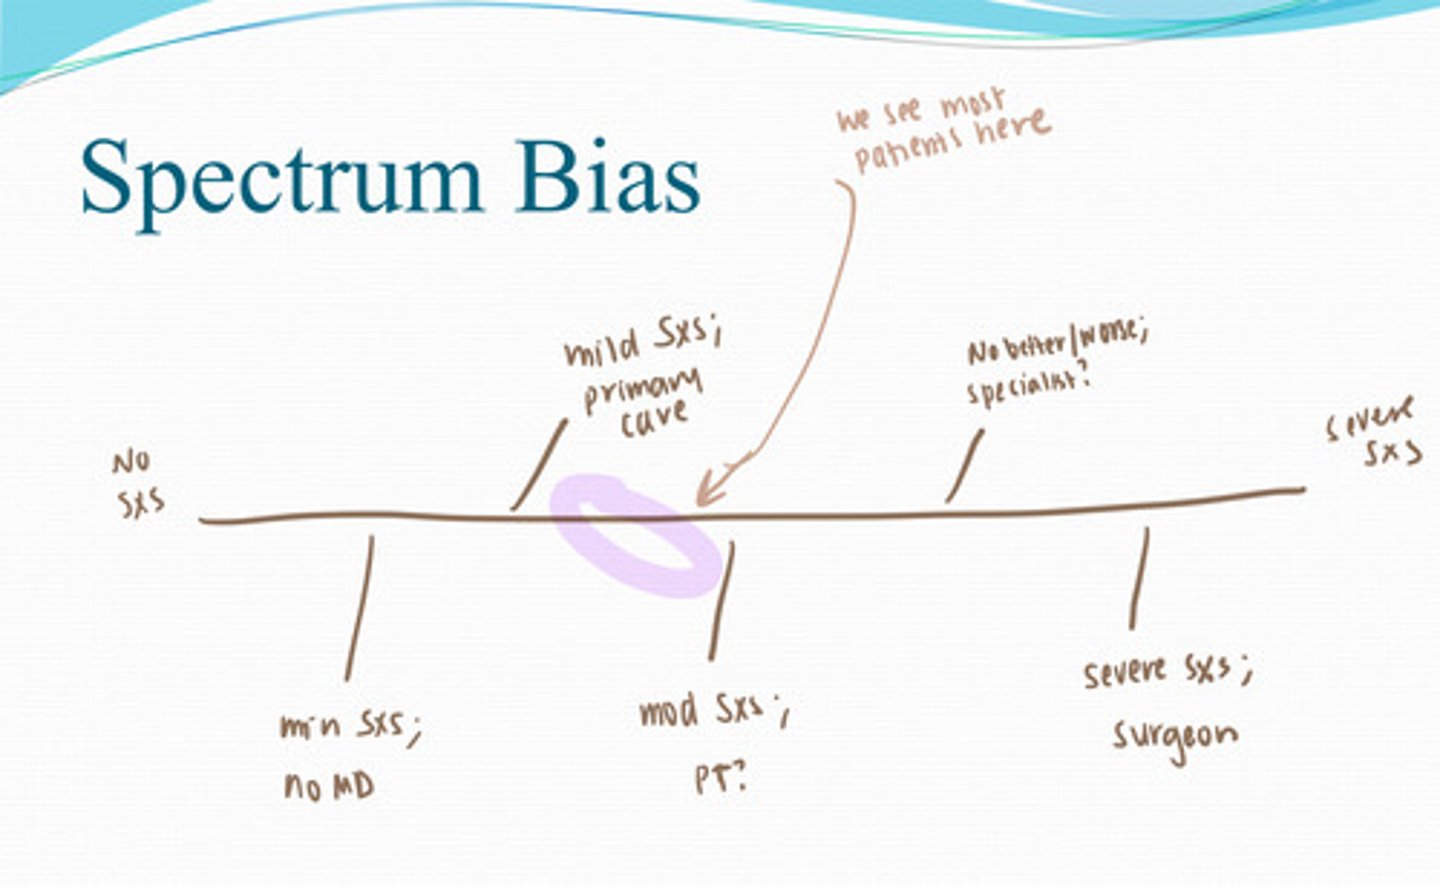
Spectrum Bias
effect a change in patient case mix may have on the performance of a test (makes the test look more accurate based on the population you use)
Which study has the highest risk for recall bias
Retrospective study
Systematic reviews have the risk for ____ bias
publication
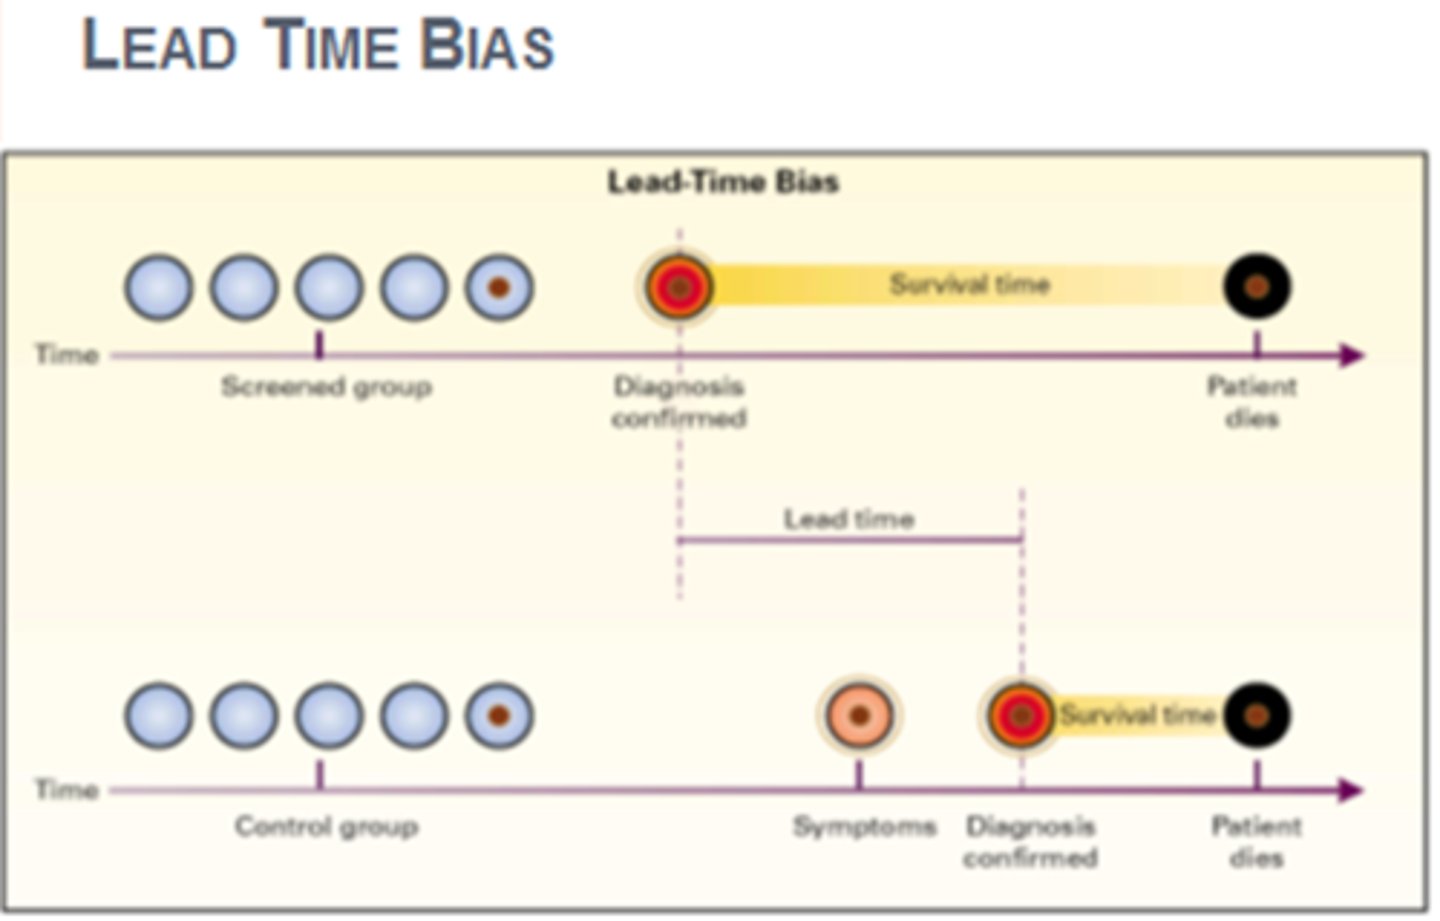
lead time bias
Bias introduced when screening detects a disease earlier and thus lengthens the time from diagnosis to death.
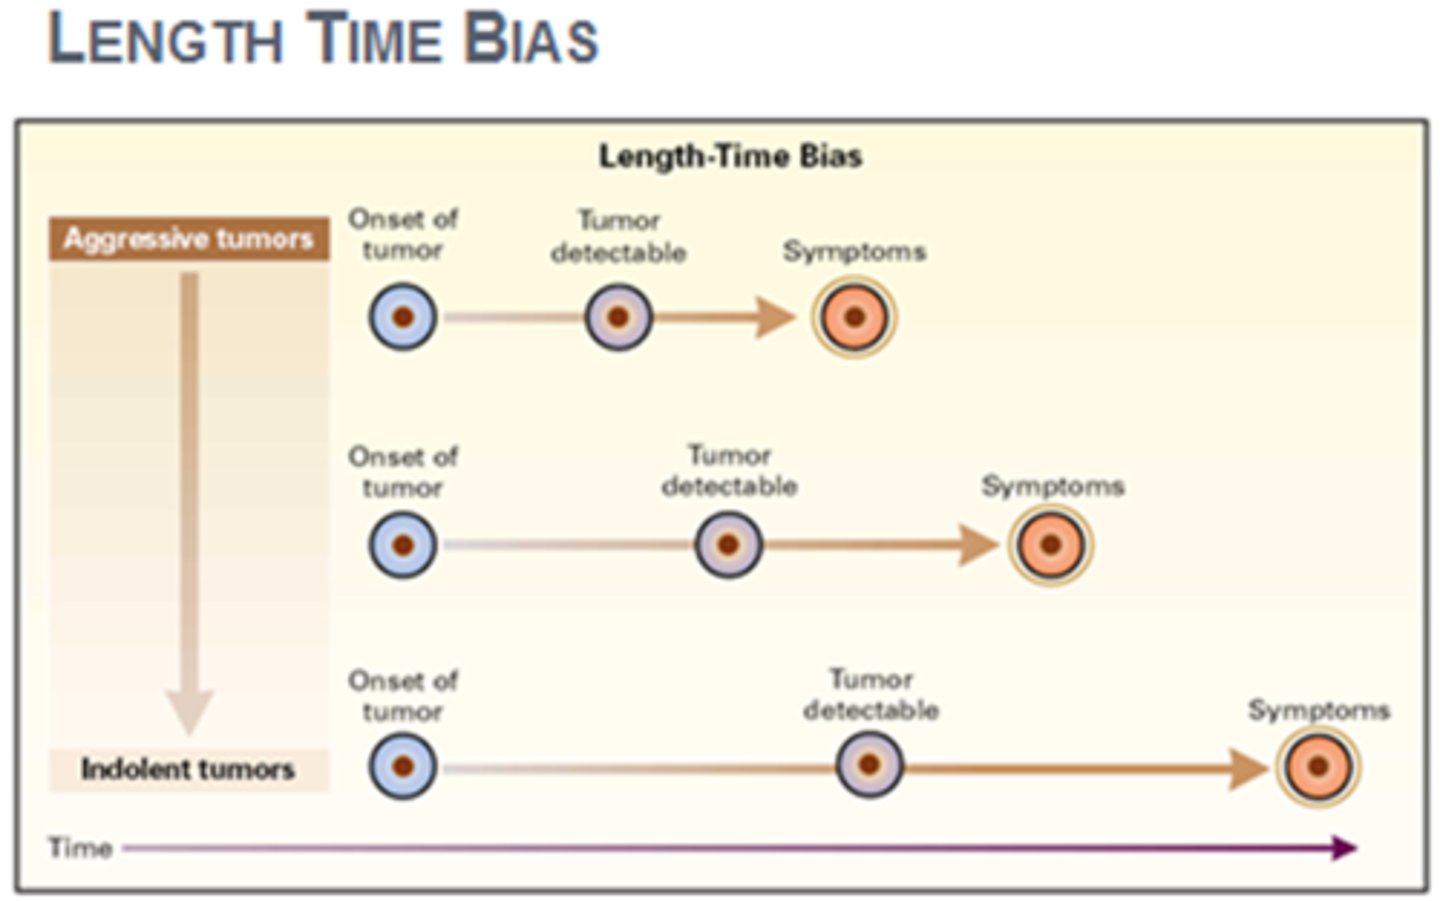
Length bias
A systematic error due to selection of disproportionate numbers of long-duration cases in one group but not in another.
Verification bias
Occurs when patients with negative test results are not evaluated with the gold standard test.
Selection bias
A polling error in which the sample is not representative of the population being studied, so that some opinions are over- or underrepresented
Reporter bias
when people don't want to reveal things that make them look bad; over-report things that make them look good; social desirability
Sensitivity
Proportion of true positives among those with disease (TP/TP + FN)
Specificity
Proportion of true negatives among those without disease. (TN/FP+ TN)
False Positive Rate
Rate of incorrect positive results; 1 - specificity.
False Negative Rate
Rate of incorrect negative results; 1 - sensitivity.
Positive Predictive Value (PPV)
Probability of disease given a positive test result (TP/TP + FP)
Negative Predictive Value (NPV)
Probability of no disease given a negative test result (TN/FN + TN)
Likelihood Ratio (LR)
Test result probability ratio for diseased vs non-diseased.
LR Interpretation
LR > 1 increases disease probability; LR < 1 decreases.
LR for Positive Test (LR+)
True positive rate divided by false positive rate
LR for Negative Test (LR-)
False negative rate divided by true negative rate
Pre-test Probability
Patient's likelihood of having a disorder before testing
Post-test Probability
Likelihood of having a disorder after test results.
SpPIN
High specificity; positive result rules in diagnosis.
SnNout
High sensitivity; negative result rules out diagnosis.
Incidence
•New cases of a disease in a population in a given time period
•Number of new cases / Population at risk for disease (disease or condition-free population)
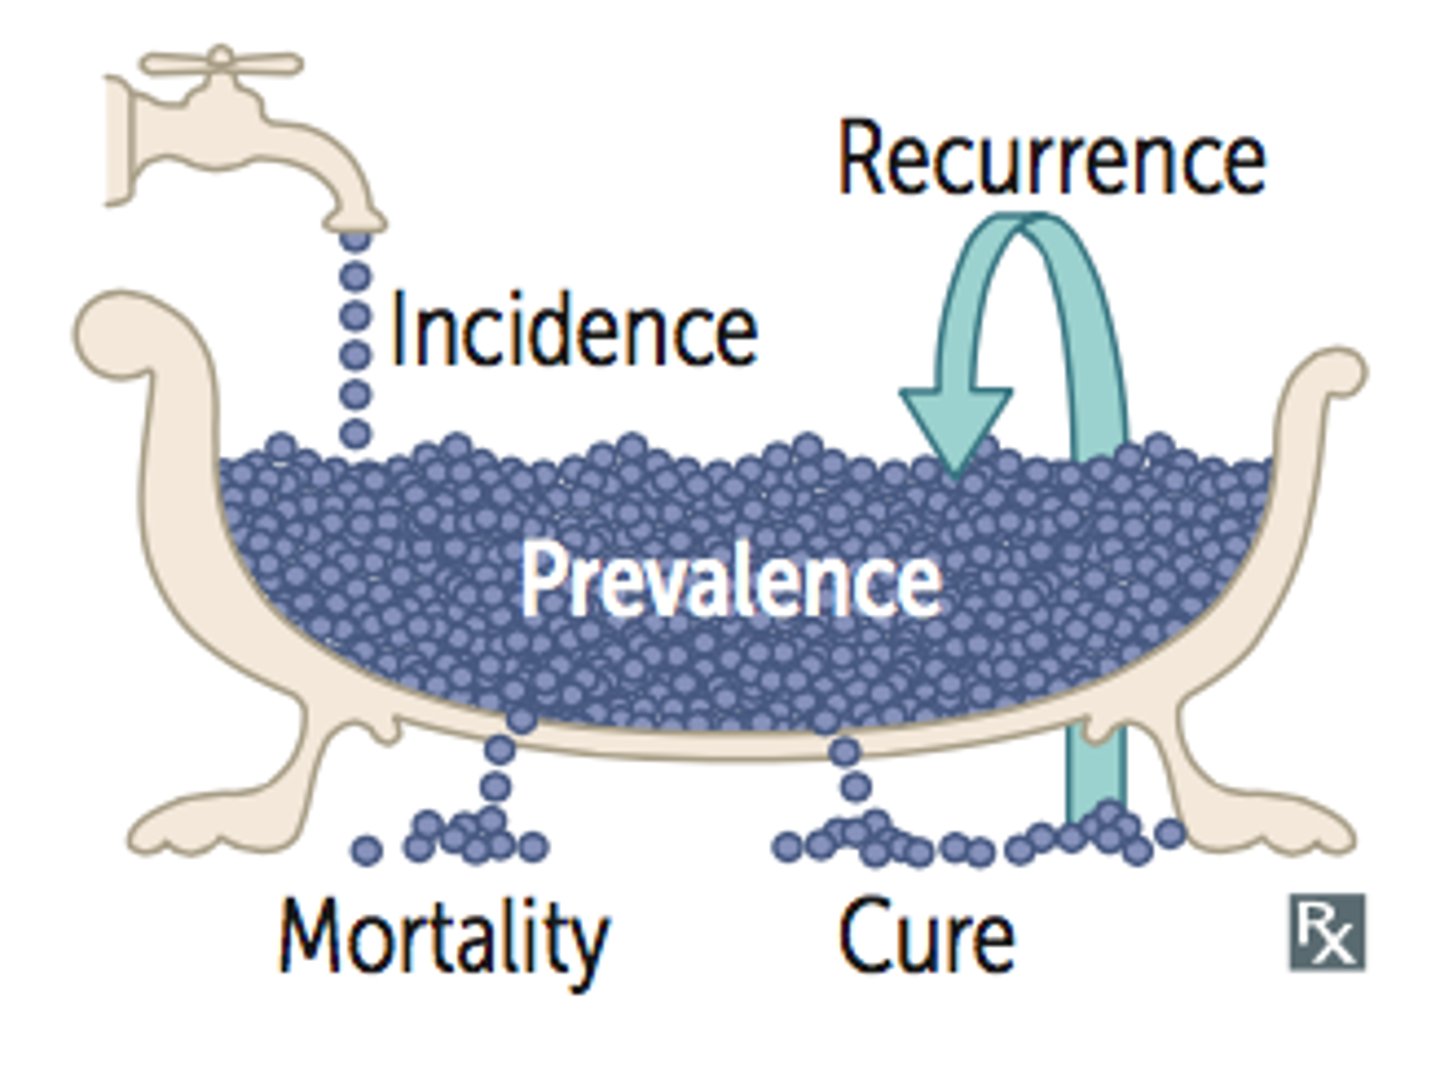
Prevalence
•Proportion of patients with a condition in a population
•Total number of cases / Population

Increased prevalence ______ PPV and _____ NPV
increases PPV and lowers NPV
ROC Curve
Graphical representation of test performance across thresholds.
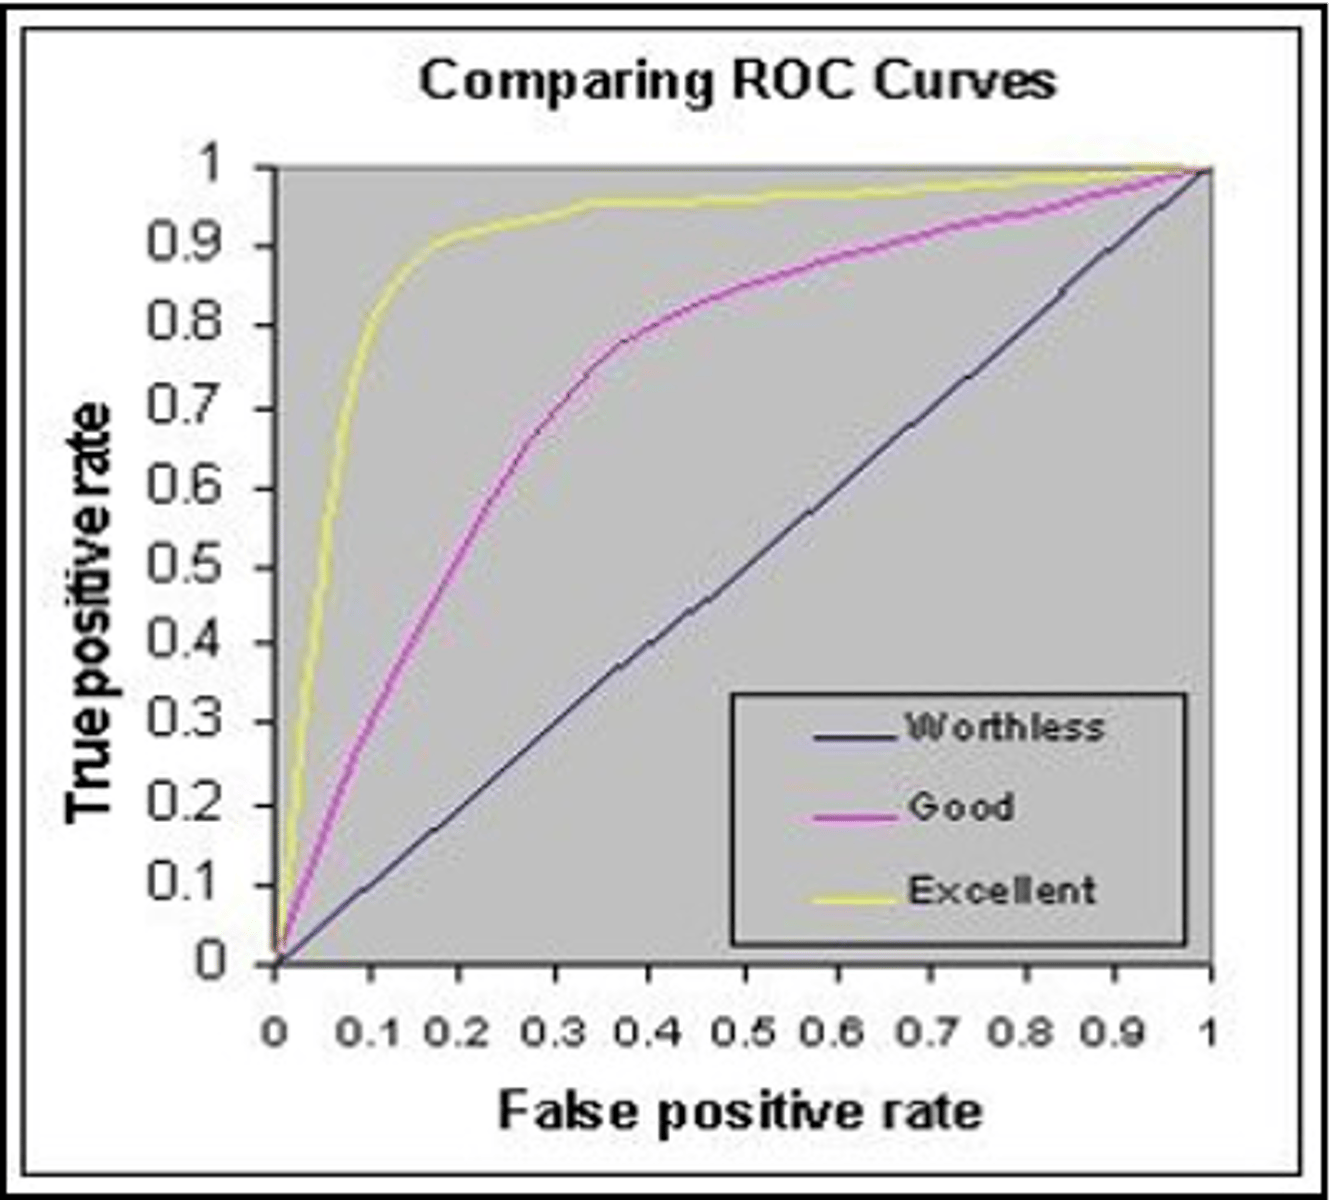
Receiver Operating Characteristic Curve
Graphical representation of sensitivity vs. specificity.
Area Under Curve (AUC)
Measures test accuracy; ranges from 0 to 1.
Perfect Test AUC would be
AUC of 1 indicates 100% sensitivity and specificity.
Worthless Test AUC would be
AUC of 0.5 indicates no diagnostic value.
Diagnostic Test Accuracy Classification
AUC ranges classify tests from excellent to fail.
Test Threshold
probabilities below which a clinician would dismiss a diagnosis and order no further tests
Treatment Threshold
probabilities above which a clinician would consider the diagnosis confirmed, and would stop testing. The treatment threshold is influenced by the costs/ benefits of the treatment and the invasiveness/ harm of the Dx test.
Likelihood Ratio definition
The likelihood that a given test result would be expected in a patient with the target disorder compared with the likelihood that the same result would be expected in a patient without the target disorder.
Likelihood ratio equation
probability of test result in individual w/ condition/probability of test result in individual without the condition
Likelihood ratio of positive test result (LR+) is
sensitivity/1-specificity
Likelihood ratio of negative test result (LR-) is
1-sensitivity/specificity
Likelihood Ratio Nomogram
Tool for calculating post-test probabilities visually.
A LR of ____ indicates that the pre- and post-test probabilities are the same
1
LR >____ increase the probability that the disorder is present
1
LRs >___ or <____ cause large changes in likelihood
>10 or <0.1
Framingham heart study was a
Cohort study
Qualitative Systematic Review
Summarizes primary study results without statistical combination.
Quantitative Systematic Review
Uses statistical methods to combine study results.
Steps in Systematic Review
Formulate question, search, assess, appraise, synthesize, report results
Homogeneity
Consistency of results across studies in review.
Heterogeneity
Variability in study results; assessed statistically.
I Squared (I2) Statistic
Measures percentage of total variation due to heterogeneity.
I2 value of 0% indicates that it is
totally homogeneous
Chi-squared/cochrane X2 test , the p value of ____ shows statistically significant heterogeneity
p= <0.1 shows statistically significant heterogeneity
Chi-squared Test
Tests statistical significance of heterogeneity.
Magnitude of Treatment Effect
Size of effect observed in systematic reviews.
The results of systematic reviews with continuous data are frequently presentaed as the
standard mean difference (0.2 small, 0.5 mod, 0.8 large)
Confidence Intervals (CI)
Range of values indicating uncertainty of an estimate.
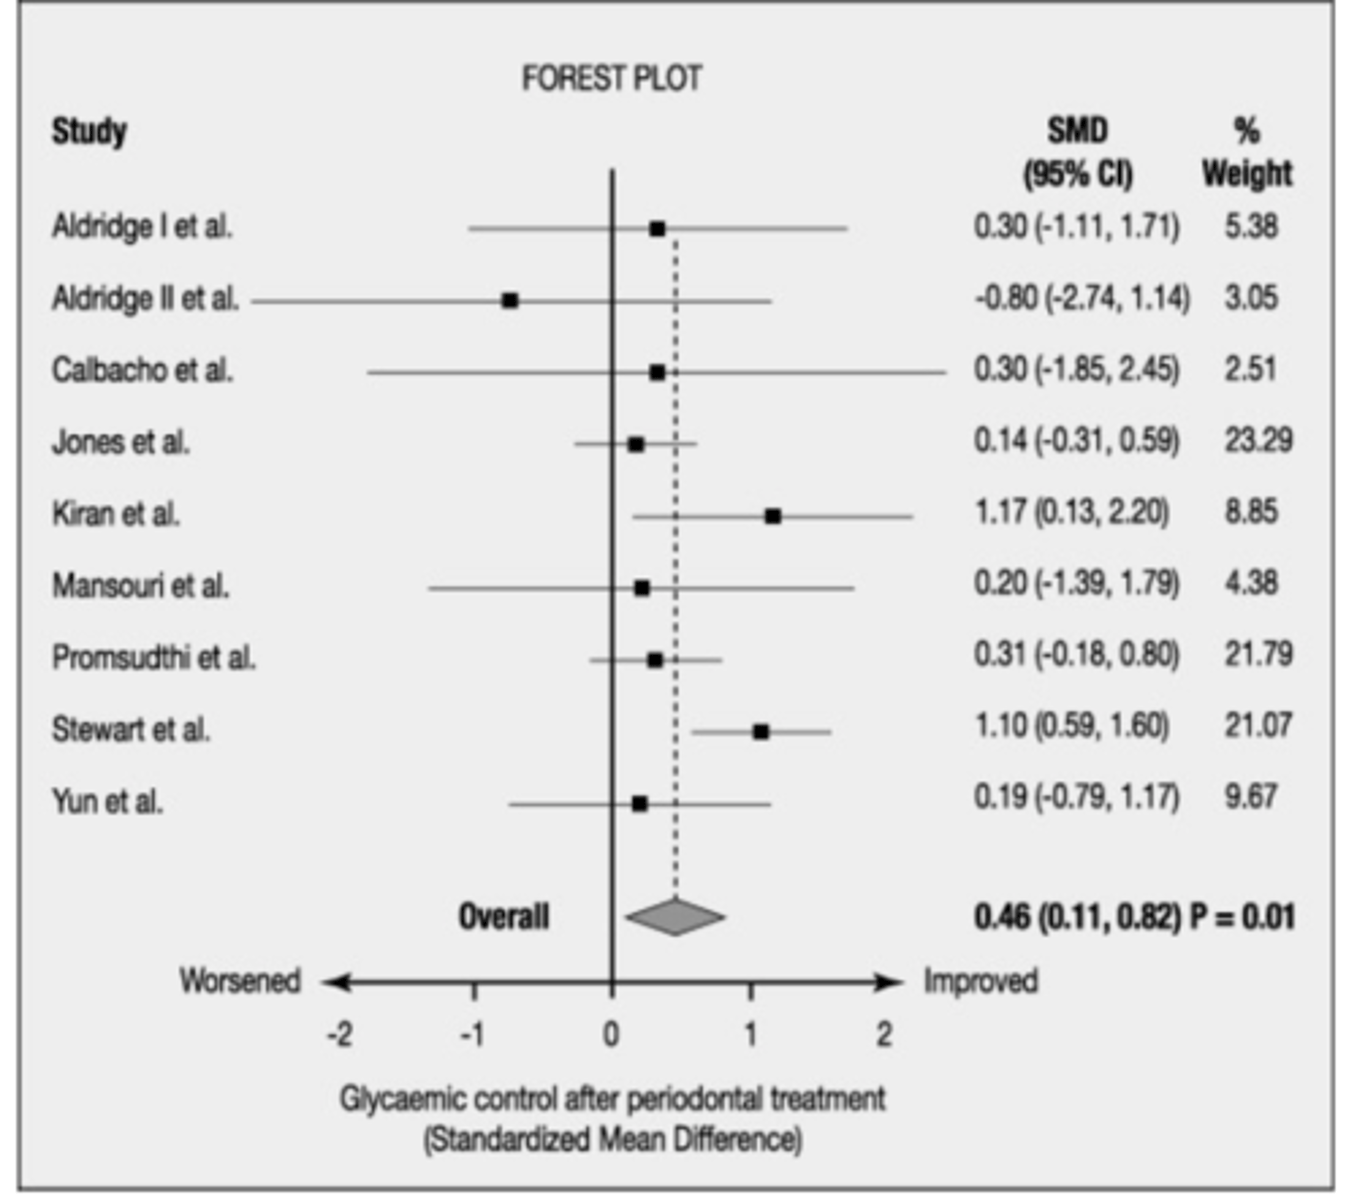
Forest Plot
Graphical display of results from meta-analysis

Does a heterogenous forest plot have more or less overlap of boxes
less overlap of the boxes