AP Environmental Science
1/65
There's no tags or description
Looks like no tags are added yet.
Name | Mastery | Learn | Test | Matching | Spaced |
|---|
No study sessions yet.
66 Terms
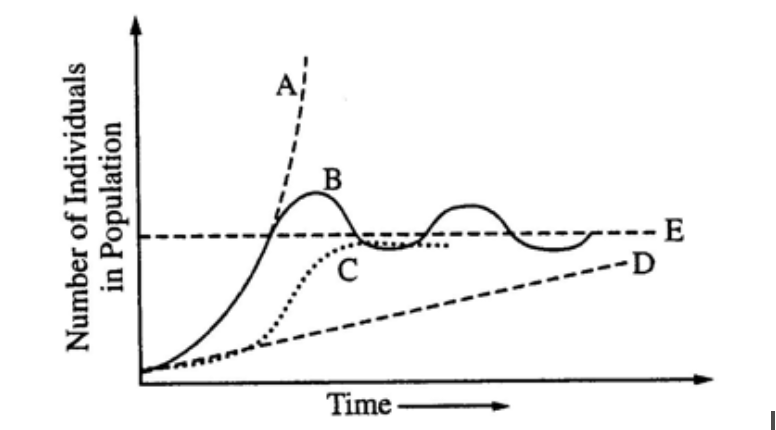
Which curve represents the maximum number of individuals that can be supported by a particular ecosystem on a long-term basis?
E

Which curve represents the biotic potential of the species without limiting factors?
A
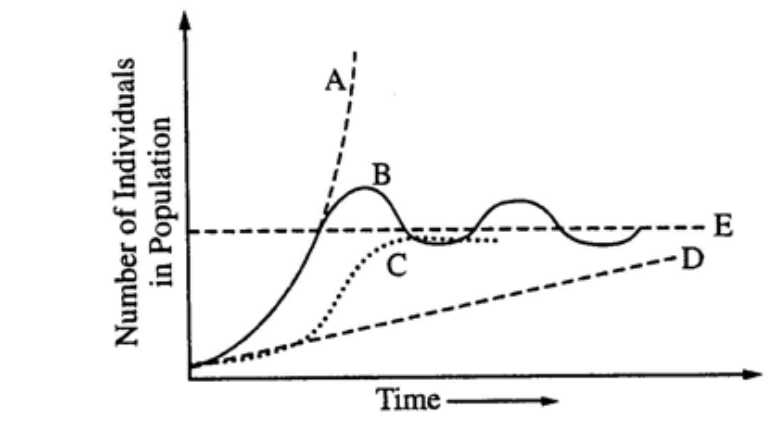
Which curve represents the growth of a population predicted by the logistic model?
C
Which situation best illustrates an abiotic component of the environment affecting a biotic component of the environment?
Composted manure is added to agricultural soil during spring tilling.
Coral reefs modify the direction of an ocean current.
Plants release O2 into the atmosphere during photosynthesis.
Low phosphorus content in the soil limits the growth of vegetation.
A thick planting of ground cover reduces soil erosion on a hillside.
Low phosphorus content in the soil limits the growth of vegetation.
Which factor can be used to assess the biological diversity of an area?
population size of each species and area occupied by each population
minimum population area and minimum viable population size
ratio of r-strategists to K-strategists and life expectancy of K-strategists
number of individuals younger than 15 years old and number of individuals older than 65 years old
genetic variation within each species and number of species present
genetic variation within each species and number of species present
Why do introduced species often become pests?
A. They displace native species.
B. They increase biodiversity.
C. They do not adapt well to local habitats.
D. They contribute to habitat fragmentation.
E. They have low biotic potential.
They displace native species.
In general, which long-term method is best for preventing extinctions?
A. breeding endangered species in captivity
B. protecting the habitats of endangered species
C. paying people not to kill endangered species
D. providing food to endangered species in the wild
E. removing predators from areas that contain endangered species
protecting the habitats of endangered species
The consumption of mosquitoes by bats and the control of flooding provided by tropical forests in mountainous areas of Central America are examples of
A. adaptive radiation.
B. ecosystem services.
C. evolution by natural selection.
D. ecological equilibrium.
E. positive feedback loops.
Ecosystem services
If the population of a country grows at a rate of approximately 5% per year, the number of years required for the population to double is closest to
A. 5 years.
B. 10 years.
C. 15 years.
D. 25 years.
E. 35 years.
15 years
Which concept explains why there are typically not more than four or five trophic levels in a food web?
A. the first law of thermodynamics
B. the second law of thermodynamics
C. the law of conservation of matter
D. the process of ecological succession
E. the limiting factors in the ecosystem
The second law of thermodynamics
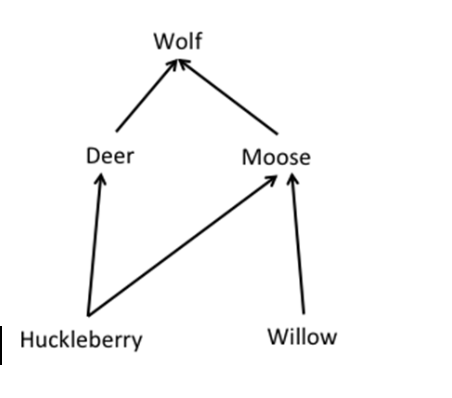
Using the food web diagram, which scenarios are possible?
I. Removal of wolves will cause an increase in huckleberries.
II. Decreasing the deer population will result in collapse of the wolf population.
III. Removal of willows will result in an increase in huckleberries
II only
The ultimate source of energy for terrestrial ecosystems is
A. nutrients in soil.
B. nutrients in vegetation.
C. primary consumers.
D. producers.
E. the sun.
The sun
In the transition from each trophic level of the food chain to the next trophic level, there is about a
A. 80%–95% gain of energy.
B. 2% gain of energy.
C. 80%–95% loss of energy.
D. 2% loss of energy.
E. 5%–20% loss of energy.
80%-95% loss of energy
In ecosystems, organisms at the highest trophic levels usually contain less collective biomass than the organisms at lower trophic levels because
A. organisms are inefficient at converting the energy they consume into biomass.
B. biomass shrinks as it rises.
C. top-level predators use so much energy to catch their food.
D. producers (for example, plants) tend to be heavier than consumers (for example, birds).
E. most of the solar energy hitting earth is reflected or reradiated into space.
organisms are inefficient at converting the energy they consume into biomass
Which characteristics tend to increase the risk of a species becoming endangered?
I. having a limited distribution
II. being a specialist at the end of a long food chain
III.having a large population size
I and II only
A city developed a forested area for housing, stores, and restaurants. Which row of data in the table shown below represents the most likely effects on parts of the water cycle in the area?
| Evaporation and Transpiration | Runoff | Groundwater and Recharge |
A. | Decrease | Increase | Decrease |
B. | Decrease | Increase | Increase |
C. | Decrease | Decrease | Increase |
D. | Increase | Increase | Decrease |
E. | Increase | Decrease | Decrease |
Decrease in evaporation, increase in runoff, decrease in groundwater and recharge
Road construction, logging, and mining are banned in which federal lands?
A. national parks
B. national wildlife refuges
C. national forests
D. national wilderness preservation areas
E. national resource lands
National wilderness preservation areas
All of the following are advantages to protecting biodiversity EXCEPT
A. it maintains unique ecosystems for recreational or aesthetic purposes.
B. it ensures access to potential new medications in healthy ecosystems.
C. it helps to reduce our dependence on the environment.
D. it ensures food security by maintaining a diversity of plant species.
E. it promotes healthy wildlife populations by maintaining genetic diversity.
It reduces our dependence on the environment
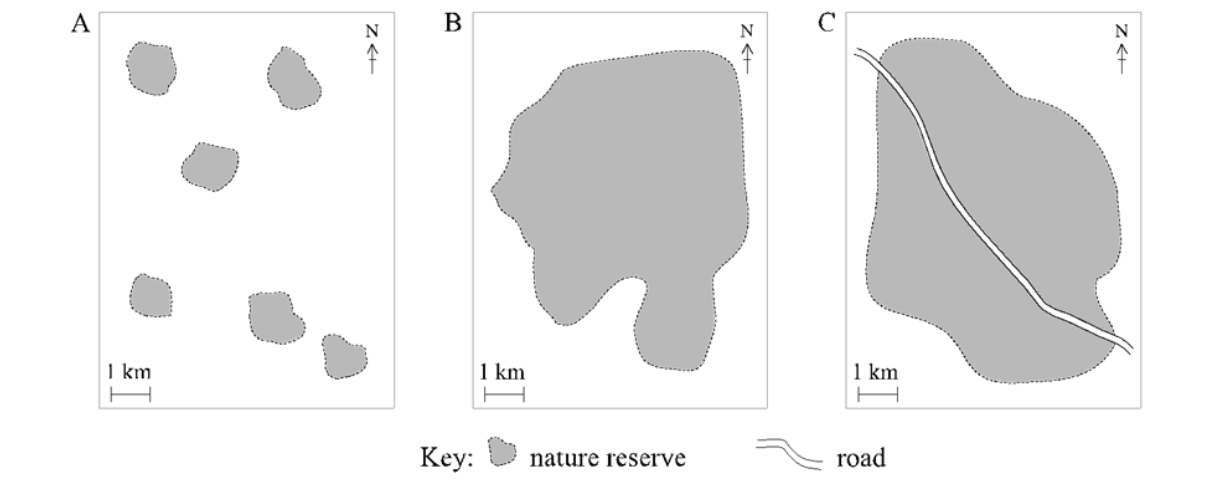
Which justification is appropriate for designing one of the three reserves shown in the diagram above?
A. Reserve A will allow for the greatest number of species to be preserved.
B. Reserve A will maximize the ability for organisms to travel.
C. Reserve B has the smallest edge effect and will have the least disturbance.
D. Reserve C has the largest area that will promote greater biodiversity.
E. Reserve C has a road to improve migration corridors for organisms.
Reserve B has the smallest edge effect and will have the least disturbance
Which statement about succession is true?
A. Succession is change that occurs in an ecosystem only after there has been a disturbance.
B. Succession stops happening once an ecosystem reaches its community climax.
C. Succession is a change in structure that occurs naturally over time in all ecosystems.
D. Succession is the process of decomposition in an ecosystem.
E. all of the above
Succession is a change in structure that occurs naturally overtime in all ecosystems
A large forested area is fragmented into small forest tracts separated by agricultural areas. This change will most likely lead to
A. an increase in the population of top carnivores.
B. an improvement in the dispersal mechanisms of forest species.
C. a more stable regional climate.
D. a decrease in the amount of edge habitat.
E. a decrease in the gene flow within species of the original forest.
A decrease in the gene flow within species of the original forest
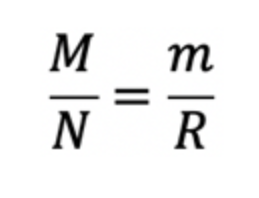
To measure the population density of chipmunks occupying a particular park, you sample several quadrants and capture 50 chipmunks. You mark each chipmunk with a small dot of red paint on its back and then release all of them. The next day, you capture 50 chipmunks again. Of the 50 chipmunks you catch today, 10 are marked.
Using the mark recapture formula shown below, how many chipmunks do you estimate the population contains?
Where
M = Number of animals captured and marked in first sample
N = Estimated population size
m = Number of "R" that were already marked
R = Number of animals captured in all resampling events
250
Which biome has the highest net primary productivity?
A. tropical rainforest
B. coniferous forest
C. temperate grassland
D. tundra
E. woodland
Tropical Rainforest
The net annual primary productivity of a particular savanna ecosystem is found to be 3,000 kcal/m2 per year. If respiration by the producers is 4,500 kcal/m2 per year, what is the gross annual primary productivity for this ecosystem, in kcal/m2 per year?
A. 1,500
B. 3,000
C. 4,500
D. 7,500
E. 13,500
7500
Which of the following is a characteristic of nonrenewable energy sources that distinguishes them from renewable energy sources?
Responses
The construction of power plants that use nonrenewable energy sources is typically more expensive than the construction of those that use renewable energy sources.
The construction of power plants that use nonrenewable energy sources is typically more expensive than the construction of those that use renewable energy sources. - no response given
Nonrenewable energy sources are typically less harmful to wildlife and ecosystems than renewable energy sources are.
Nonrenewable energy sources are typically less harmful to wildlife and ecosystems than renewable energy sources are. - no response given
Nonrenewable energy sources typically require additional new technology in order to be used than renewable energy sources do.
Nonrenewable energy sources typically require additional new technology in order to be used than renewable energy sources do. - no response given
Nonrenewable energy sources typically take a longer time to replenish than renewable energy sources do.
Nonrenewable energy sources typically take a longer time to replenish than renewable energy sources do.
Which of the following explains why some energy sources are renewable?
Responses
Renewable energy sources exist in a fixed amount and cannot be easily replaced.
Renewable energy sources exist in a fixed amount and cannot be easily replaced. - no response given
Renewable energy sources can be replenished naturally, at or near the rate of consumption.
Renewable energy sources can be replenished naturally, at or near the rate of consumption. - not selected, this is the correct answer
Renewable energy sources include natural gas and other fossil fuels because they are made from the remains of ancient organisms.
Renewable energy sources can be replenished naturally, at or near the rate of consumption
Although nuclear energy is considered a cleaner energy source than fossil fuels, some scientists argue this does not support the claim that nuclear energy is renewable. Which of the following claims best supports the argument that nuclear energy is a nonrenewable energy source?
Responses
Nuclear energy has low carbon emissions and does not contribute to global warming.
The uranium deposits on Earth are finite.
Nuclear energy is generated by the process of nuclear fission.
The uranium deposits on Earth are finite
One example of the tragedy of the commons occurs when trees are harvested from tropical rain forests without any regulations. Which of the following best describes why this is an example of the tragedy of the commons?
Responses
Tropical rain forests have a thin layer of decaying organic matter and relatively low nutrient levels slowing tree growth.
Trees are an important resource, but not all individuals can access the resource.
Timber producers remove as much timber as possible as cheaply as possible.
Timber producers remove as much timber as possible as cheaply as possible
Many communities experience the tragedy of the commons.
One way a local community might regulate a shared and limited resource and reduce the tragedy of the commons is to
Responses
eliminate ownership of the resources and make them available to all
reduce the cost of access to the resources
offer subsides to users of the resources in the form of tax breaks
divide the resources into parcels and assign them to individuals
Divide the resources into parcels and assign them to individuals
Which of the following scenarios best explains the concept of the tragedy of the commons?
Responses
A
Fish farming, a type of aquaculture, produces fish through selective breeding to produce a cheap source of protein, reducing the fishing pressure on wild stock fish.
B
A collapse of the fishing industry leads to a loss of fishing-related jobs, which will have negative consequences on the economy.
C
Declines in the fish population lead to a decline in the population of fish predators, affecting the entire food chain.
D
Fish are shared resources, and as the fishing industry competes for the fish, the resource extraction is no longer sustainable.
Fish are shared resources, and as the fishing industry competes for the fish, the resource extraction is no longer sustainable.

For the diagram below, assume fracking has not been used with the oil and gas well.
Rock layer that must be rich in organic matter that was subjected to heat and pressure over time during the formation of oil and natural gas.
Responses
A
B
C
D
D

Rock layer that can be porous but must have very low to no permeability
Responses
A
B
C
D
B
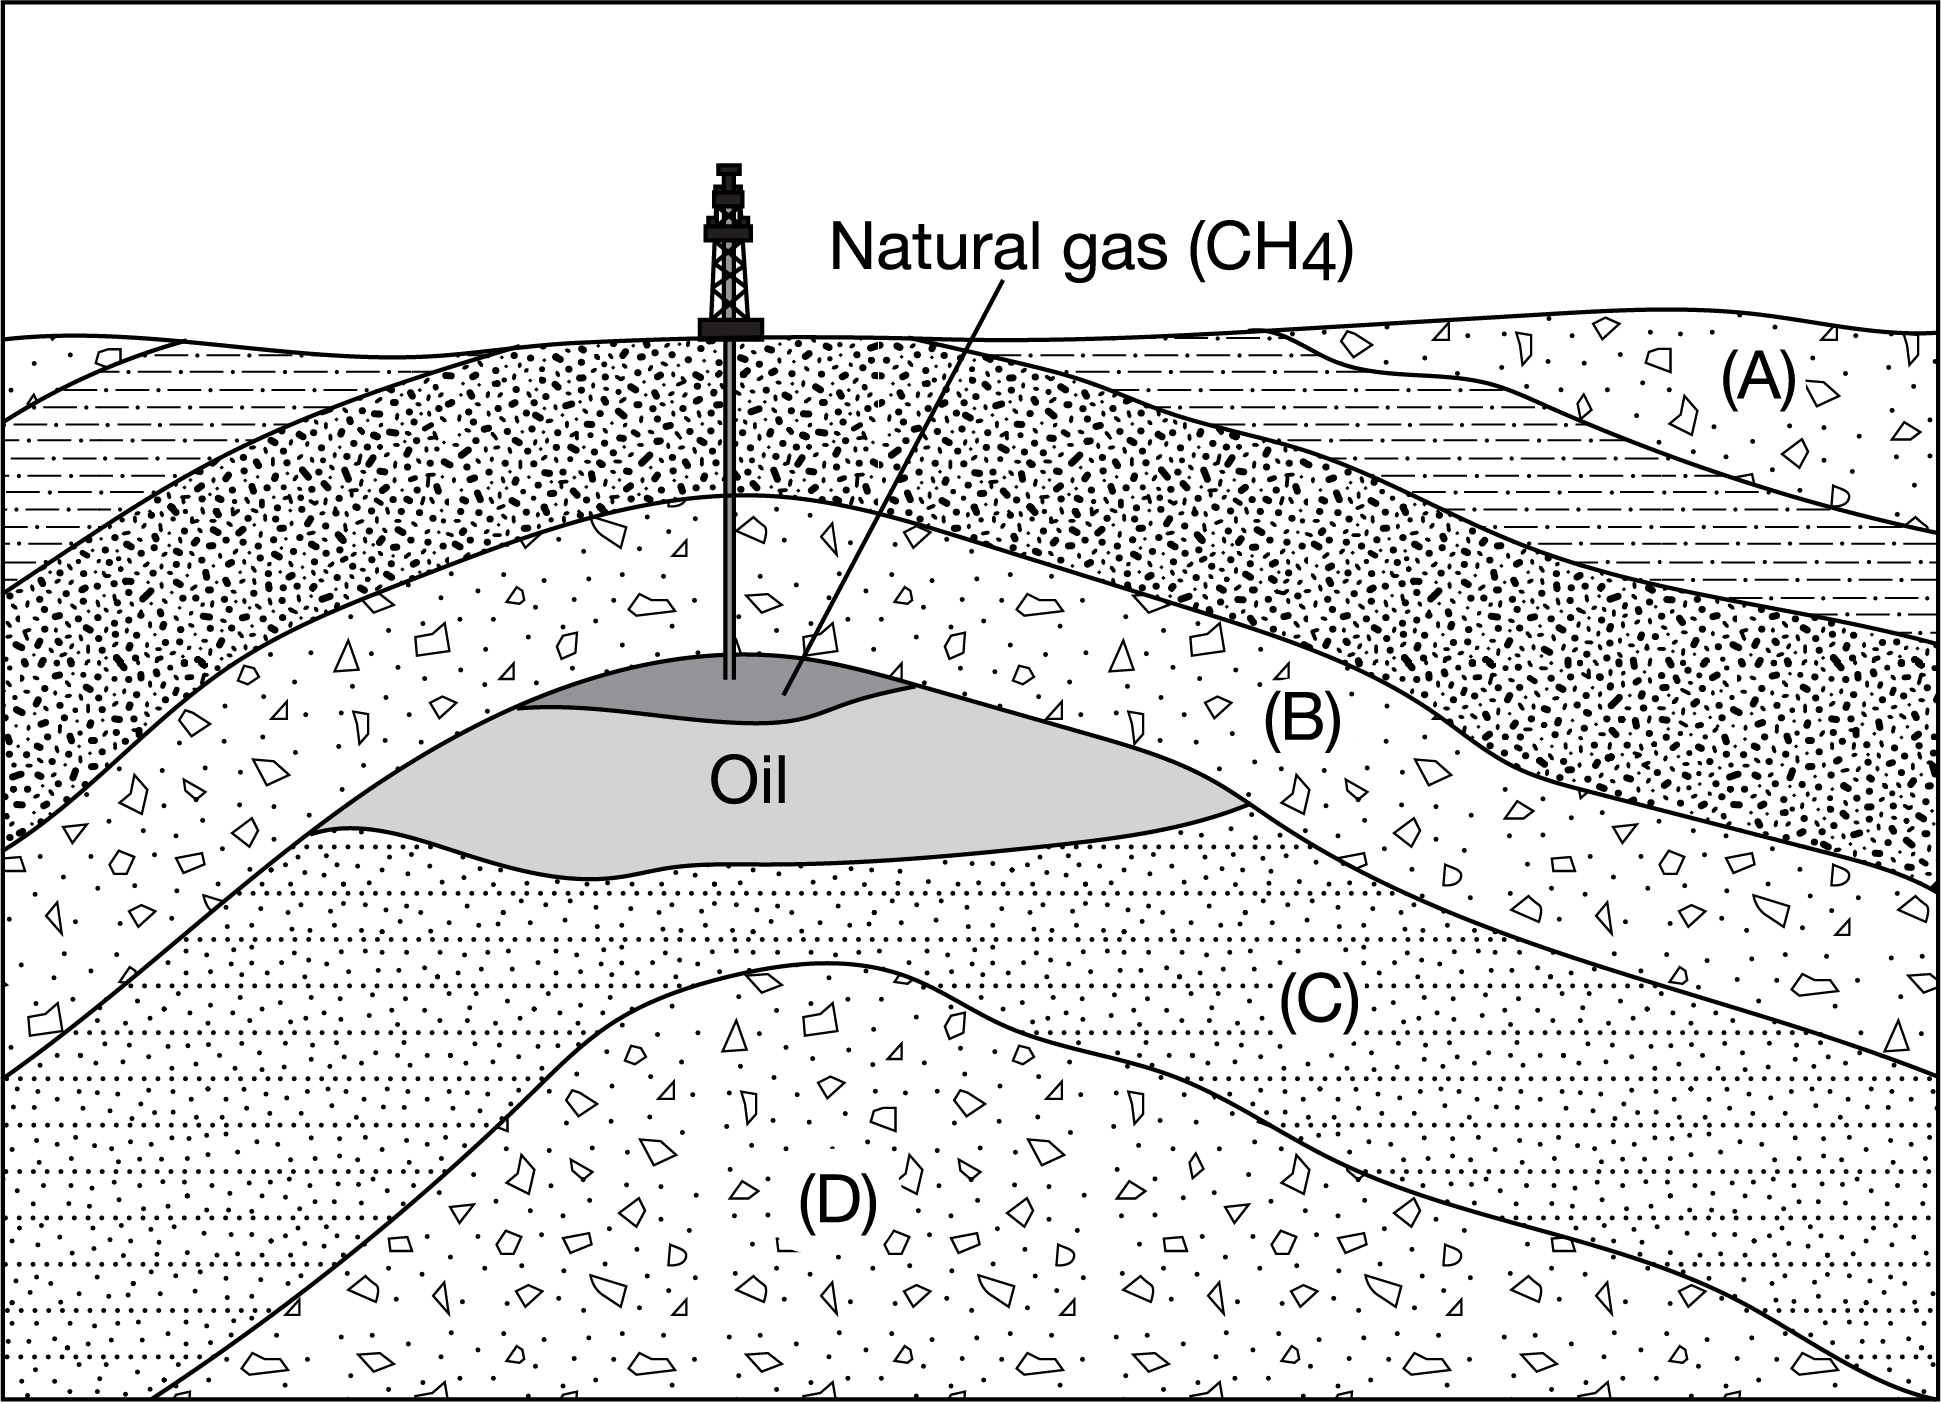
Rock layer that must be porous and have enough permeability for fluid to move through the layer
Responses
A
B
C
D
C
In an apartment building, exhaust from a gas-powered electrical generator is captured to produce hot water to heat a swimming pool. Which of the following is illustrated by this process?
Responses
A
Synergy
B
Cogeneration
C
Synfuels
D
Energy recovery
Cogeneration
Which of the following best describes the conditions under which peat is formed?
Responses
A
Partially decayed vegetation is placed under low-pressure, aerobic, acidic conditions.
B
Partially decayed vegetation is placed under high-pressure, anaerobic, alkaline conditions.
C
Partially decayed vegetation is placed under high-pressure, anaerobic, acidic conditions.
D
Partially decayed vegetation is placed under low-pressure, aerobic, alkaline conditions.
Partially decayed vegetation is placed under high-pressure, anaerobic, acidic conditions.
Purity is a major factor in determining the type of coal used for energy. Which of the following types of coal are correctly paired with a description of its purity and common use?
Responses
A
Anthracite is considered the highest grade coal because it is almost pure carbon, and it is often used for domestic heating.
B
Coking coal is most widely available and contains 60-86% carbon, which makes it ideal for use in coal power plants.
C
Steam coal has a high carbon content with low amounts of impurities, which makes it ideal for use in the steel industry.
D
Lignite is the most mature and purest form of coal, and it is often used for large-scale power generation.
Anthracite is considered the highest grade coal because it is almost pure carbon, and it is often used for domestic heating.
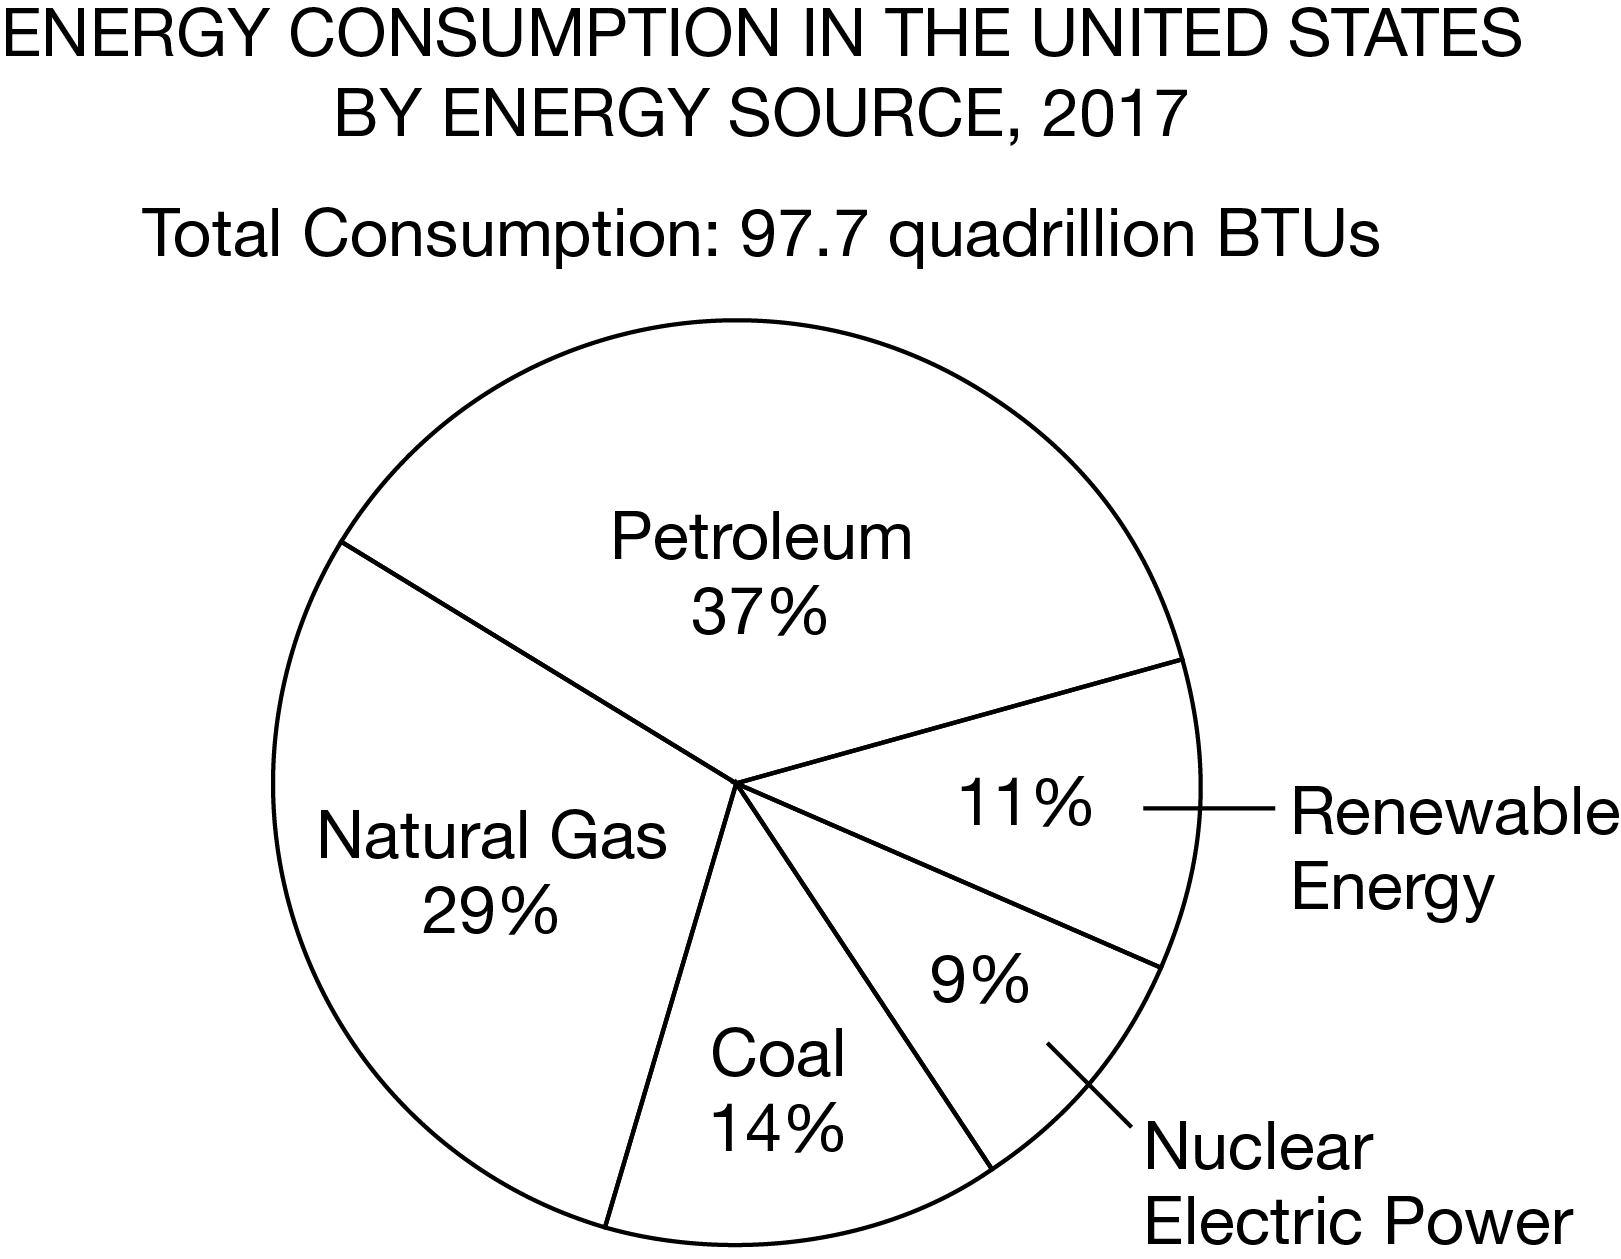
How many were consumed in the United States in 2017 by consumers that used petroleum as a fuel source?
Responses
A
28 quadrillion BTUs
B
36 quadrillion
C
62 quadrillion
D
96 quadrillion
36 Quadrillion BTUs
The table below shows regional electricity demands in 2016 and projected demands in 2040.
Total Electricity Demand (terawatt hours) | ||
|---|---|---|
Region | 2016 | 2040 |
Africa | 655 | 1707 |
United States | 3886 | 4570 |
China | 5320 | 9230 |
European Union | 2857 | 3178 |
Southeast Asia | 837 | 1997 |
Middle East | 910 | 1798 |
India | 1102 | 3606 |
Which of the following correctly pairs a region with its percent increase in electricity demand between 2016 and 2040?
Responses
A
Africa; 61%
B
United States; 0.17%
C
China; 158%
D
India; 227%
India
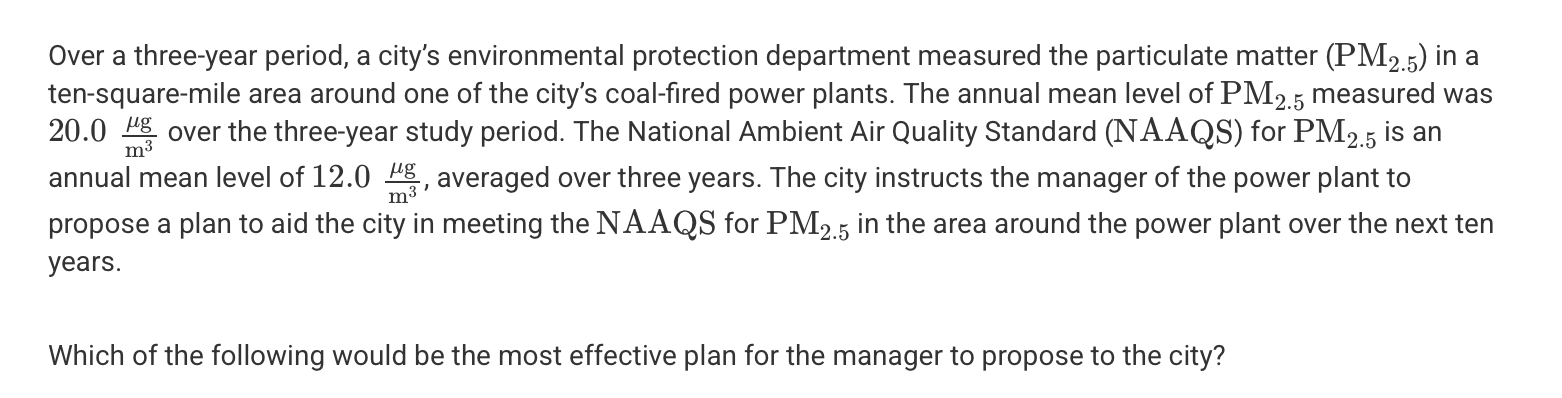
A family of four lives in a three-bedroom house and uses an average of of electricity per month. The family cools their house for three months during the summer with two window-unit air conditioners that each use of electricity per month. Which of the following is the percentage of the family’s total annual electricity that is used to run the two air conditioners for the three summer months?
Responses
A 9.6%
B 19.4%
C 38.8%
D 77.8%
19.4%
Which of the following sources should be examined in a study to determine the impact of a geologic source on levels of in the atmosphere?
Responses
A
Photosynthesis
B
Cellular respiration
C
Decomposition
D
Volcanoes
Volcanoes
A student is setting up a model to study the carbon cycle and natural sources of carbon dioxide. They create a microenvironment that contains soil, leaf debris, an earthworm, heterotrophic bacteria, and a sun lamp. What natural source of carbon dioxide and major metabolic process was left out of the model?
Responses
A
There is no representation of decomposition in the model environment.
B
There is no representation of cellular respiration in the model environment.
C
There is no representation of photosynthesis in the model environment.
D
There is no representation of ingestion in the model environment.
There is no representation of photosynthesis in the model environment.
Scientists have been monitoring in the atmosphere from Mauna Loa in Hawaii since 1958. Which of the following units is used by scientists to measure in the atmosphere?
Responses
A
Dobson units
B
Percent saturation
C
Parts per million
Parts per million

The graph below depicts the various components of smog for a densely populated urban area in the Northern Hemisphere. Each plotted line is a different component of smog.
Which of the curves on the graph depicts the concentration of ozone, which requires sunlight to form?
Responses
A
B
C
D
C
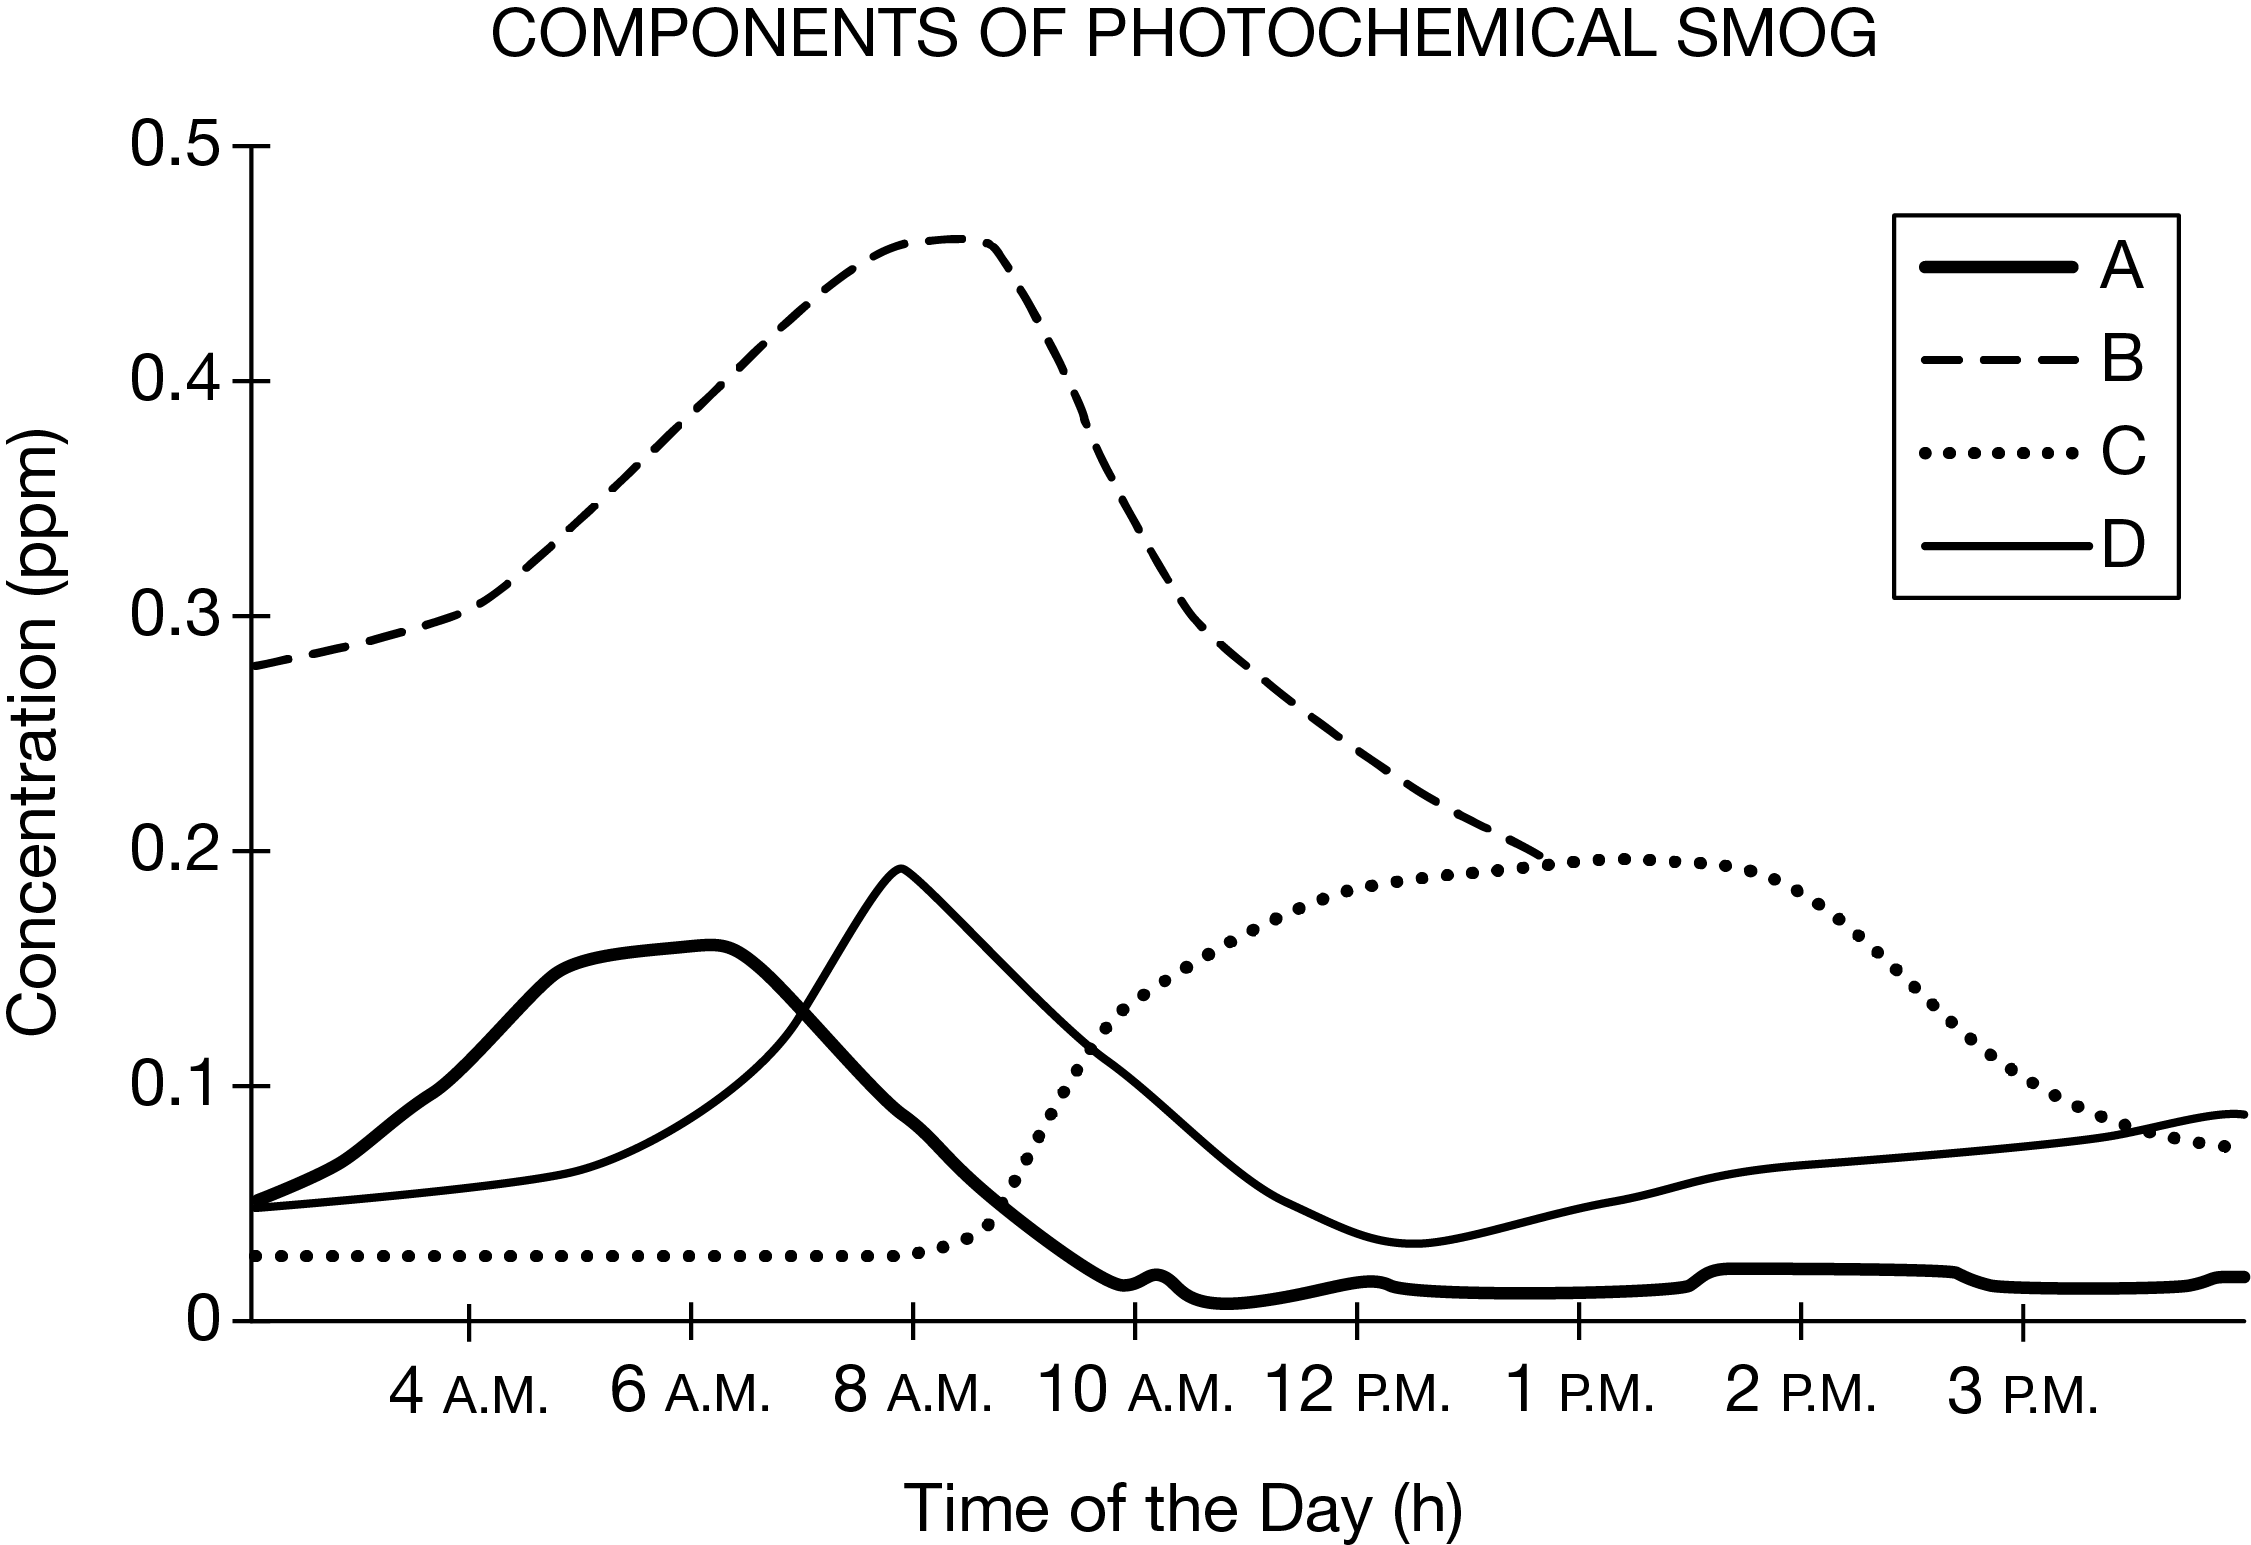
The data that were used to create this graph were collected in the winter. Which of the following best describes how the graph would be different if the data were collected in the middle of the summer?
Responses
A
The peaks for every data line would be at a lower concentration.
B
Concentrations for component C would be higher throughout the graph.
C
Concentrations for all the data lines would be the horizontal throughout the day.
D
Components A, B, and D would peak in the afternoon instead of in the morning.
Concentrations for component C would be higher throughout the graph.

Which of the different components of smog depicted in the graph are most likely released from automobile exhaust?
Responses
A
A and B
B
B and C
C
A, B, and C
D
B,C , and D
A and B
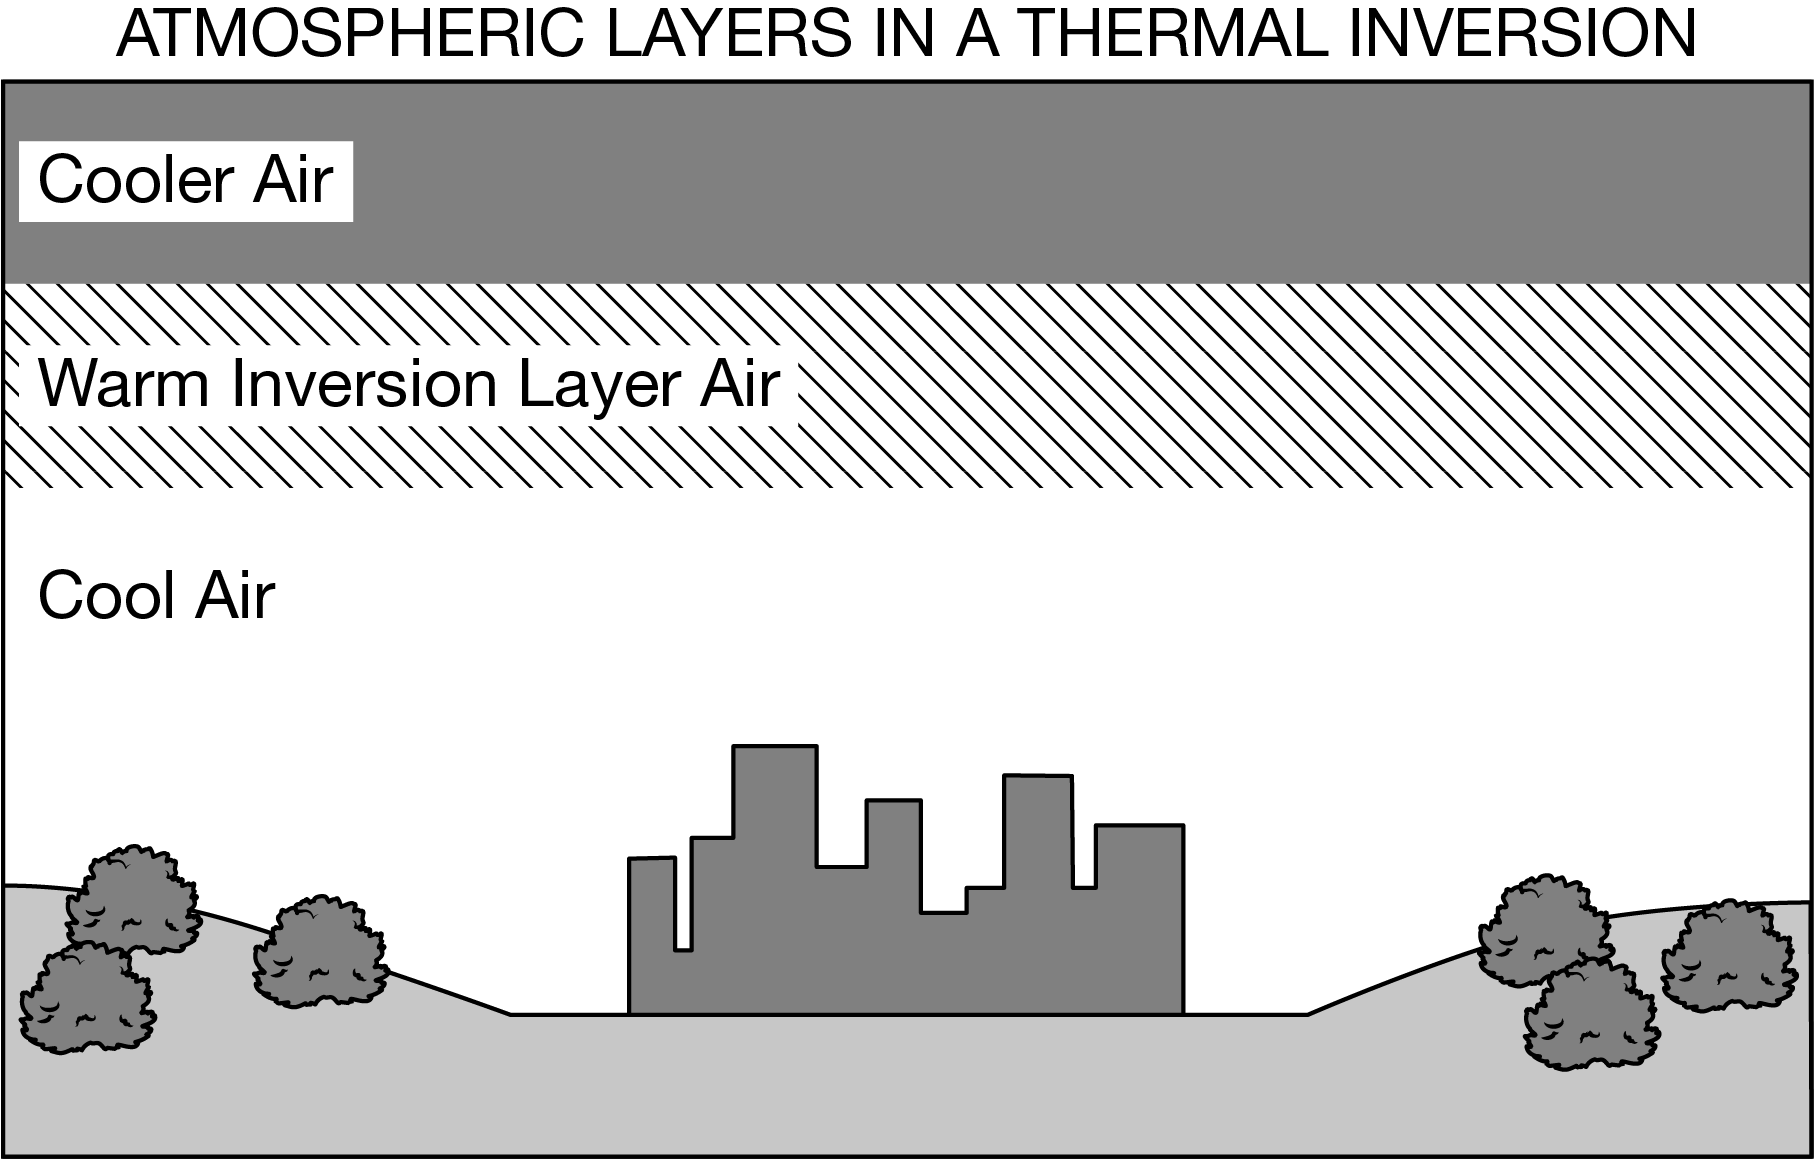
If the air layers in the diagram were relabeled to illustrate normal atmospheric conditions, the correct labeling from the air layer closest to the Earth’s surface to the one farthest from the Earth’s surface would be
Responses
A
cool air, cooler air, warm air
B
warm air, cool air, cooler air
C
cooler air, warm air, cool air
D
cooler air, cool air, warm air
warm air, cool air, cooler air

Based on the layers in the diagram, which of the following best explains why a thermal inversion tends to concentrate pollutants in the air layer closest to the Earth’s surface?
Responses
A
The air layer that is the second closest to the Earth’s surface is less dense than the layer above it.
B
The inversion layer is warmer than the air layer that is farthest from the Earth’s surface.
C
The air layer closest to the Earth’s surface is denser than the layer above it.
D
The air layer that is farthest from the Earth’s surface contains the coolest air.
The air layer closest to the Earth’s surface is denser than the layer above it.
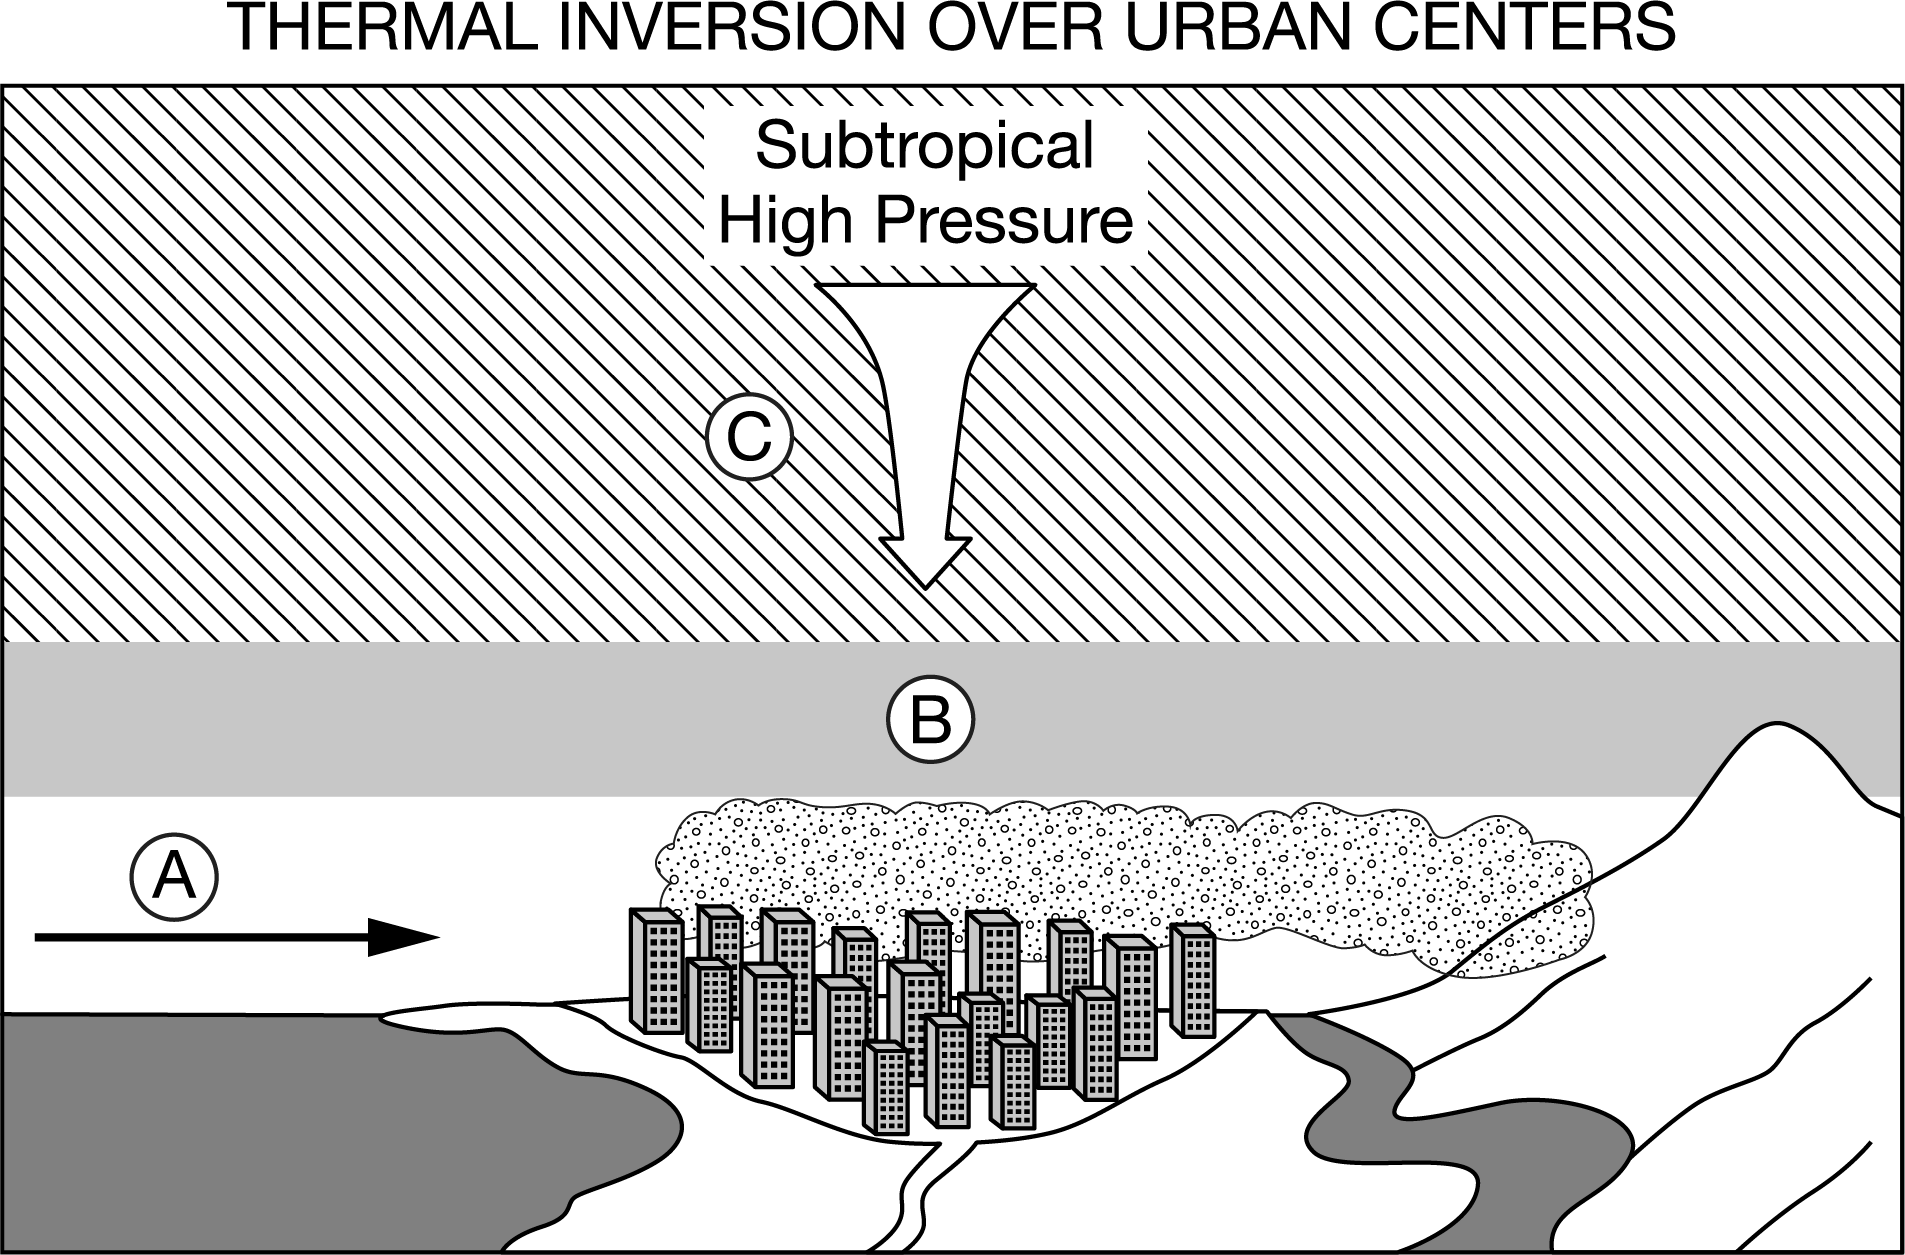
In the figure above, the letters , , and represent the different thermal layers present in an inversion. Which of the following shows the correct sequence of thermal layers as one moves vertically upwards from the surface of Earth?
Responses
A
Warm sea breeze Cool Warm
B
Warm sea breeze Warm Cool
C
Cool sea breeze Warm Cool
D
Cool sea breeze Cooler Coolest
Cool sea breeze Warm Cool
In many parts of the United States, homeowners use a significant portion of their energy budget to heat their home in the winter. It has been determined that lowering a thermostat by in the winter can reduce the energy costs by about percent in many homes. An individual homeowner lowers their thermostat by degrees exactly halfway through the billing period. For the month that the thermostat was lowered, the heating bill was .
How much money did the family save in the month in which they lowered the thermostat setting halfway through the billing period?
Responses
A 2.85
B 5.00
C 9.50
D 10.00
$5.00
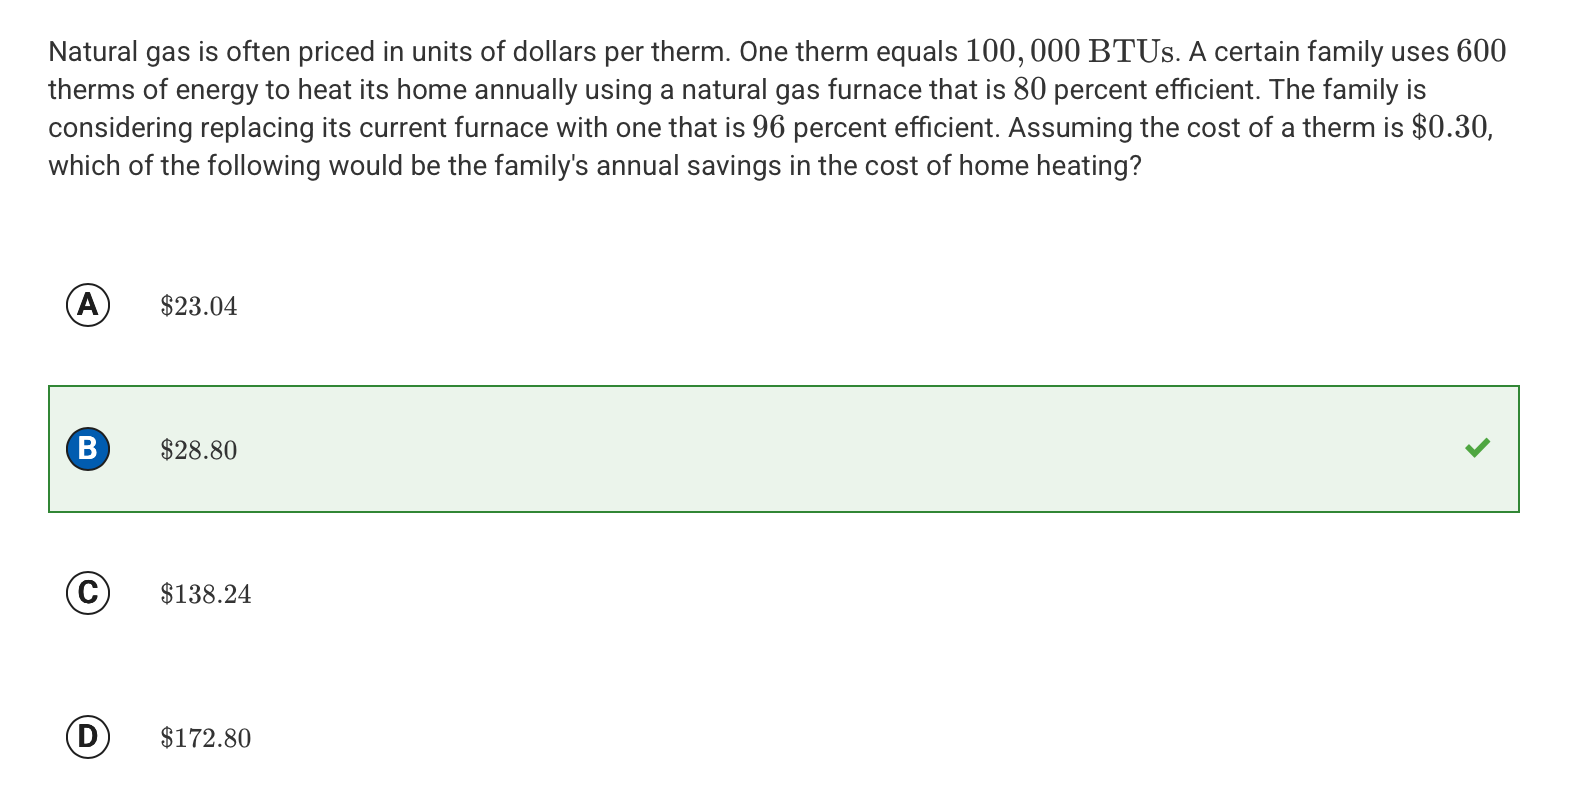
28.80
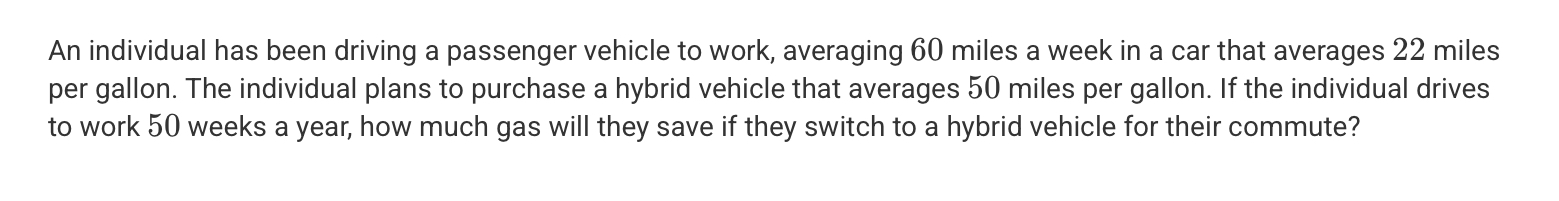
26 gallons
60 gallons
76 gallons
107 gallons
76 gallons
Which of the following best describes an environmental problem associated with hydrologic fracturing, or fracking?
Responses
A
Fracking has led to an increase in the production of oil and natural gas, lowering energy prices.
B
Fractures in the shale will close up once the fracking fluid is removed unless fine particles, like sand, are introduced to hold them open.
C
The products of fracking release more carbon dioxide and sulfur compounds into the atmosphere than other fossil fuels.
D
Fracking fluids can escape from the drill hole and contaminate surface water and groundwater.
Fracking fluids can escape from the drill hole and contaminate surface water and groundwater.
Which of the following statements correctly explains the role of fossil fuels in the production of energy?
Responses
A
The combustion of fossil fuels heats water to produce steam, which then turns a turbine.
B
The steam released from the combustion of fossil fuels turns a generator, which then powers a turbine.
C
The heat released from burning fossil fuels rises and turns a turbine, which then releases carbon dioxide.
D
Steam produced from a turbine ignites the fossil fuels, which then powers the generator.
The combustion of fossil fuels heats water to produce steam, which then turns a turbine.
Which of the following describes an environmental problem that can result from the combustion of fossil fuels to generate electricity?
Responses
A
A chemical reaction occurs between the fossil fuel and oxygen to produce energy for the generation of electricity.
B
Carbon dioxide is a product of the combustion fossil fuels, and it can lead to global climate change when released into the atmosphere.
C
The combustion of fossil fuels can heat water to convert the water into steam to turn turbines that are connected to electrical generators.
D
Combustion reactions using fossil fuels require more energy than they produce and are therefore very inefficient.
Carbon dioxide is a product of the combustion fossil fuels, and it can lead to global climate change when released into the atmosphere.
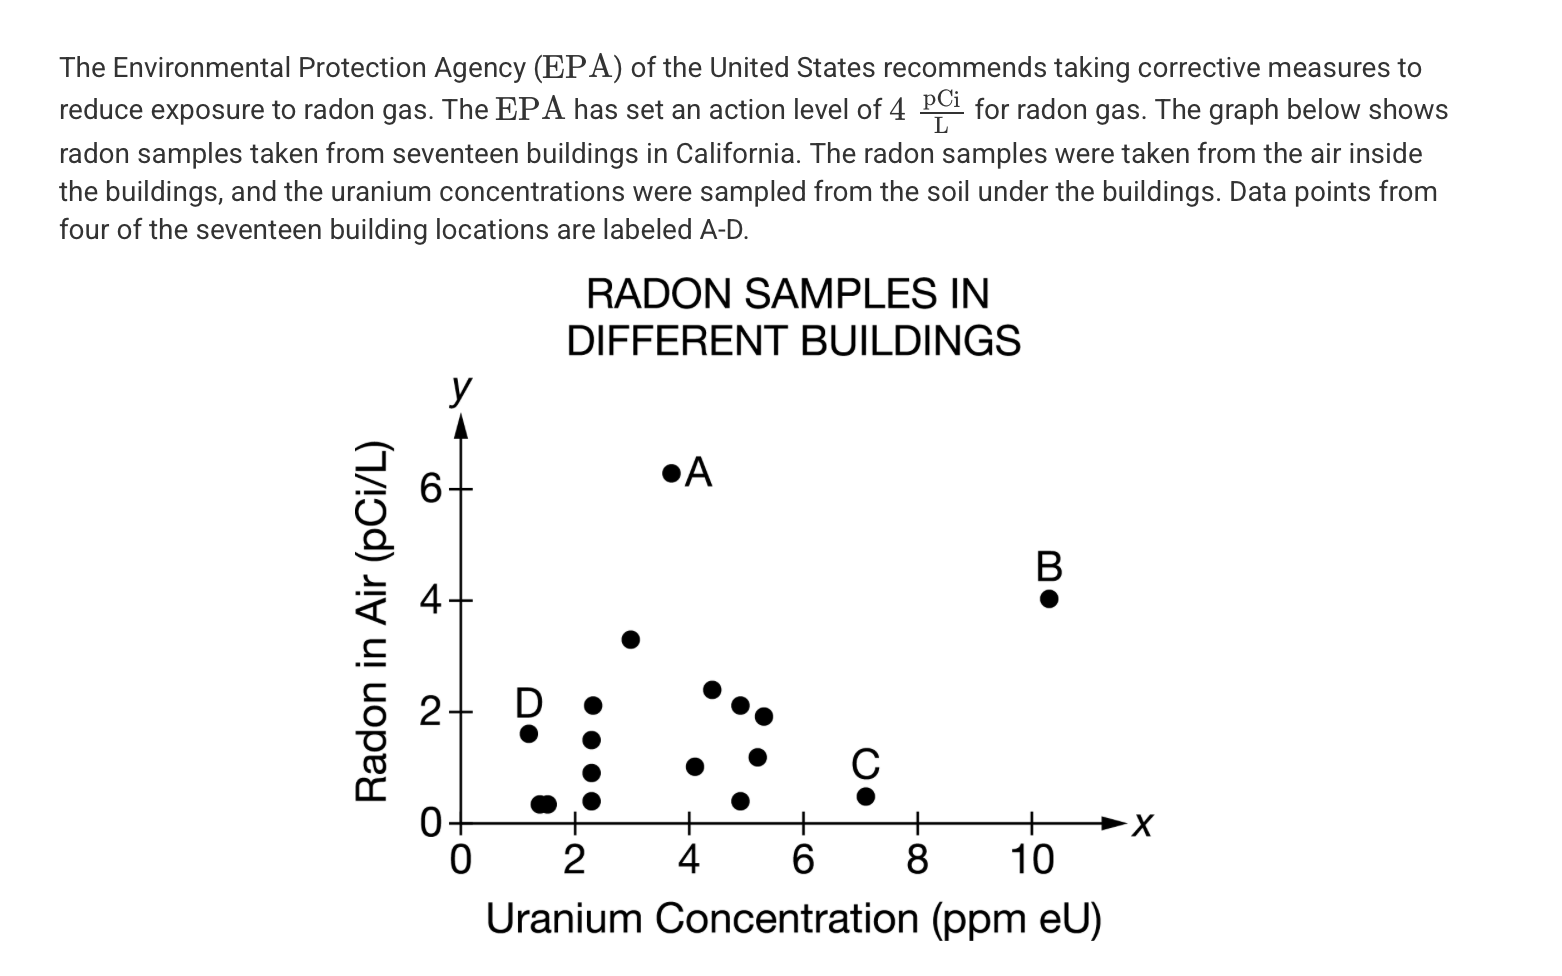
Which of the following conclusions can best be drawn from the data in the graph?
Location A has the greatest need for remediation because the radon levels in the building are the highest and exceed the EPA action level.
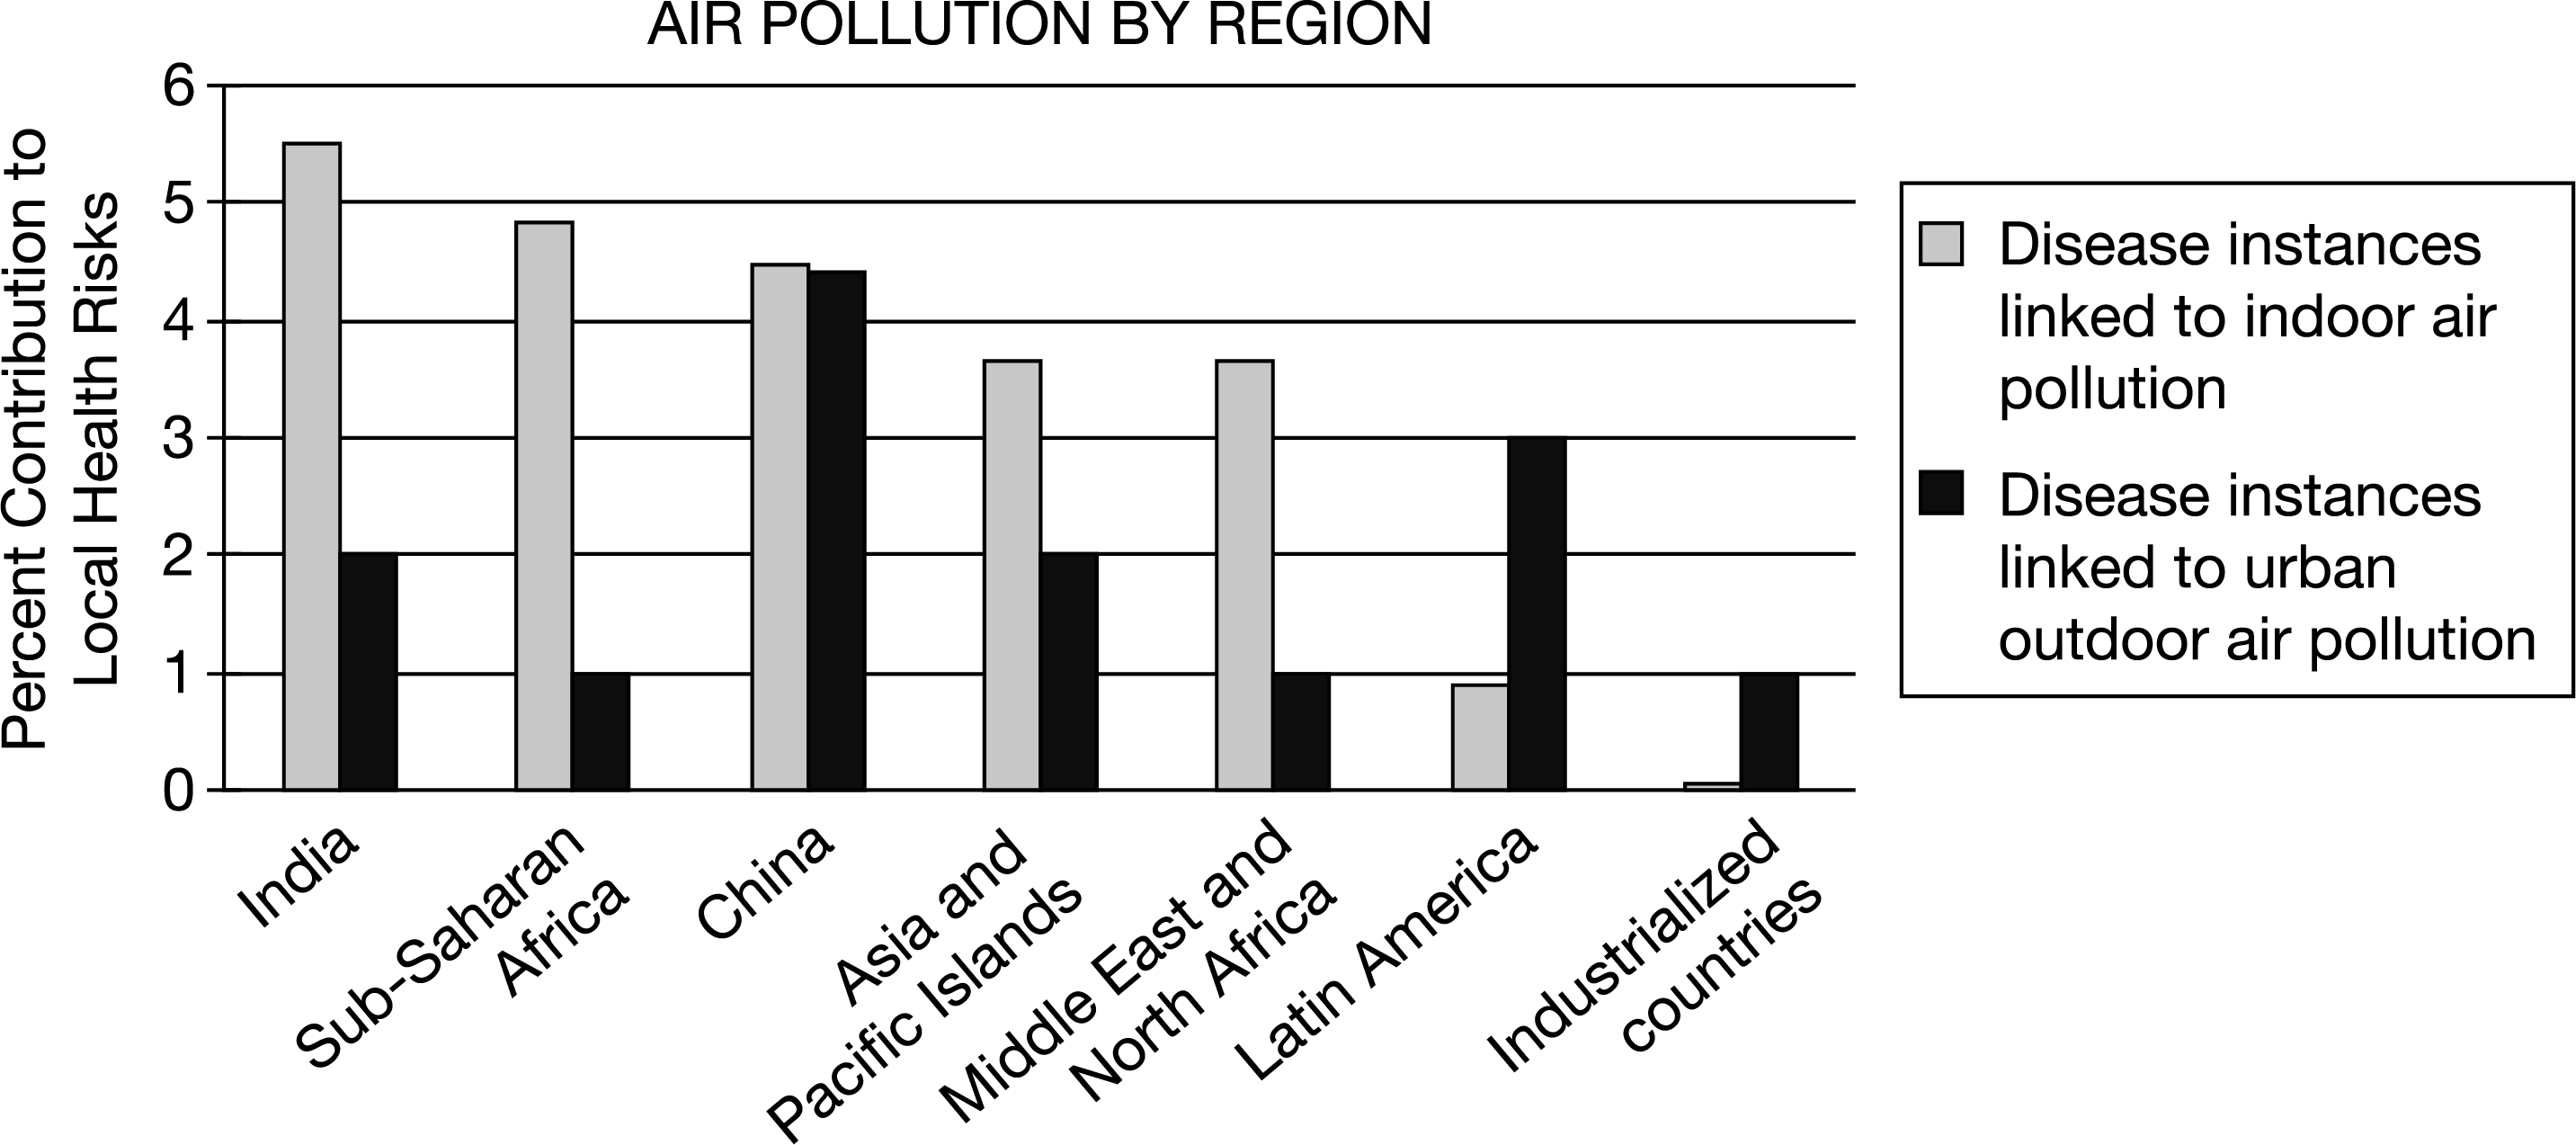
Scientists have observed that the health of people living in moderately developed regions, which have developed transportation and industry but lack environmental control measures, is more likely to be affected by urban outdoor pollution than by indoor air pollution.
Which of the following conclusions can be drawn from the data presented in the graph?
In moderately developed regions such as China and Latin America, an individual’s health is more or as likely to be affected by urban outdoor pollution than by indoor pollution.
B
Developing regions such as sub-Saharan Africa are less affected by indoor air pollution because there is no source of radon in the region.
C
Indoor air pollutants decrease and urban outdoor pollutants increase as countries become more industrialized.
D
The amount of both indoor and outdoor air pollution is directly linked to the size of each region.
In moderately developed regions such as China and Latin America, an individual’s health is more or as likely to be affected by urban outdoor pollution than by indoor pollution.

Scientists have observed that the health of people living in moderately developed regions, which have developed transportation and industry but lack environmental control measures, is more likely to be affected by urban outdoor pollution than by indoor air pollution.
Which of the following activities would most likely account for the levels of indoor air pollution in India and sub-Saharan Africa, as shown in the graph?
Responses
A
Construction of homes with more efficient insulation and increased ventilation
B
Use of biomass fuel sources such as wood and charcoal for cooking
C
Industrial power plants burning fossil fuels for electrical energy generation
D
Use of chemical pesticides on croplands
Use of biomass fuel sources such as wood and charcoal for cooking
Install electrostatic precipitators at the plant.
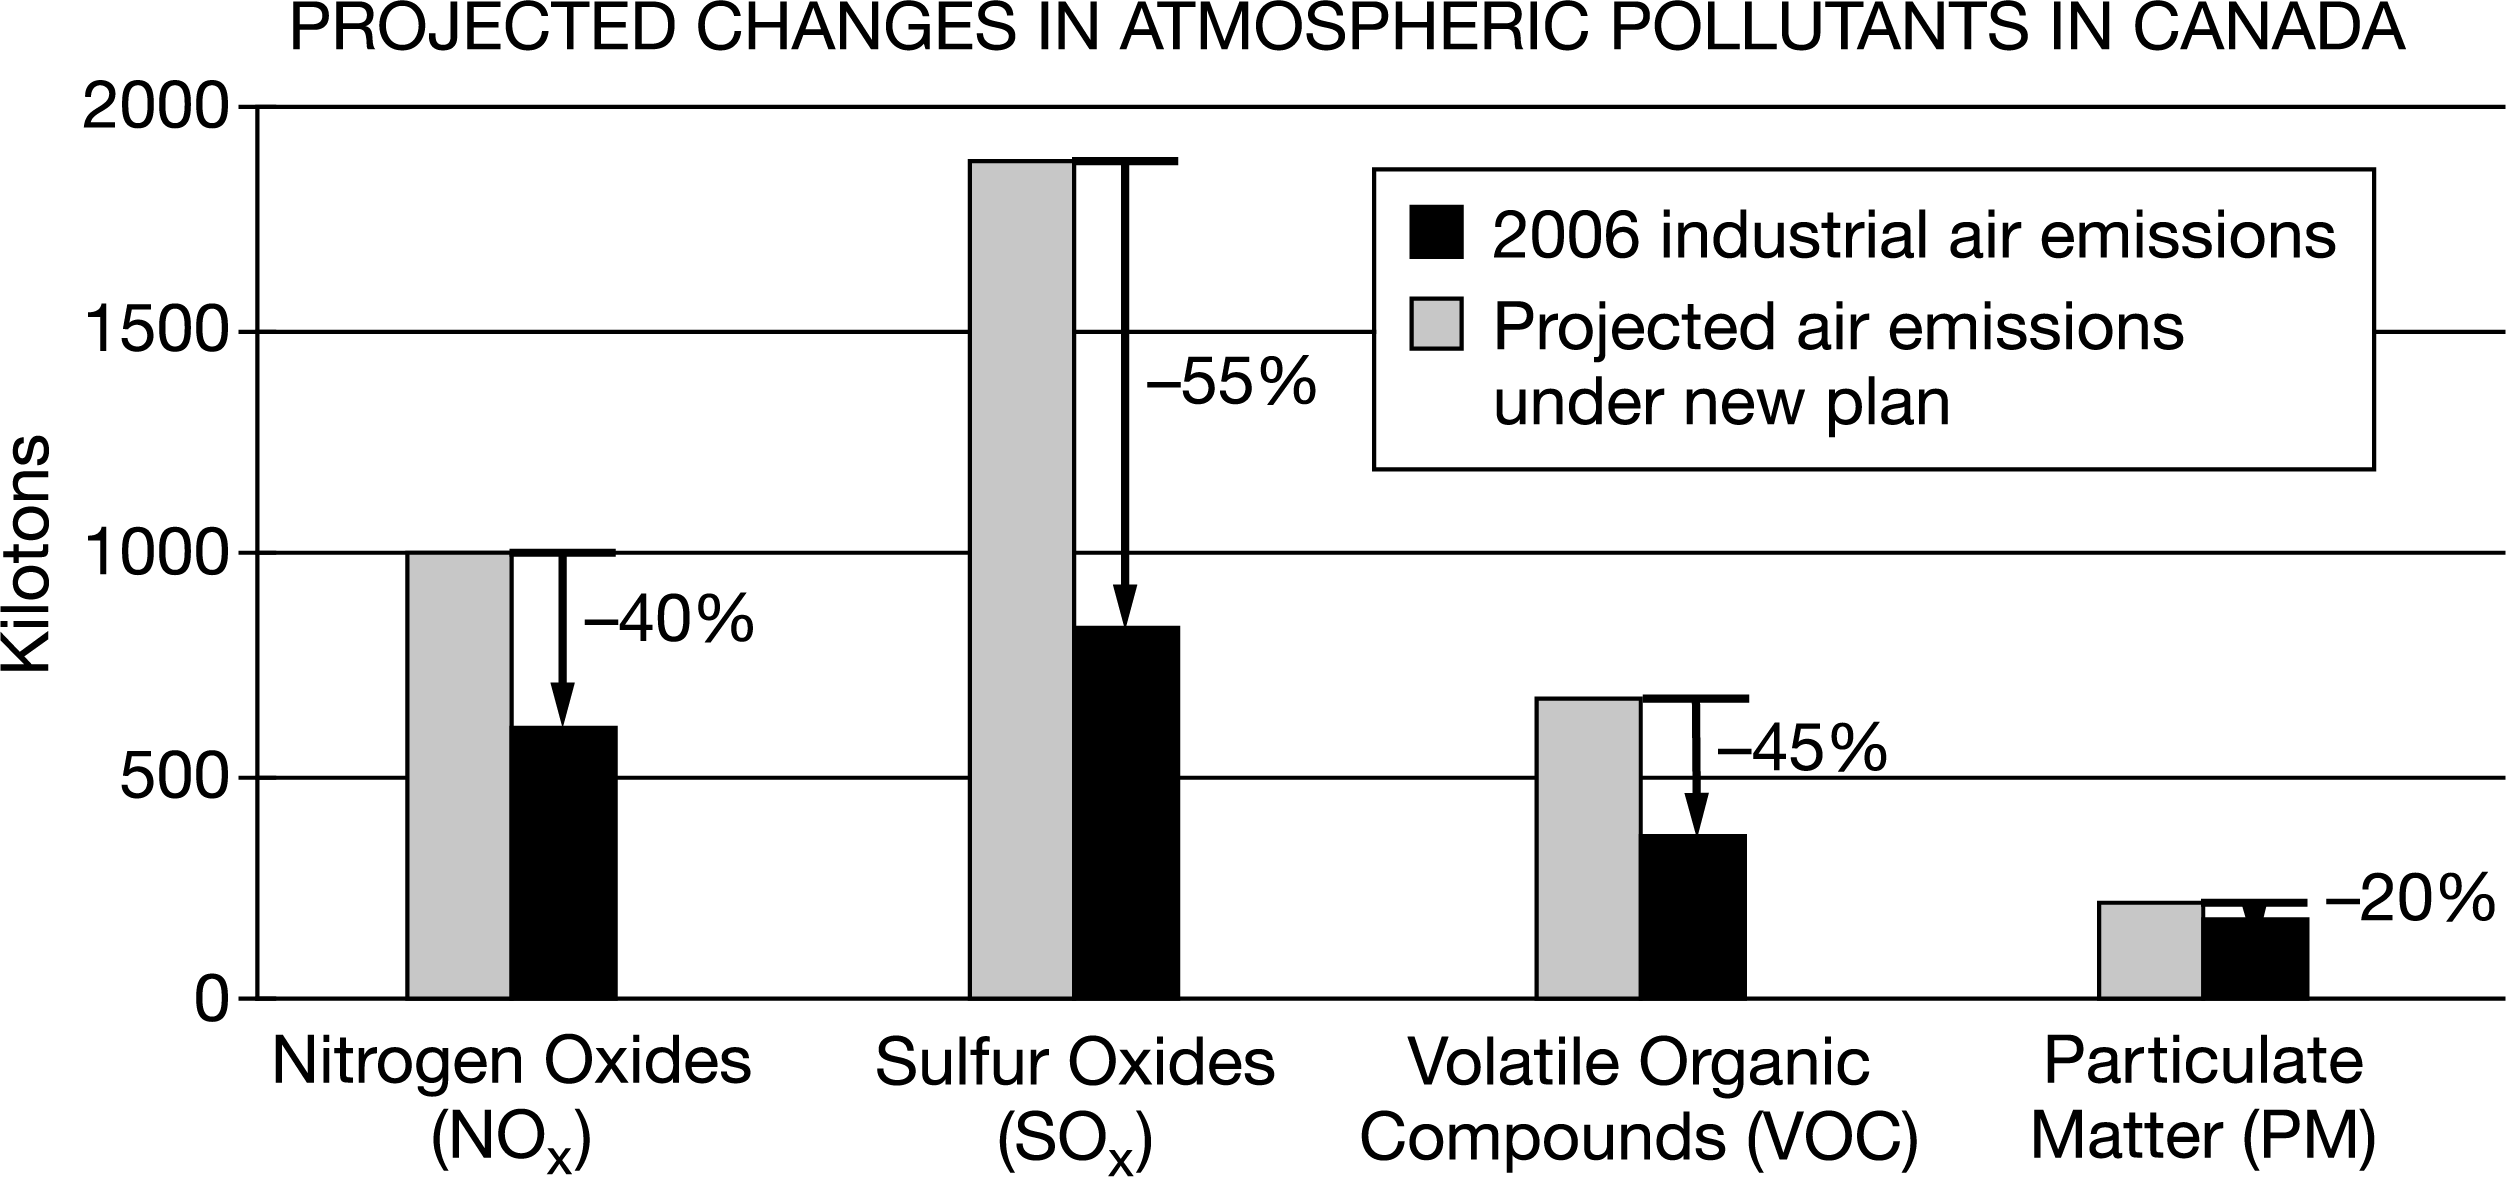
Canada has proposed an action plan to address climate change and air pollution. The action plan will reduce the impact of greenhouse gases and pollutants on the environment and human health. Which of the following claims about the Canadian action plan is best supported by the data in the graph?
Responses
A
The plan encourages the transition from electricity generation from nuclear power to electricity generation from cleaner-burning natural gas.
B
The plan focuses on increasing regulation on installation and maintenance of catalytic converters in vehicle exhaust systems.
C
The plan supports phasing out traditional coal power plants and transitioning to sources like hydroelectricity, wind, and solar power.
D
The plan provides a strategy for reducing the amount of plastic wastes in landfills through the production of long-lasting and durable plastics. of long-lasting and durable plastics.
The plan supports phasing out traditional coal power plants and transitioning to sources like hydroelectricity, wind, and solar power.
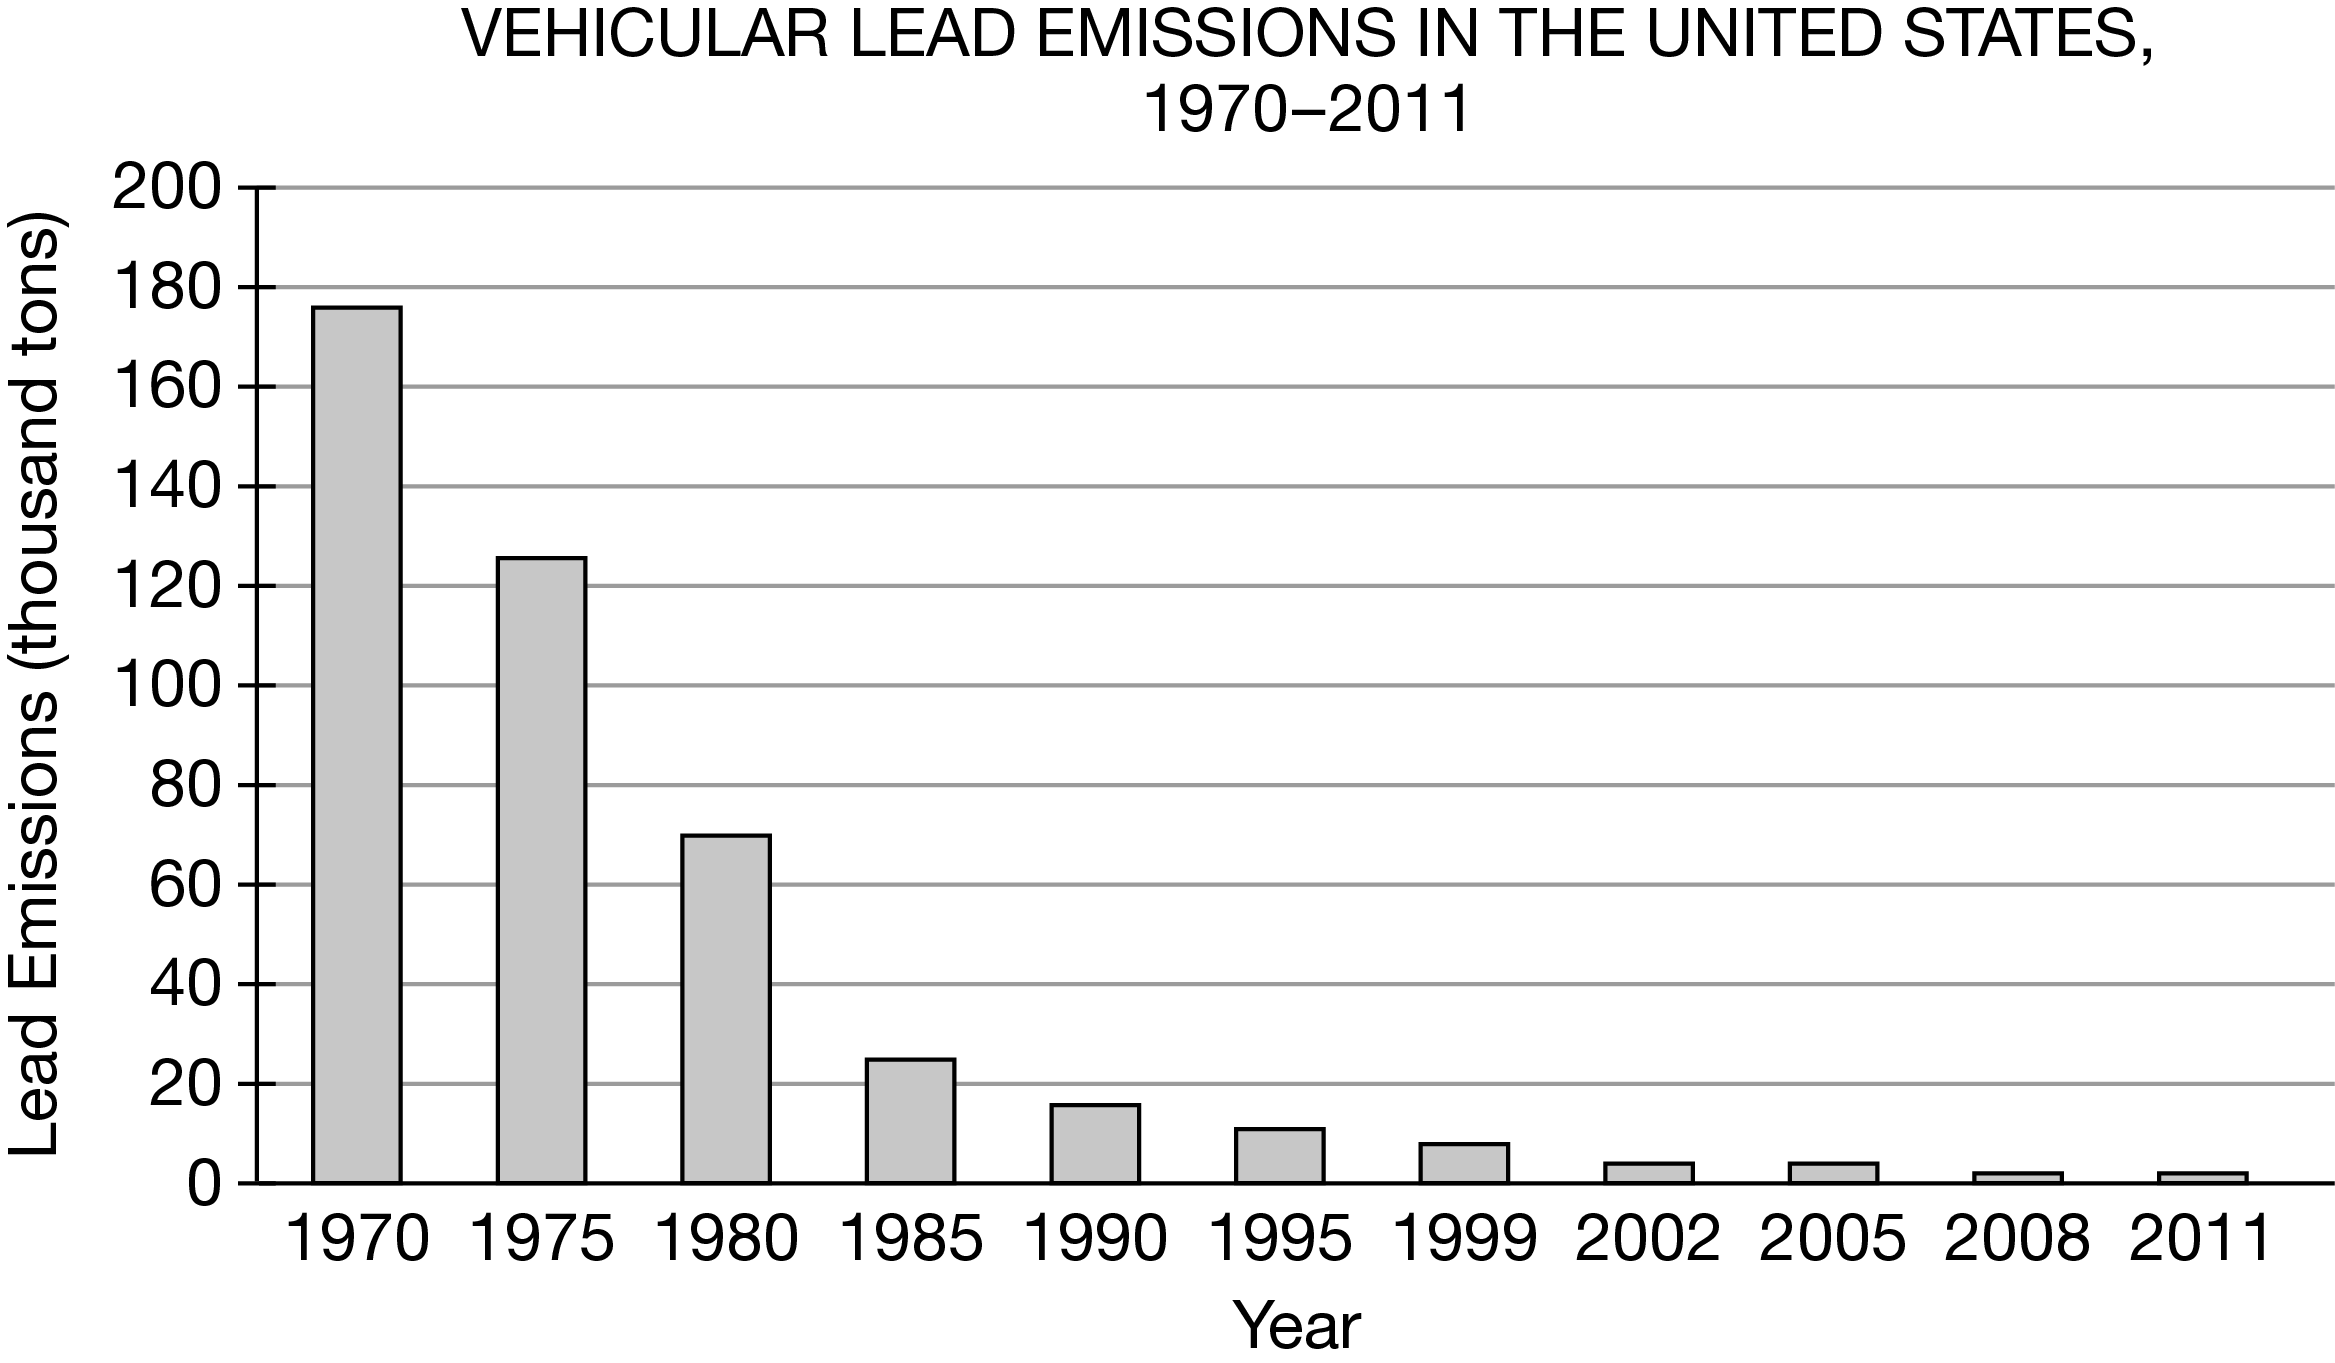
Which of the following best explains the cause of the trend shown in the graph for lead emissions in the United States from 1970 to 2011 ?
Responses
A
By 1990, all new model cars were equipped with internal fabric filters that effectively filtered car exhaust and reduced lead emissions.
B
Beginning in 1975, The Clean Air Act required new cars to have catalytic converters, which effectively converted the lead found in gasoline to water vapor.
C
New air-scrubber technologies were introduced in the late 1970s that effectively removed lead in the air and converted it into water vapor.
D
Unleaded gasoline was first introduced in 1974, and amendments to the Clean Air Act required cars with the model year 1975 or later to use only unleaded gasoline.
Unleaded gasoline was first introduced in 1974, and amendments to the Clean Air Act required cars with the model year 1975 or later to use only unleaded gasoline.
A paper company located on the banks of a river discharges its treated wastewater into the river.
Which of the following would be the best control group to evaluate the treated wastewater from the paper company?
Responses
A
A sample of distilled water
B
A sample of water from a nearby river
C
A sample of water downstream from the same river
D
A sample of water upstream from the same river
A sample of water upstream from the same river
A paper company located on the banks of a river discharges its treated wastewater into the river.
Which of the following water quality indicators should be measured to best determine if the wastewater is increasing the acidity of the river?
Responses
A
The amount of dissolved oxygen
B
The total suspended solids
C
The amount of hydrogen ions
D
The species richness
The amount of hydrogen ions
A paper company located on the banks of a river discharges its treated wastewater into the river.
Which of the following would be the best location to obtain a water sample from to determine if the paper plant is affecting the acidity of the river?
Responses
A
Immediately downstream from the paper plant
B
Immediately upstream from the paper plant
C
At an upstream tributary to the river
D
At a downstream tributary to the river
Immediately downstream from the paper plant
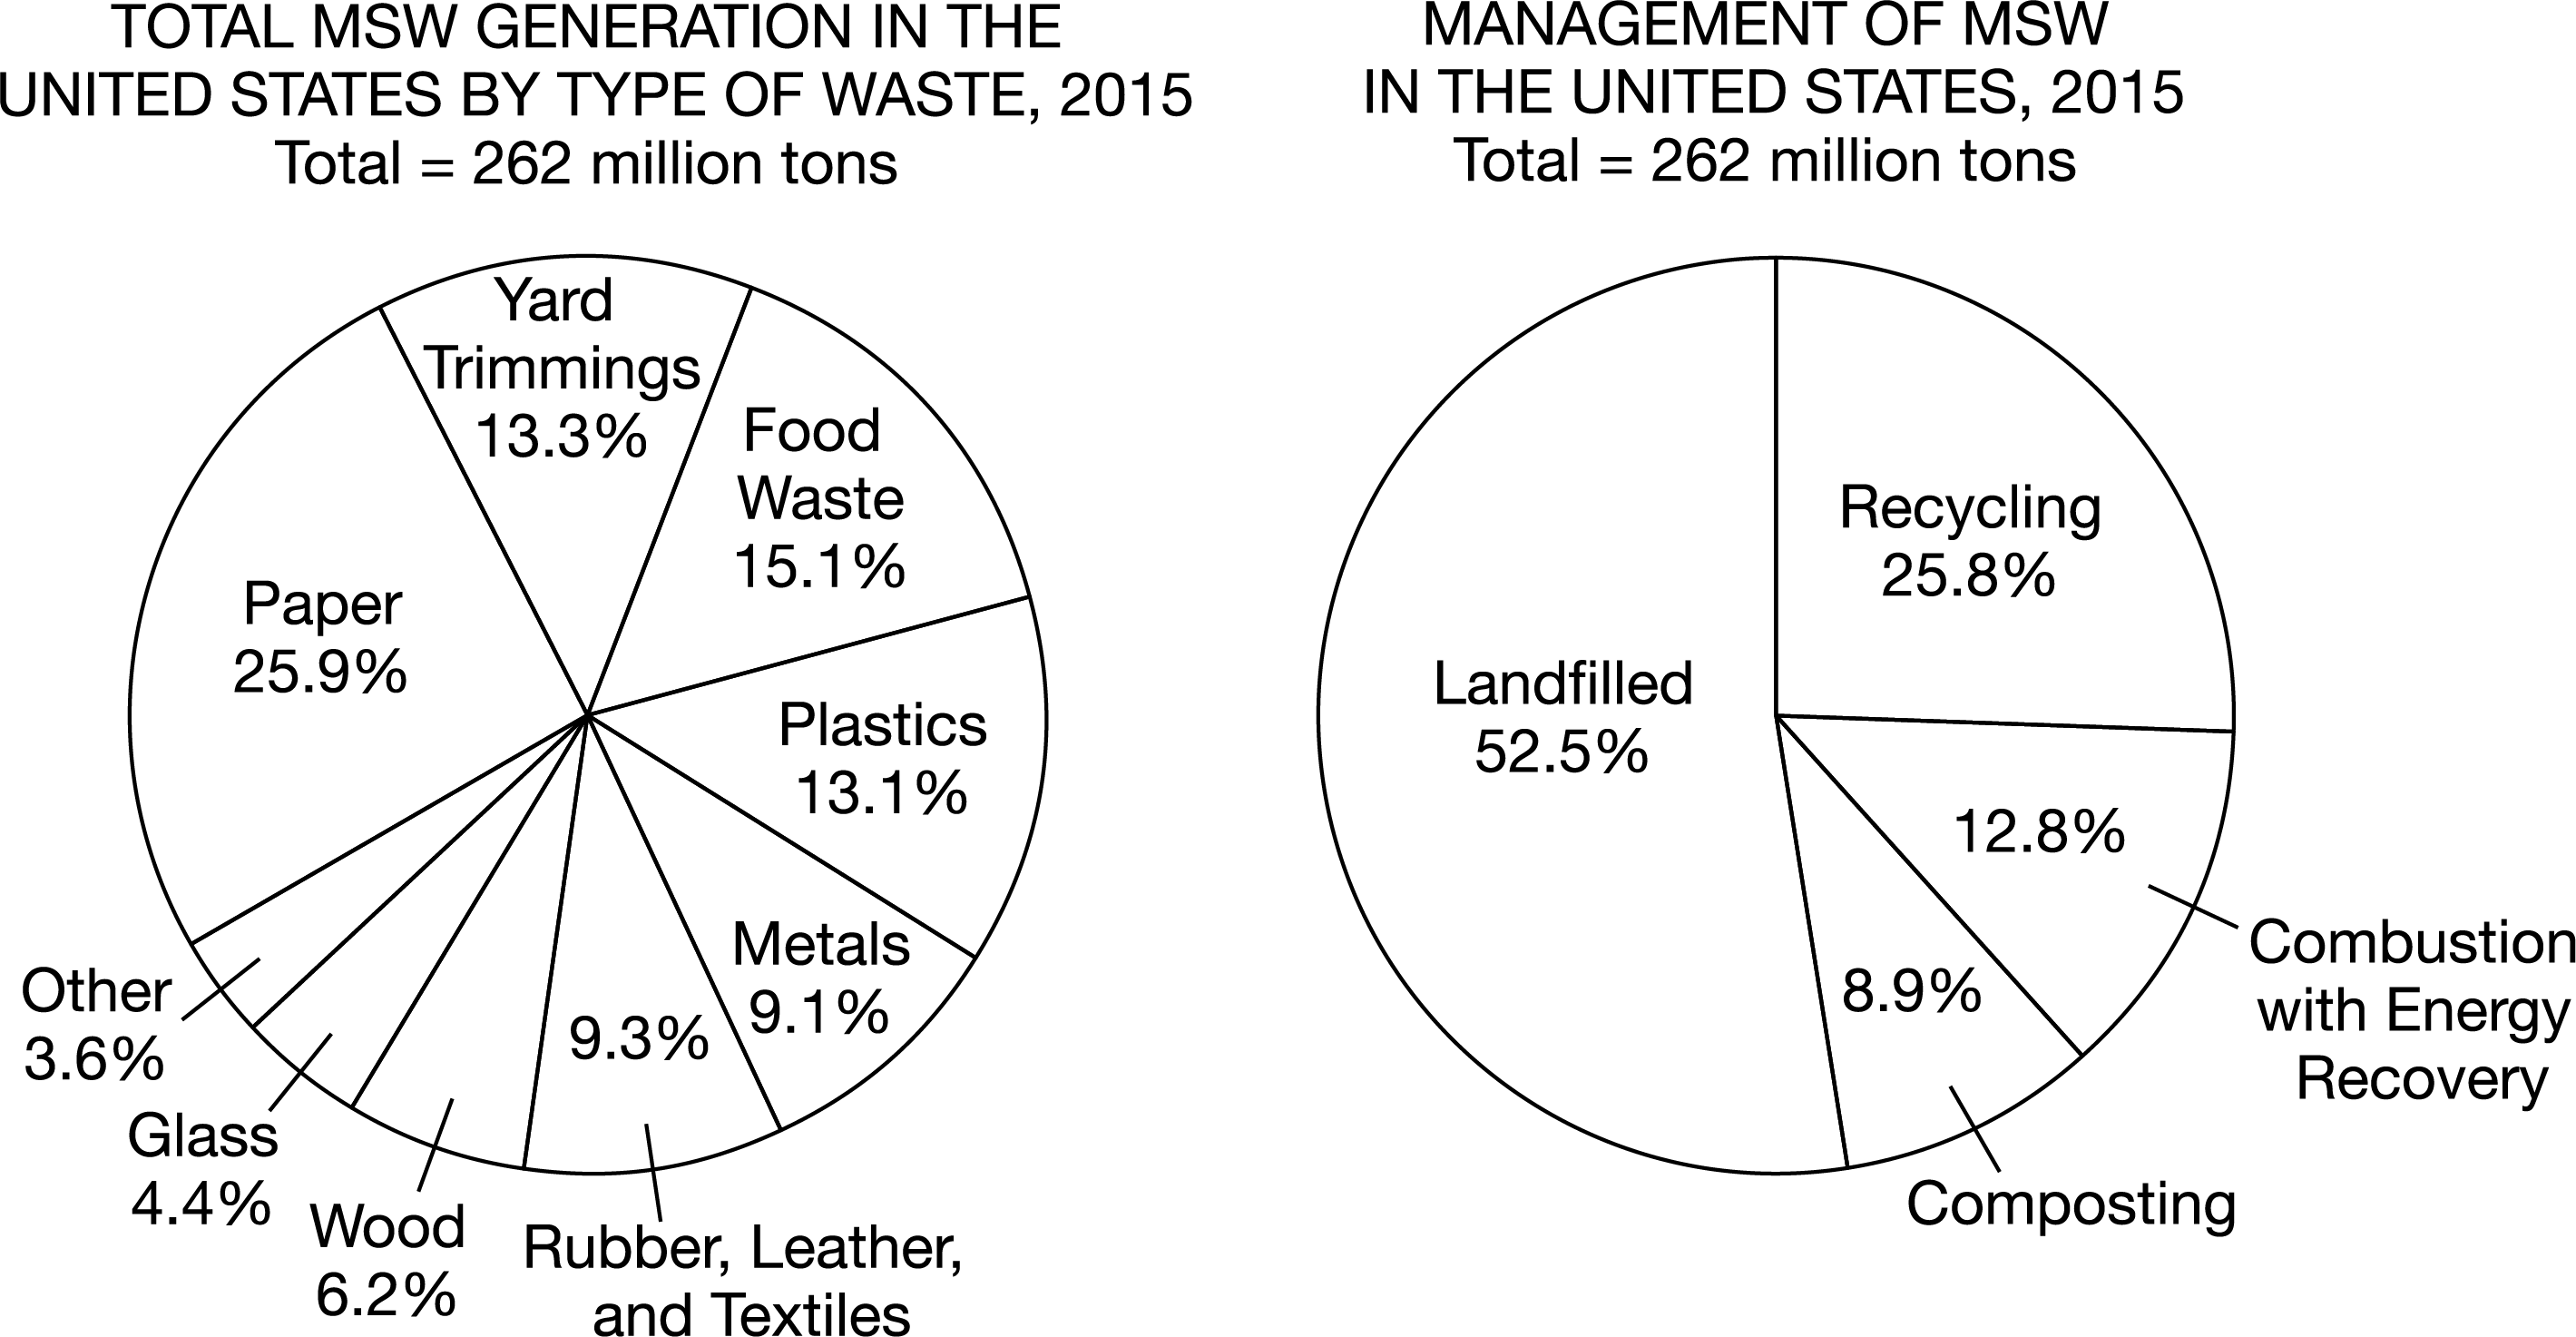
Incineration is one solution to reduce the volume of municipal solid waste. Municipal solid waste can be used to produce energy at waste-to-energy plants. Based on the data in the graphs, which of the following materials would be best suited for incineration to reduce total volume, produce energy, and have minimal release of air pollutants?
Responses
A
Glass
B
Wood
C
Metals
D
Plastics
Wood

Based on the data in the graphs, which of the following would result in the largest reduction in volume of municipal solid waste disposed of in landfills?
Responses
A
Introduce composting programs for yard trimmings and food waste
B
Increase programs to recycle glass and metals
C
Promote reusing plastics and wood products
D
Increase funding to clothing donation programs
Introduce composting programs for yard trimmings and food waste