statistics
1/9
There's no tags or description
Looks like no tags are added yet.
Name | Mastery | Learn | Test | Matching | Spaced |
|---|
No study sessions yet.
10 Terms
Extrapolation
extra data outside the pprediction points
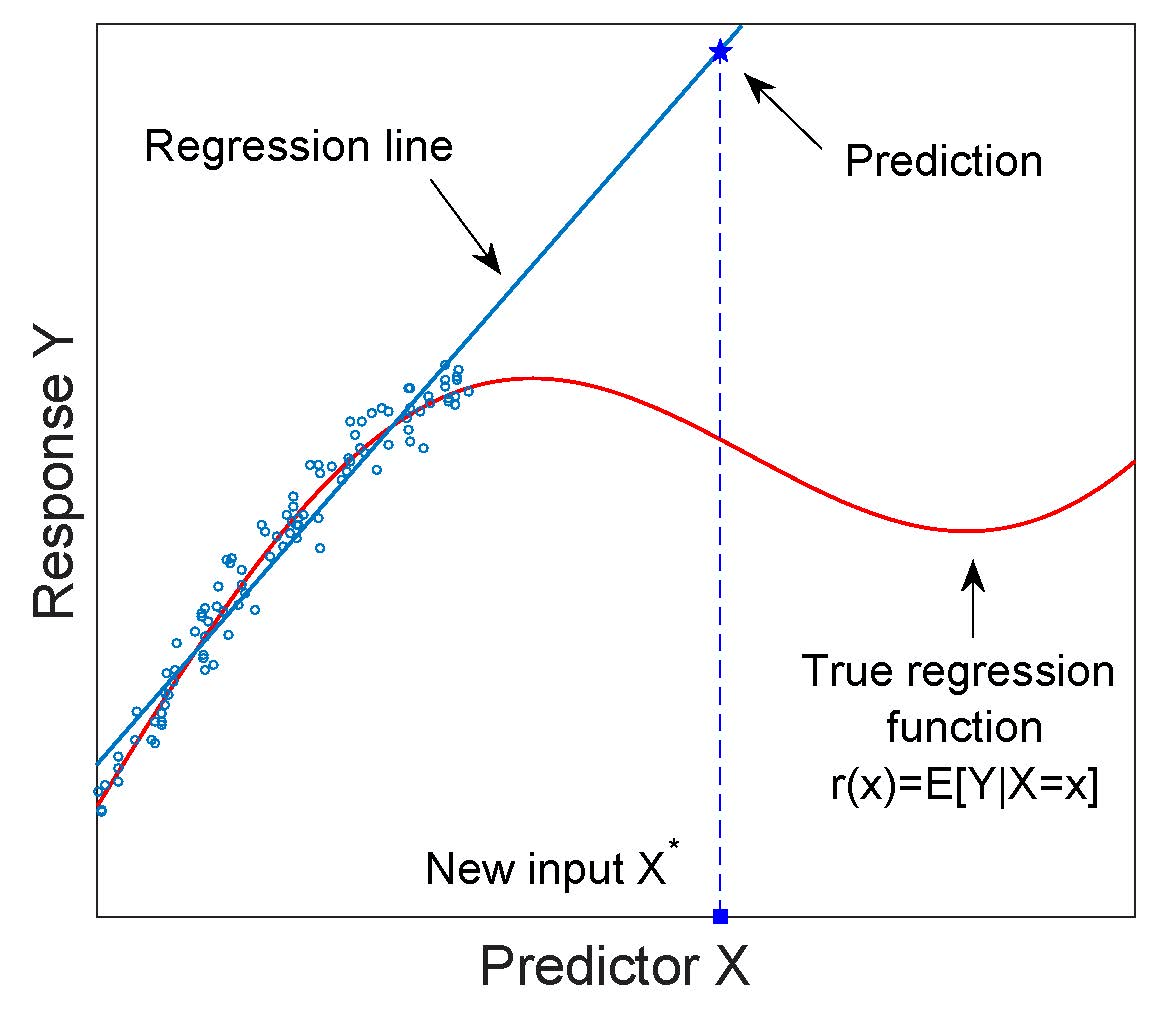
interpolation
prediction inside data
Sampling strategies
convecnience - most easily accessible
simple random - equal/random chance of selection
systematic - select from random starting point and fixed interval e.g. every tenth person
stratified - form into small groups/strata with defined characteristics and then pick random from those groups
quota - same as stratified but take sample size according to size of stratum
difference between bar chart and histogram?
bar chart — discrete data
histogram — continuous data
describing shape of histogram:
negatively/left skewed, normal distribution, right/positively skewed
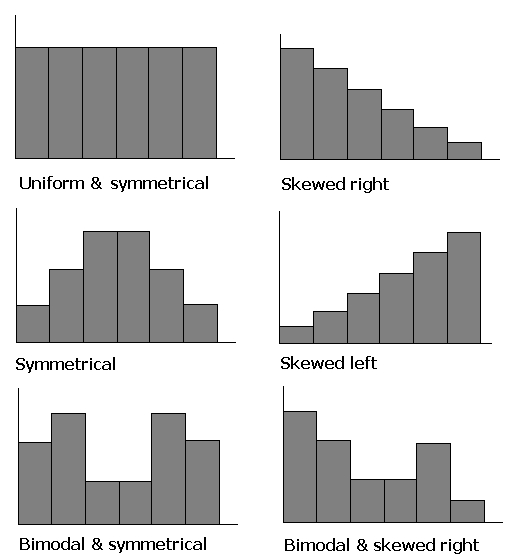
modal class
highest frequencty group in the frequency thing
how to calculate an outlier ?
Q+- 1.5 x IQR
describing correlations
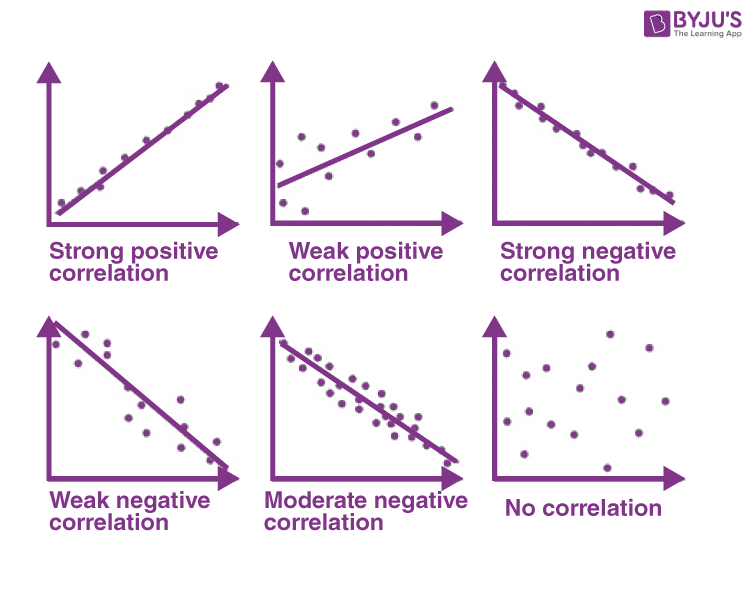
pearson product moment correlation coefficent
finds the r and tells correlation. 0-0.25 very weak, 0.25-0,5 is weak, 0.5-0.75 is moderate, 0.75-1 is strong
residual
vertical distance between data point and regression of line