Chapter 15: Working Capital Management
1/42
Earn XP
Description and Tags
Name | Mastery | Learn | Test | Matching | Spaced |
|---|
No study sessions yet.
43 Terms
Working Capital
The capital available for conducting day-to-day operations of an organisation, normally the excess of current assets over current liabilities.
Working Capital Management
Management of all aspects of both current assets and current liabilities to reduce the risk of insolvency while maximising the return on assets:
Current Assets: Inventory, Receivables, Cash & Bank (require funding consider reducing levels)
Current Liabilities: Payables & Bank Overdraft (provide funding consider increasing levels)
Investing in Working Capital
Has a cost:
Funding
Opportunity cost of lost investment opportunities as cash tied up and unavailable for other uses.
Working Capital Balancing Act: Liquidity vs Profitability
Liquidity: Ensuring current assets are sufficiently liquid to minimise the risk of insolvency.
Profitability: Maximising the return on capital employed (ROCE) hence minimising investment in working capital.
Seen as the trade off between cash flow versus profits.
Sources of Liquidity
Cash in bank
Short-term investments that can be cashed in easily and quickly
Cash inflows from normal trading operations (cash sales, payments by receivables for credit sales)
An overdraft facility or other ready source of extra borrowing.
Increasing Liquidity
Decrease inventory levels, less wastage, less storage/holding costs, money not tied up, opportunity cost reduced, cash increased.
Increasing Profitability
Increase inventory levels, no stock outs, accepting bulk discounts decreases orders, profits increased.
Cash Flow vs Profit
Cash flow is as important as profits. Unprofitable entities can survive if they have cash. Profitable entities can fail if they run out of cash. Cash balances and cash flows need to be monitored just as closely as trading profits.
Examples of transactions that have this trade off between cash flows and profits:
Purchase of NCA for cash as paid in full to supplier when asset delivered but profits reduce over life of asset (depreciation).
Sale of good on credit means profits credited in full at sale confirmation but cash not received for considerable time.
Tax payments have a significant timing difference between impact on reported profit and the cash flow.
Profitability vs Liquidity
Basis of the trade off is where an entity is able to improve its profitability but at the expense of tying up cash:
Receiving bulk purchase discount (increasing profitability) for buying more inventory than is required (reducing liquidity).
Offering credit to customers (attracts more customers increasing profitability but reduces liquidity).
The opposite situation can be seen where an entities improves its liquidity at the expense of profitability:
Offering an early settlement discount to customers.
Consequences of Poor Working Capital Management
Inability to meet bills as they fall due
Demands on cash during periods of growth being too great (overtrading)
Over-stocking or stock-outs.
Working Capital Cycle (Cash Operating Cycle)
Is the length of time between the entity’s outlay on raw materials, wages and other expenditures and the inflow of cash from the sale of goods:
WCC = Inventory Days (Raw + WIP + Finished) + Trade Receivable Days - Trade Payable Days
Speeding up WCC
The faster a firm can ‘push’ items around the cycle the lower its investment in working capital will be.
Factors affecting length of WCC
Liquidity vs Profitability decisions
Management efficiency
Industry norms (retail vs construction)
Optimum WCC
The amount that results in no idle cash or unused inventory but does not put a strain on liquid resources.
WCC is the time span between incurring production cost and receiving cash returns it says nothing in itself about the amount of working capital that will be needed over the period.
Factors affecting levels of Working Capital Investment
Nature of the business (manufacturing need more inventory than service entities)
Uncertainty in supplier deliveries (more uncertain means extra inventory carried to cover fluctuations)
Level of sales activity (as output increases then receivables, inventory tend to increase)
Entity’s credit policy (tighter the policy, lower level of receivables)
Length of WCC (longer it takes to convert material to finished goods to cash, greater investment in WC)
Credit policy of suppliers (less credit entity allowed, lower level of payables and higher net investment in WC)
Working Capital Management Policies
The choice of policy is a matter for managerial judgement. It depends to an extent on cost vs risk trade off and can fluctuate with seasonality:
Aggressive
Conservative
Moderate
Aggressive Policy
Attempts to reduce costs by holding the lowest levels of cash, inventory and receivables as possible.
This produces a short operating cycle.
This policy carries the greatest risk of illiquidity as well as the greatest returns.
Conservative Policy
Attempts to reduce risks by holding high levels of cash, inventory and receivables.
This policy produces a long operating cycle.
Risks such as stock-outs or liquidity problems are low but resultantly costs are increases.
Moderate Policy
This adopts a middle ground between aggressive/conservative approaches.
Benefits of Aggressive Policy
Lower levels of current assets therefore lower financing costs.
The lower financing costs should result in better profitability.
Quicker cash turnover may allow more reinvestment and hence allow the business to expand more quickly.
Benefits of Conservative Policy
Lower liquidity risk.
Greater ability to meet a sudden surge in sales demand.
More relaxed credit policy for receivables may improve sales.
Working Capital Funding
Permanent: Base level required throughout the year.
Fluctuating: Additional level for seasonality and short-term changes.
Financing Options
Short-Term: Cheaper but riskier (renewal problems, interest rate fluctuations.
Long-Term: More stable but generally more expensive.
Funding Working Capital Policies
Aggressive: Lower base level using short term finance for all fluctuating and some permanent investment.
Conservative: Higher base level using long term finance for all permanent and some fluctuating investment.
Moderate: Short-term finance for fluctuating, long-term finance for permanent.
Healthy Trading Growth
Increased profitability
Increase investment in NCAs and working capital
Overtrading
If the business does not have access to sufficient capital to fund the increase in trading growth which can cause serious trouble for the business if its unable to pay its business payables.
Indicators of Overtrading
A rapid increase in turnover
A rapid increase in the volume of current assets
Most of the increase in assets being financed by credit
A dramatic drop in the liquidity ratios
Solutions to Overtrading
Raising more long-term capital in the form of new shares or loans.
Slowing down growth to reduce the increases in working capital requirements until sufficient cash has been built up to finance it.
Improving working capital management so that there is a reduction in the inventory holding period or a reduction in the average time for customers to pay.
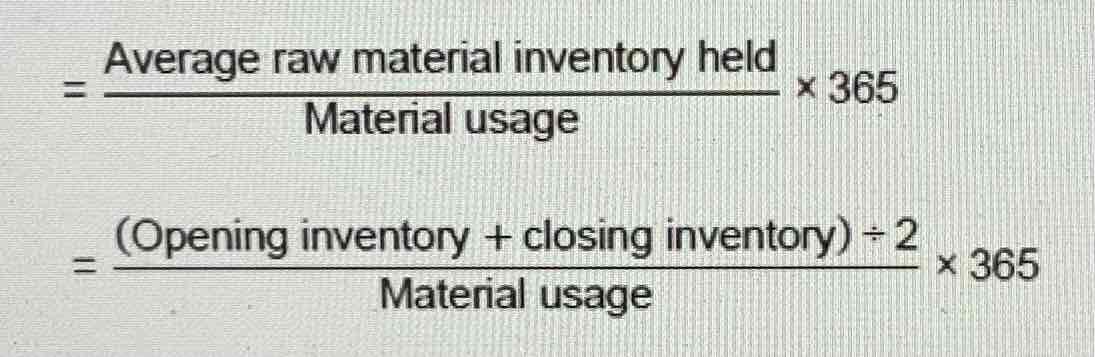
Raw Material Inventory Holding Period
Length of time raw materials are held between purchase and being used in production.
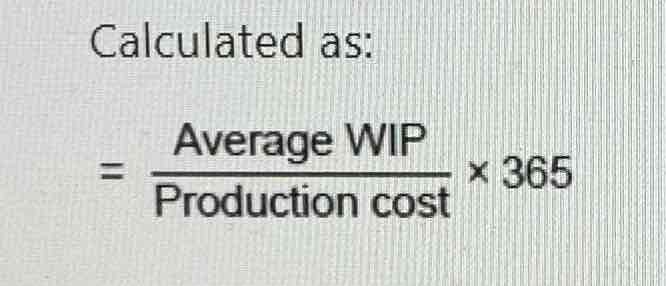
WIP Holding Period
Length of time goods spend in production.
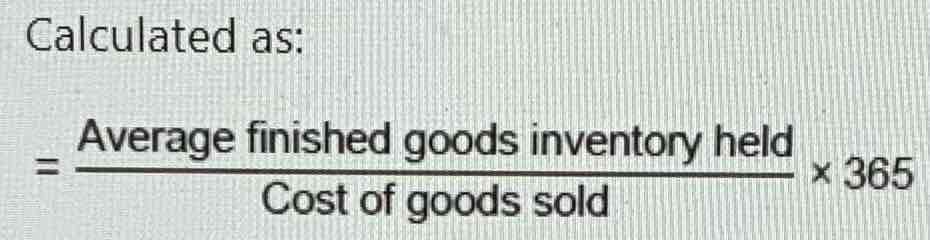
Finished Goods Inventory Holding Period
Length of time finished goods are held between purchase/completion and sale.
Inventory Turnover
For each inventory ratio the corresponding turnover ratio can be calculated.
For each inventory ratio typically a low ratio is seen as a sign of good working capital management.

Interpreting Inventory Periods
High Inventory Days: Conservative - Additional finance tied up in large inventory for new product launch or to avoid stock-outs.
Negative cash flow if cash paid out for inventory but not received until sold, longer delay if inventory is sold on credit terms.
Low Inventory Days: Aggressive - Overzealous ‘just in time’ application risking stock-outs.
Cash flow crisis or aggressive working capital policy.
Compare inventory days to other companies and previous years.
Managing inventory levels involves balancing the risk of stock-outs against the cost of high inventory levels.
Indicators of Increasing Inventory Days
Investigate increases by analysing raw materials (RM), work-in-progress (WIP), and finished goods (FG).
Increase in RM days: Mismanagement in buying.
Increase in WIP days: Production delays.
Increase in FG days: Decline in demand or obsolete items.
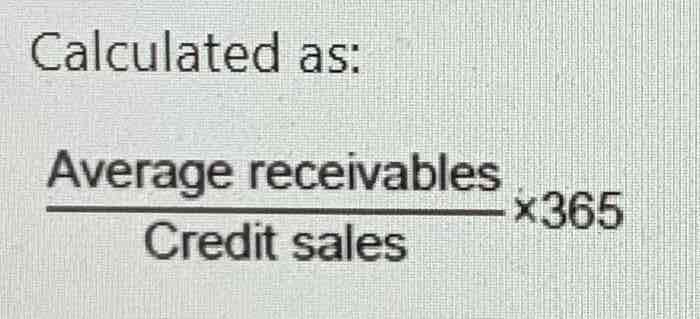
Trade Receivables Days
Length of time credit is extended to customers.
Shorter credit periods are financially prudent but length depends on nature of business too.
Delays in invoicing or following up on late payments negatively impact cash flow.
If no credit sales then use total sales.
Factors affecting Receivables
Reflects the efficiency of credit controllers.
Influence by sales and marketing strategies and the nature of the business.
Changes in receivables should be evaluated in the context of sales levels.
Trade Payable Days
Average period of credit extended by suppliers.
The ratio can be compared with receivable days, an entities does not normally want to offer its customers more time to pay than it gets from its own suppliers as this can affect cash flow.
The longer the payables payment periods the better as the entity holds on to its cash for longer.
Risk of Extending Payable Days
Increasing payables days suggests advantage is being taken of available credit but there are risks:
Losing supplier goodwill
Losing prompt payment discounts
Suppliers increasing the price to compensate
It is important to recognised when using these ratios that it is the trend of ratios that is important not the individual values. Payment periods are longer in some types of entity than in others.
Quick (acid test) Ratio
A measure of 1:1 means the entity can meet existing liabilities if they all fall due simultaneously.
Measures how well current liabilities are covered by liquid assets.
Is particularly useful where inventory holding periods are long.

Working Capital Cycle
The ratios can then be brought together to produce the WCC.
As always this must be compared with prior periods or industry average for meaningful analysis.
Considerations for Calculating Ratios
Use 365 for days, 12 for months, 52 for weeks in ratios.
When comparing ratios between two financial statements use closing figures for each year to see changes.
Turnover ratios are calculated by inverting the given ratio and removing the multiple.
Compare ratios with industry figures or identify trends over multiple periods.
Limitations of Ratios
SFP values at a particular time may not be typical
Balances used for seasonal business may not represent average levels
Can be subject to window dressing/manipulation
Concern past (historic) not the future
Figures may be distorted by inflation and/or rapid growth.
Shortening the WCC
Reduce raw materials inventory
Review slow-moving lines, reorder levels & quantities. Consider inventory control models. Improve supplier links.
Downsides: loss of bulk purchases discounts, cost savings, or production delays.
Obtain more finance from suppliers
Delay payments through negotiation, increase payable days.
Downsides: deteriorated commercial relationships, loss of reliable suppliers and discounts.
Reduce work in progress inventory
Improve production techniques and distribution.
Downsides: human and practical challenges.
Reduce finished goods inventory
Reorganise production schedule and distribution methods.
Downsides: reduced efficiency in meeting customer demand and sales reduction.
Reduce credit given to customers
Invoice and follow up more quickly, offer discount incentives.
Downsides: loss of customers and revenue due to discounts.
Debt factoring
Generate immediate cash flow by selling receivables to a third party.
Downsides: costly to the entity.