Ch 12: Two-factor ANOVA 2021
1/70
Earn XP
Description and Tags
two facot ANOVA structure, Two Factoy ANOVA
Name | Mastery | Learn | Test | Matching | Spaced | Call with Kai |
|---|
No analytics yet
Send a link to your students to track their progress
71 Terms
when do you use single facotor ANOVA
to evalute whether the mean of a numerical varible is different among categorical levels.
they are used to answer questions such as
“is the cost of eyeglasses different depending on whether the lenses are bifocals, trifocals, or progessives”
What does ANOVA stand for
Analysis of Variance
when are Two-factor ANOVA used?
when asking questions about the interaction between the categorical factors
Examples
“high blood pressure can be resolved through drugs, lifestyle changes, or a combination of both.”
But how do drugs interact with lifestyle changes? Are some drugs more effective when patients are on a heart-friendly diet?
Two-factor ANOVA
Two-factor ANOVA statistical test used to evaluate the change in a numerical variable across two categorical variables. (interacton between each categorical factor)
Interaction:
Interaction is when the response to the combination of two levels is not the simple sum of the two.
Main effects:
Main effects is another name for a categorical variable in a two-factor ANOVA.
what does the two factor anaylsis of variance ( ANOVA) allow us to do
With two categorical variables, we can look at the effect that each level has on the numerical variable, as well as the interaction between the categorical variables
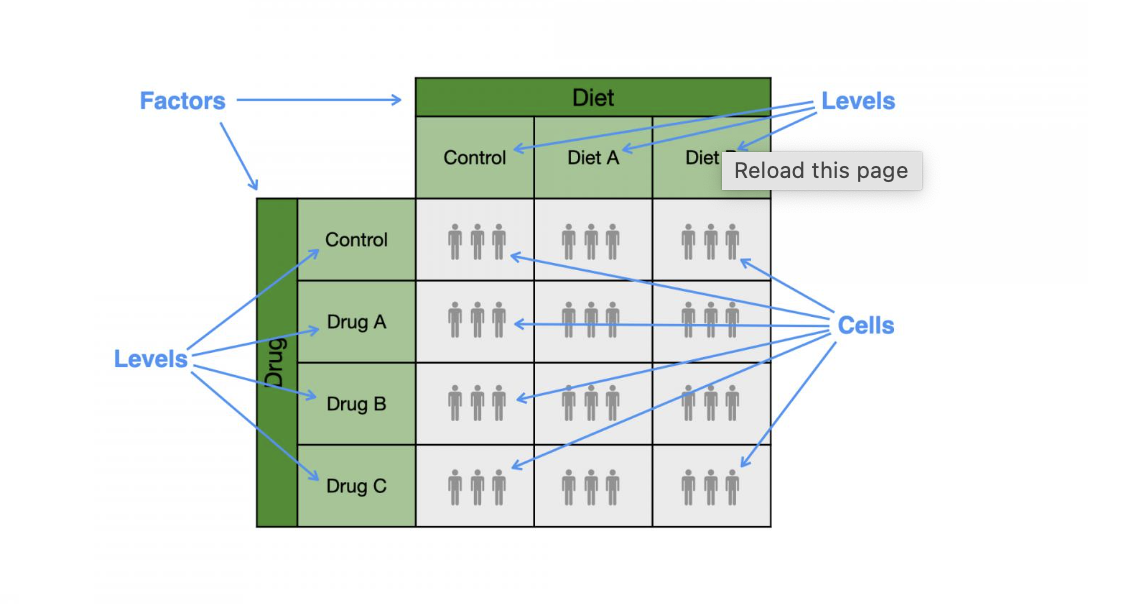
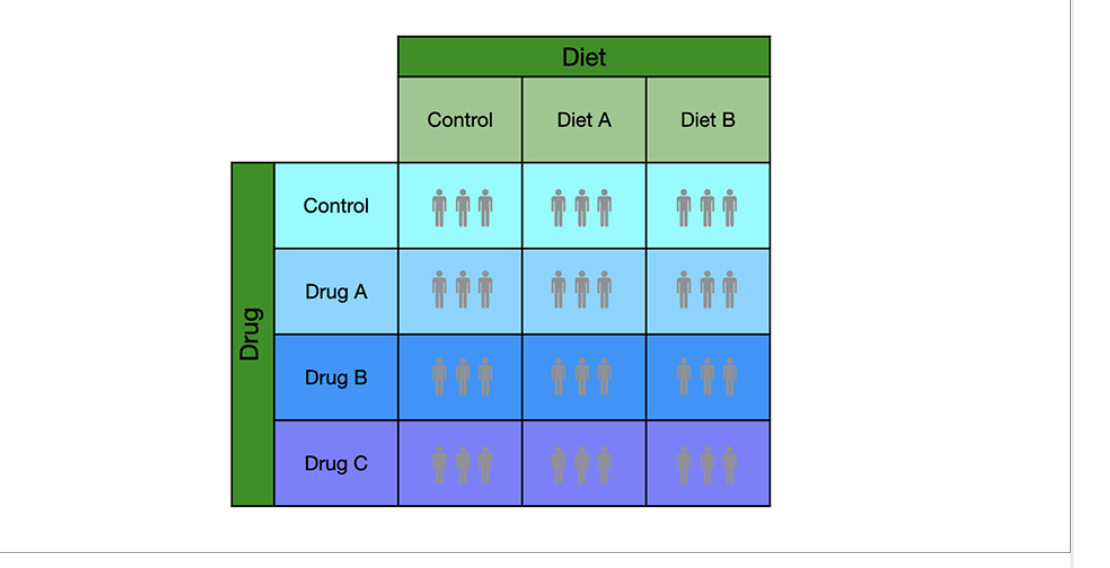
how can the two factor ANOVA be visulized
can be visualized as a two-dimensional grid.
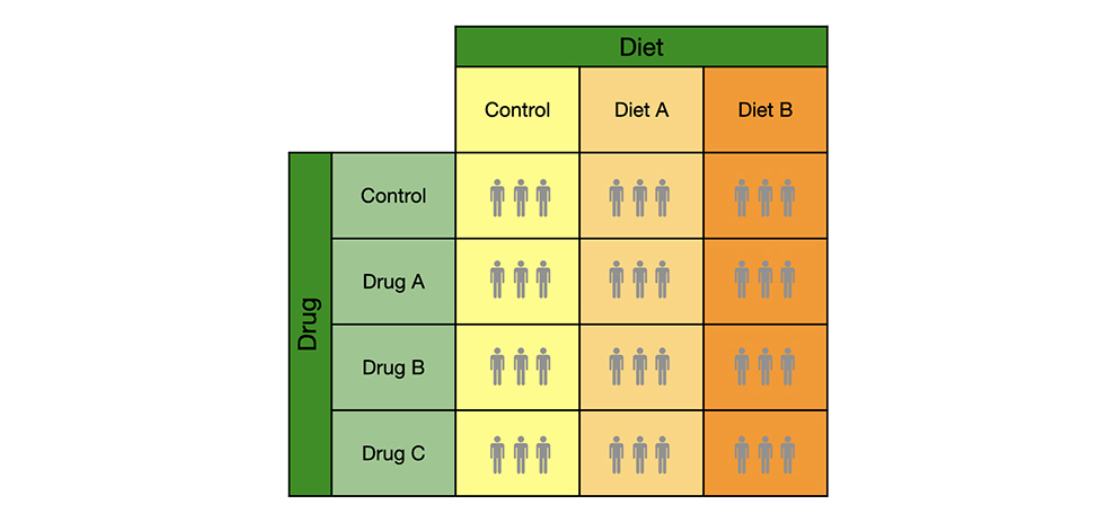
One factor can be shown as columns and the other factor as rows. For example, a study looking at the impact of diet type and drug type on blood pressure could have the following grid layout.
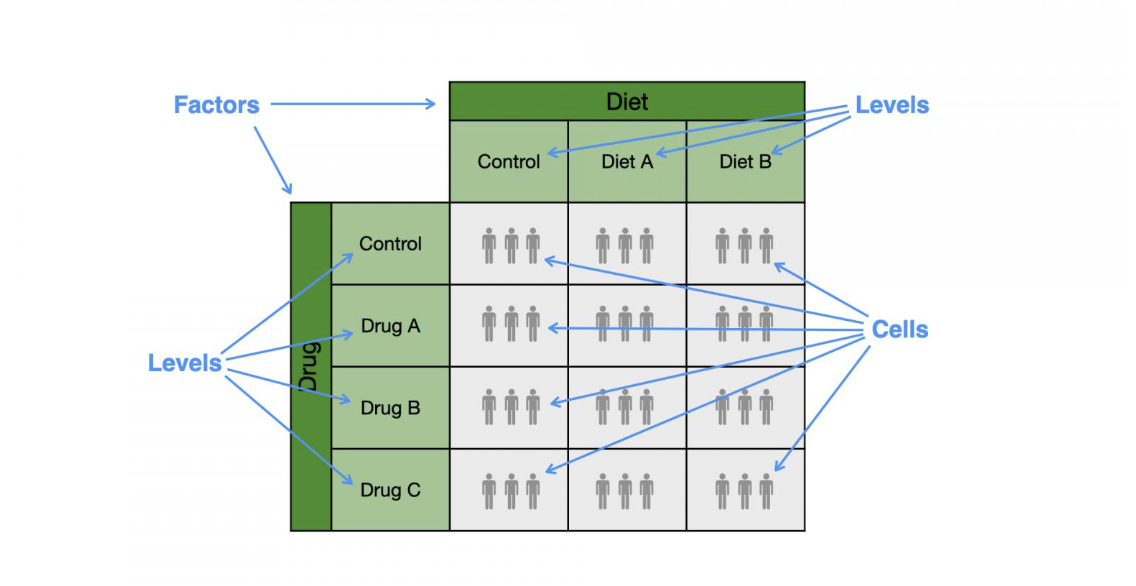
what are the catorigorical varibles and different types with that categorical varibles called when doing a two factor ANOVA
uses same terms as expiremental study designs
categorical varibale= factors: eg diets
different types within each factor = levels (e.g., control)
what is the intersection of two levels called
a cell
what is in each cell for the two factor ANOVA
Within each cell
, there will typically be several sampling units and the numerical variable is measured on each sampling unit.
For example, the above study shows three sampling units in each cell for a total of 36 sampling units across the entire study
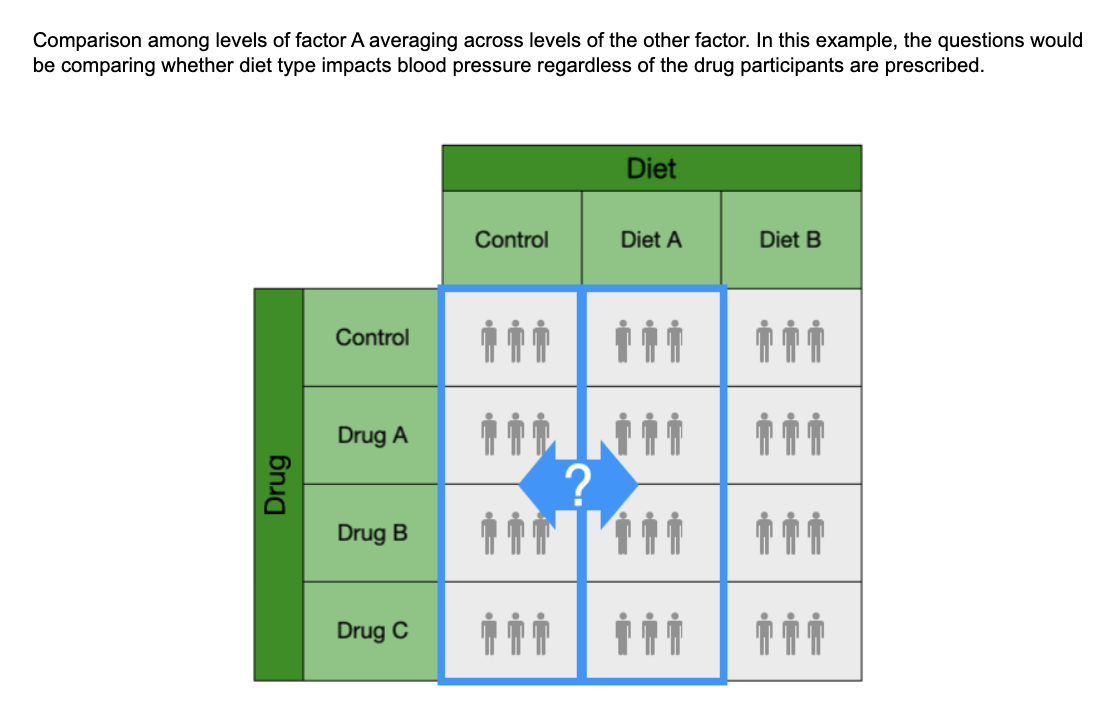
Two-factor ANOVAs are used to answer three questions: what are they
Main effects A
are questions about the differences among the levels of factor A averaging across the levels of factor B. These are comparisons among full columns (or full rows).
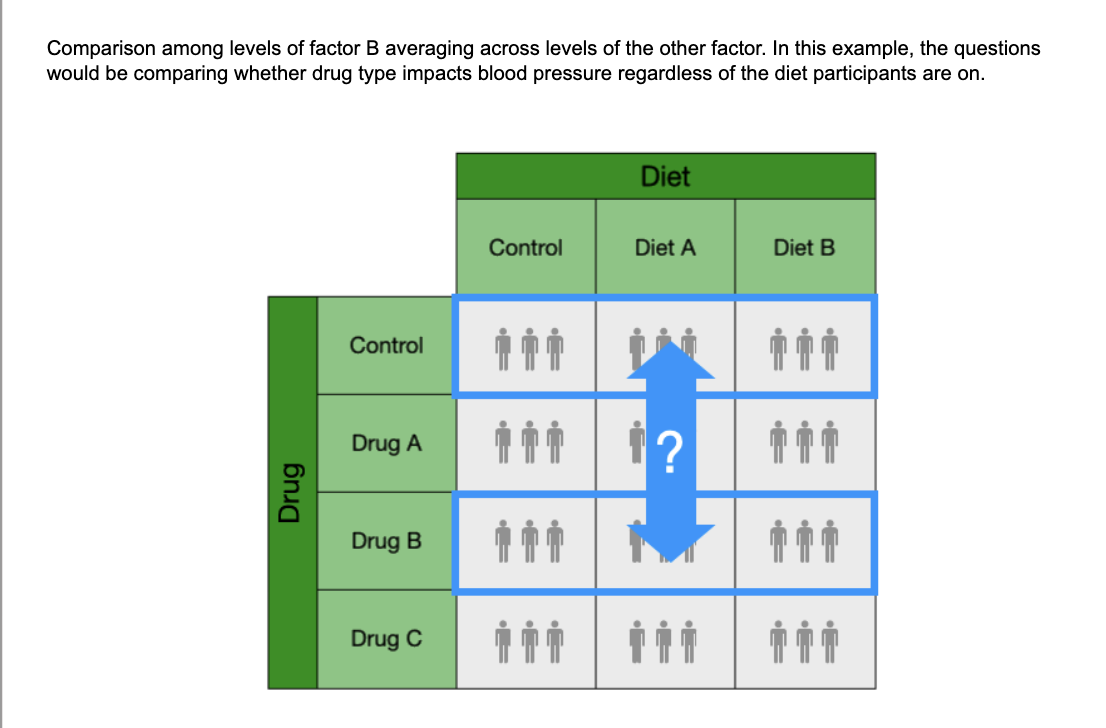
Main effects A
are questions about the differences among the levels of factor B averaging across the levels of factor A. These are comparisons among full rows (or full columns).
Interactions
are questions about the differences among the levels of one factor within each level of the other factor. These are cell-bycell comparisons.
What are main effects A
Comparison among levels of factor A averaging across levels of the other factor. In this example, the questions would be comparing whether diet type impacts blood pressure regardless of the drug participants are prescribed.
(the photo applys to every coloum)
What is main effects B
(applys to all rows)
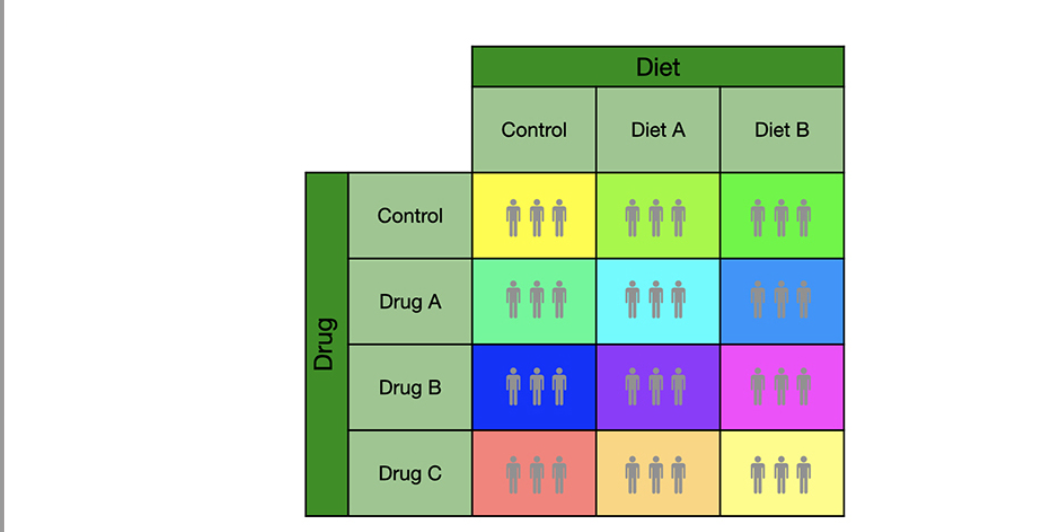
what are interactions
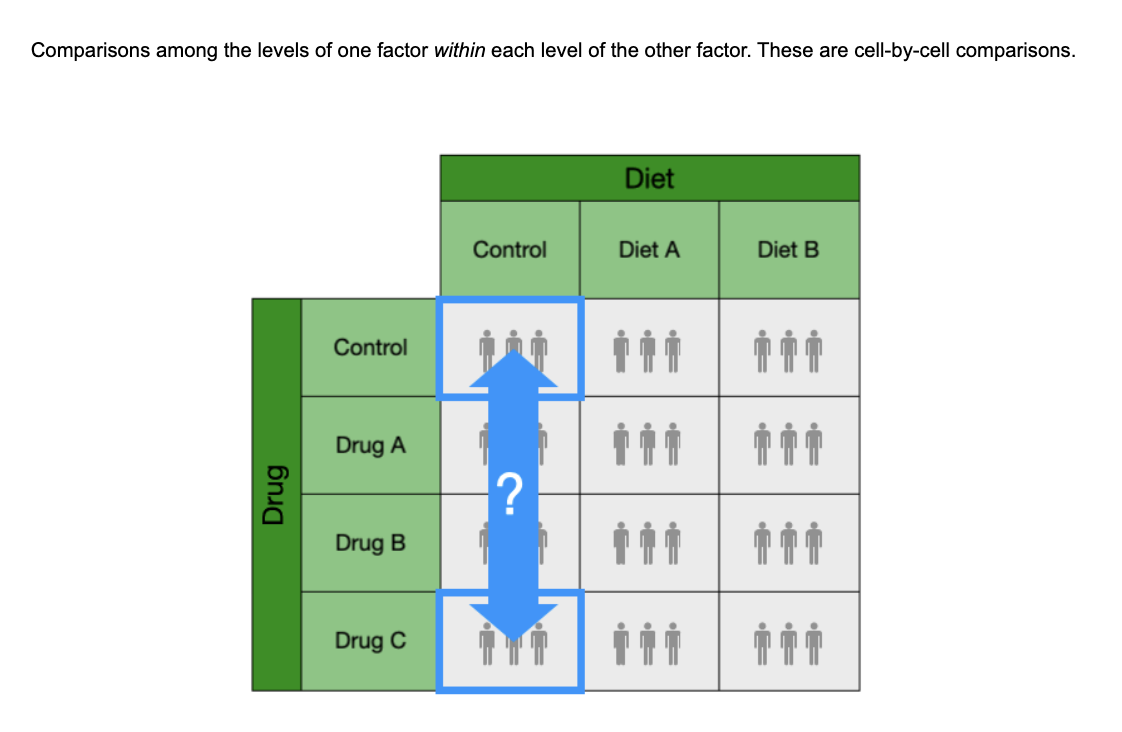
what is a interaction devaiting from?
An interaction is a deviation from the assumption that the levels of each factor simply add together.
Additivity:
Additivity is when the response to the combination of two levels is simply the sum of the two.
when does the response between in levels differ from additiity?
when the response differs this is interaction. this occurs when the persumed added interaction of cell does not meet what is actually seen
what is the common way to visulaized data with numerical and categorical varibles
box plots
T or F: a regualar box plot is great at vizulozong interactions
F: A better way to visualize interactions is to use a specialized plot known as an interaction plot
what is a Interaction plot
Interaction plot a specialized plot that highlights the interaction pattern between two categorical variables.
what are the 3 rules for setting up a intercation plots
The y-axis shows the numerical variable in the same way as box plots
The x-axis shows the levels one categorical variable
Lines are used to connect cells across the x-axis according to the levels of the other categorical variable
if the categorical varibles are additive (no interaction) what does the lines on the interaction plot look like?
parallel
if the categorical varibles have interaction what does the lines on the interaction plot look like?
they are not parellel
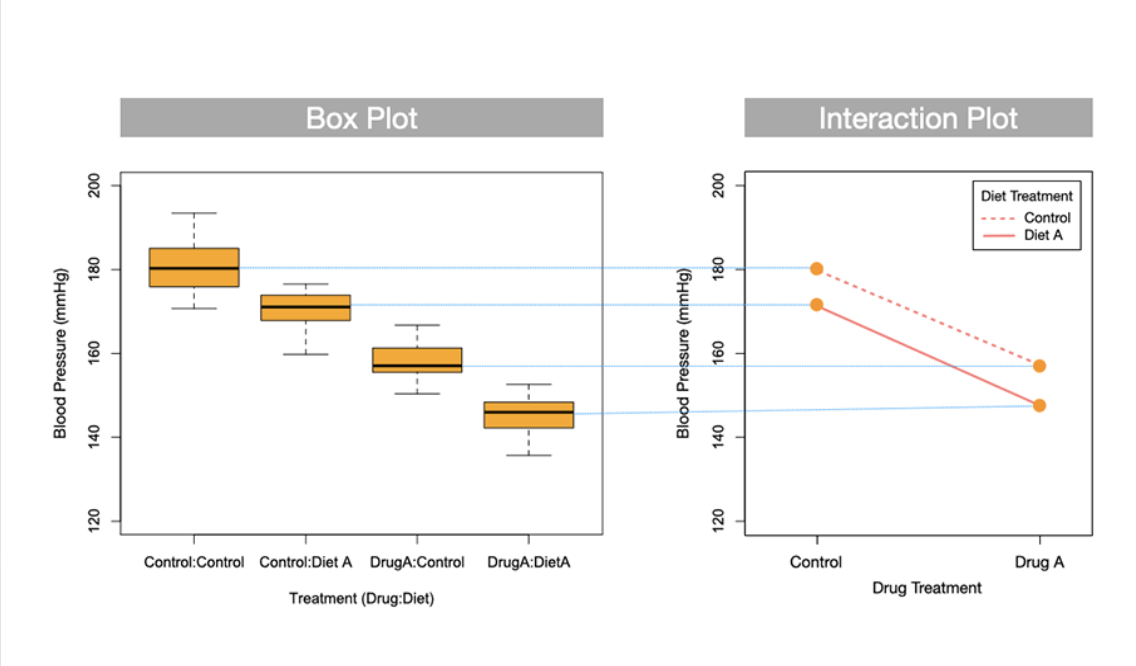
is this graph additive or have interaction
additive
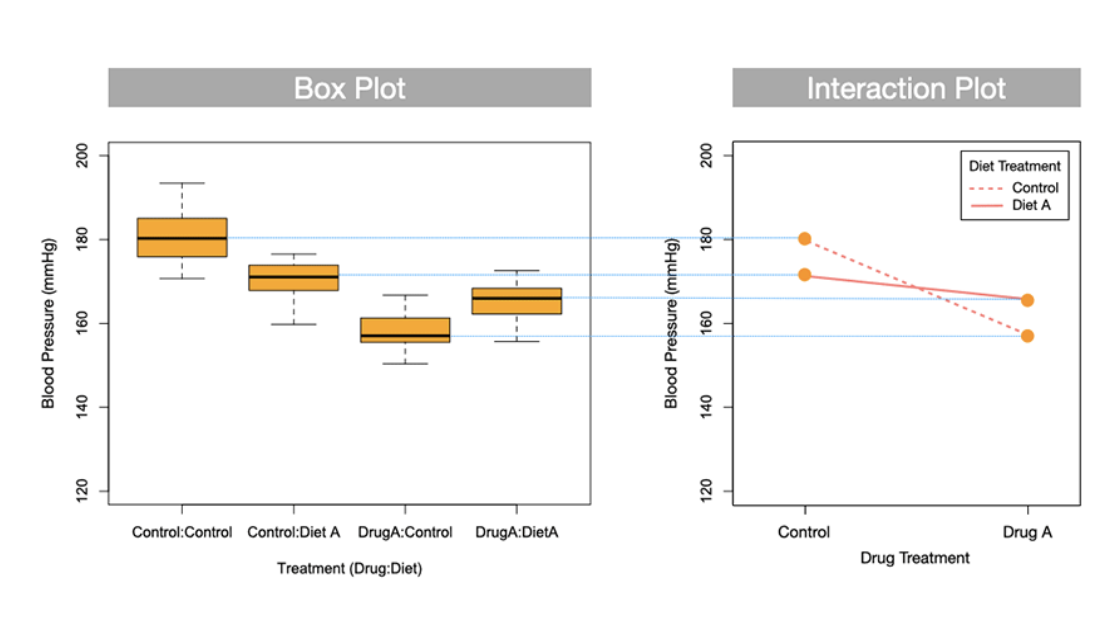
does this interaction box plot have interactions or is it additive
the levels have and anatagonist interaction (no parellel lines of the interaction plot)
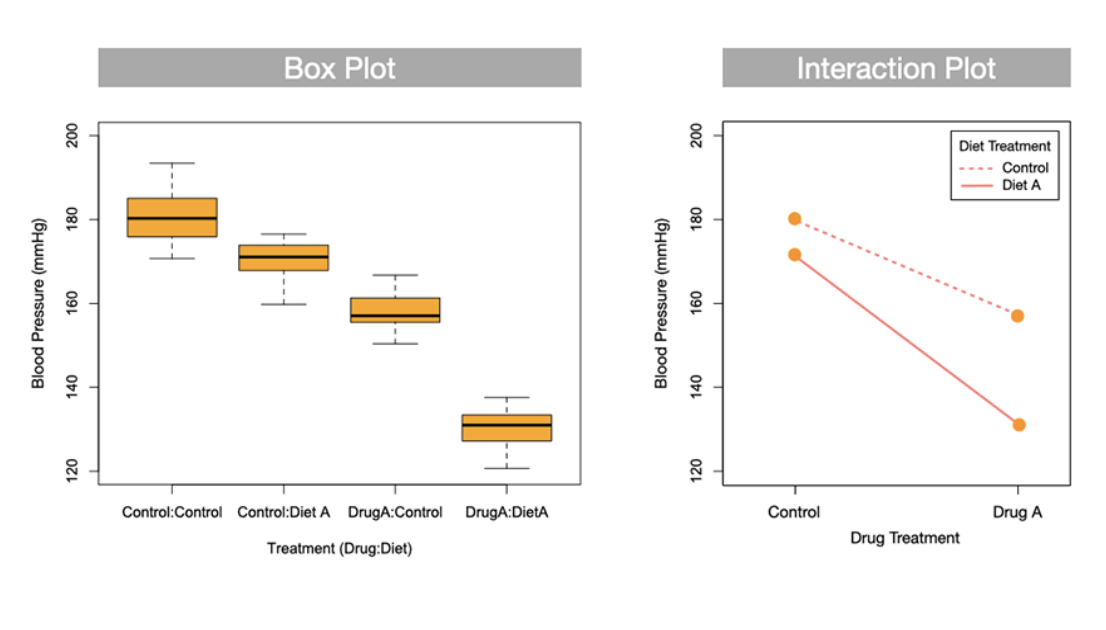
does this interaction box plot have interactions or is it additive
intercation (synergistic)
An investigator randomly assigns 30 college students into three equal size study groups (early-morning, afternoon, late-night) to determine if the period of the day at which people study has an effect on their retention. What type of test is most appropriate for this study?
Two-sample t-test
Correlation
Regression
Single-factor ANOVA
Two-factor ANOVA
Single-factor ANOVA (correct)
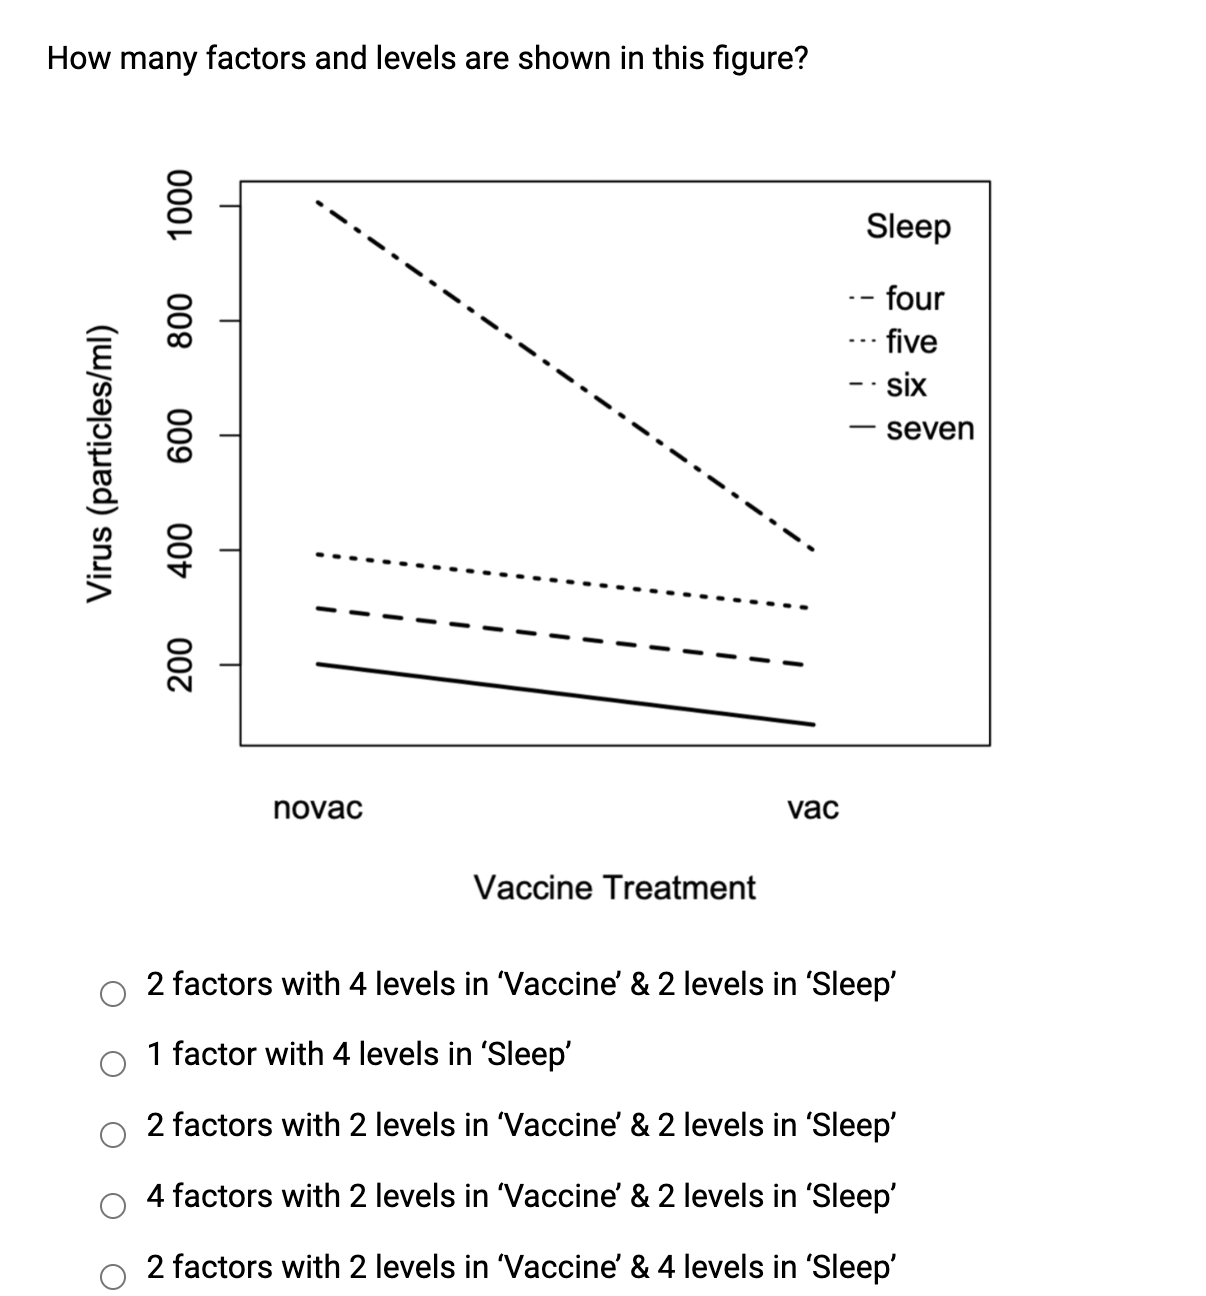
2 factors with 2 levels in ‘Vaccine’ & 4 levels in ‘Sleep’
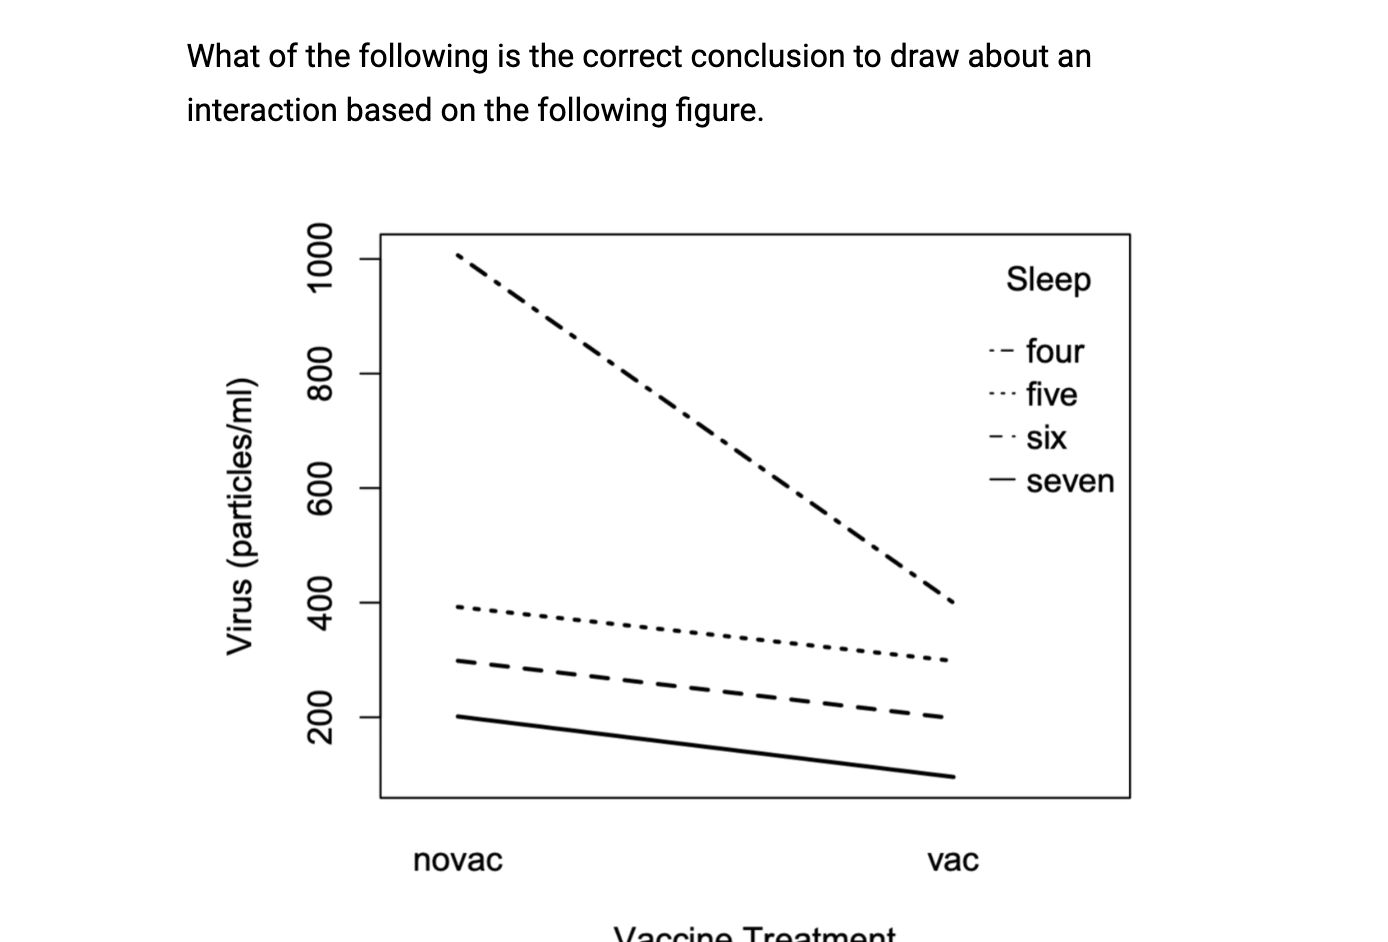
There is evidence of an interaction because the lines are not parallel. (correct)
All questions of the two factor ANOVA are evaluated using —— tests. As with all hypothesis tests, the two-factor ANOVA tests follows these four steps.
F-tests
Define the null and alternative hypotheses
Establish the null distribution
Conduct the statistical test
Draw scientific conclusions
what is the main effect null and alternative hypo?
Similar to single-factor ANOVA, the null hypothesis is that the means (μAi) are the same across all levels (i) of factor A. The alternative hypothesis is that the means are different somewhere. These are written symbolically as
HO: μA1=μA2=...=μAk-1=μAk
HA: μA1≠μA2≠...≠μAk-1≠μAk
The alternative should be interpreted as having a difference between at least two groups in factor A. It does not indicate how many groups beyond two might be different, nor indicate which groups.
what is the null and alternative of the main effect B
The null hypothesis is that the means (μBi) are the same across all levels (i) of factor B. The alternative hypothesis is that the means are different somewhere. These are written symbolically as
HO: μB1=μB2=...=μBk-1=μBk
HA: μB1≠μB2≠...≠μBk-1≠μBk
The alternative should be interpreted as having a difference between at least two groups in factor B. It does not indicate how many groups beyond two might be different, nor indicate which groups.
what is the null and alternative of interaction
The null hypothesis is that the deviation of each cell relative to additivity is zero. To help with writing the hypotheses as symbols, we use the notation AiBj to refer to the cell that corresponds to the ith level of factor A and the jth level of factor B. The null and alternative for are interaction are written symbolically as
HO: δA1B1=δA1B2=...=δAkBk-1=δAkBk=0
HA: δA1B1≠δA1B2≠...≠δAkBk-1≠δAkBk≠0
where δAiBj is the difference between the actual mean of cell AiBj and the mean expected from additivity. If the difference is zero (i.e., δAiBj=0) then there is no interaction and the cell mean is considered additive. The alternative should be interpreted as having a non-zero deviation from additivity in at least one cell. It does not indicate how many cell have non-zero deviations, nor indicate which cells.
what null hypothesis does this repersent: main effect A, main effect B, interaction
The null hypothesis is that the means (NAi) are the same across all k levels (I) of factor A. The alternative hypothesis is that the means are different somewhere.
For the example below, the null hypothesis states that the mean blood pressure for each diet type is the same.
Ho:MA1=NA2=...=MAK-1=MAK
HA:MA1‡MA27….‡MAK-1‡MAK
what null hypothesis does this repersent: main effect A, main effect B, interaction
The null for the interaction is that the deviation (o) of each cell relative to additivity is zero.
what null hypothesis does this repersent: main effect A, main effect B, interaction
Main Effect B null

T or F: The null distribution is different for each of the three F-tests.
T
main effect A null distrubtion
Main effects A The null distribution is the sampling distribution from repeatedly sampling a statistical population where the means are the same across all levels of factor A.
Main effect B null distribution
Main effects B The null distribution is the sampling distribution from repeatedly sampling a statistical population where the means are the same across all levels of factor B.
Interactions null distrubtion
Interactions The null distribution is the sampling distribution from repeatedly sampling a statistical population where the cell means are additive.
The F-tests in a two-factor ANOVA work by partitioning the data into four sources of variation: what are the four sources of variation:
Group variation factor A (MSA)
Group variation factor B (MSB)
AB interaction (MSAB)
Residual variation (MSE)
what are Sources of variation:
Sources of variation are the partitioning of the dataset by factor means, interactions and residuals that form the basis of the F-tests.
how do you calculate Group variation factor A (MSA)
Calculated as MSA=SSA/dfA, where SSA is the total group variation and dfA is the degrees of freedom. Degrees of freedom are dfA= a-1, where a is the number of levels in factor A.
what is Group variation factor A (MSA)
The variation among the means of the levels of factor A.
MSA=SSA/dfA
what is Group variation factor B (MSB)
The variation among the means of the levels of factor B. Calculated as MSB=SSB/dfB
how is Group variation factor B (MSB) calculated
Calculated as MSB=SSB/dfB, where SSB is the total group variation and dfB is the degrees of freedom. Degrees of freedom are dfB= b-1, where b is the number of levels in factor B.
what is AB interaction (MSAB)
The amount of variation attributable to the deviation from additivity.
how do you calculate AB interaction (MSAB)
Calculated as MSAB=SSAB/dfAB, where SSAB is the total variation of the cell deviations from additivity and dfAB is the degrees of freedom. Degrees of freedom are dfAB= (a-1)(b-1), where a is the number of levels in factor A and b is the number of levels in factor B.
how do you calculate Residual variation (MSE)
Calculated as MSE=SSE/dfE, where SSE is the total residual variation and dfE is the degrees of freedom. Degrees of freedom are dfE= ab(n-1), where a is the number of levels in factor A, b is the number of levels in factor B and n is the number of sampling units in each cell.
what is Residual variation (MSE)
The variation among sampling units within a cell.
T or F The three F-tests are built around different ratios of the sources of variation
T
what is the F-test/F-score of Main effects A
The F-score is F=MSA/MSE, where MSA is the group variation for factor A and MSE is the residual variation. This ratio of variances evaluates mean differences among factor A levels by quantifying the amount of factor A group variation relative to residual variation.
Main effects B the F-score / F-test
is F=MSB/MSE, where MSB is the group variation for factor B and MSE is the residual variation. This ratio of variances evaluates mean differences among factor B levels by quantifying the amount of factor B group variation relative to residual variation.
Interactions The F-score / F-test
is F=MSAB/MSE, where MSAB is the cell variation attributed to non-additivity and MSE is the residual variation. This ratio of variances evaluates an interaction by quantifying the amount of variation attributable to deviations from additivity relative to residual variation.
For all of the F-tests, the null and alternative are
HO: F≤1
HA: F>1
how does the F-test work?
the F-test works by locating the critical F-score (FC) that corresponds to the Type I error rate on F-distribution, and comparing that to the observed F-score (FO).
how is the statistical decision made?
The statistical decision can be made either
by comparing the observed and critical F-scores,
by comparing the corresponding p-value and Type I error rate.
The statistical decision is made as follows for the two factor ANOVA
Reject the null hypothesis if the observed score is greater than the critical score (i.e., FO>FC) or if the p-value is smaller than the Type I error rate (i.e., p<⍺).
Fail to reject the null hypothesis if the observed score is less than or equal to the critical score (i.e., FO≤FC) or if the p-value is larger or equal to the Type I error rate (i.e., p≥⍺).
T or F: The scientific conclusions for a two-factor ANOVA have to be done in two steps.
T
what is the 2 steps of the scientific conclusions for the two factor - ANOVA test
STEP 1 Evaluate the interaction
STEP 2: Evaluation of main effects
STEP 1 Evaluate the interaction The scientific conclusions are either
Reject the null hypothesis and conclude there is evidence that at least one cell deviates from additivity.
Fail to reject the null hypothesis and conclude there is no evidence that the cells deviate from additivity.
If the conclusion is to reject the null hypotheses, then the main effects should not be evaluated. The reason is that the presence of an interactions says the change in means across levels of one factor differs depending on the level of the other factor.
T of F: If the conclusion is to reject the null hypotheses, then the main effects should not be evaluated.
T:
The reason is that the presence of an interactions says the change in means across levels of one factor differs depending on the level of the other factor.
when do you evaluate the main effect (step 2)
If the interaction is not significant (additive), then the factors are considered additive and it is appropriate to look at the main effects for each.
STEP 2: Evaluation of main effects the scientific conclusions are either
Reject the null hypothesis and conclude there is evidence that the means of at least two levels are different in the factor.
Fail to reject the null hypothesis and conclude there is no evidence that the means among levels are different in the factor.
T of F if the scienfic conculsion is reject the null hypothesis, the scientific conclusion cannot make any statement about where the means may be different. It only states that there is a different somewhere.
T
Reporting of an ANOVA should include the following:
The mean, standard deviation, and sample size for each group (ideally in a table)
The observed F-score (two decimal places)
degrees of freedom for the group variation and the residual variation
p-value (three decimal places)
What type of sum of squares measures the variability of the observed values of the response variable around their respective cell means?
Main effects A
Main effects B
Interaction
Residual
Residual
What does a significant AB interaction mean in a two-way ANOVA?
There must be significant main effects for Factors A and B.
The main effects for Factors A and B must be short of significance.
The affect of factor A depends on the level of factor B.
If there are significant main effects, they must be interpreted first before interpreting the interaction.
The affect of factor A depends on the level of factor B. (correct)
A study looking at how much consumers are willing to pay for different brands in different seasons is best analyzed using
Two-sample t-test
Chi-square test
Regression
Single-factor ANOVA
Two-factor ANOVA
Two-factor ANOVA
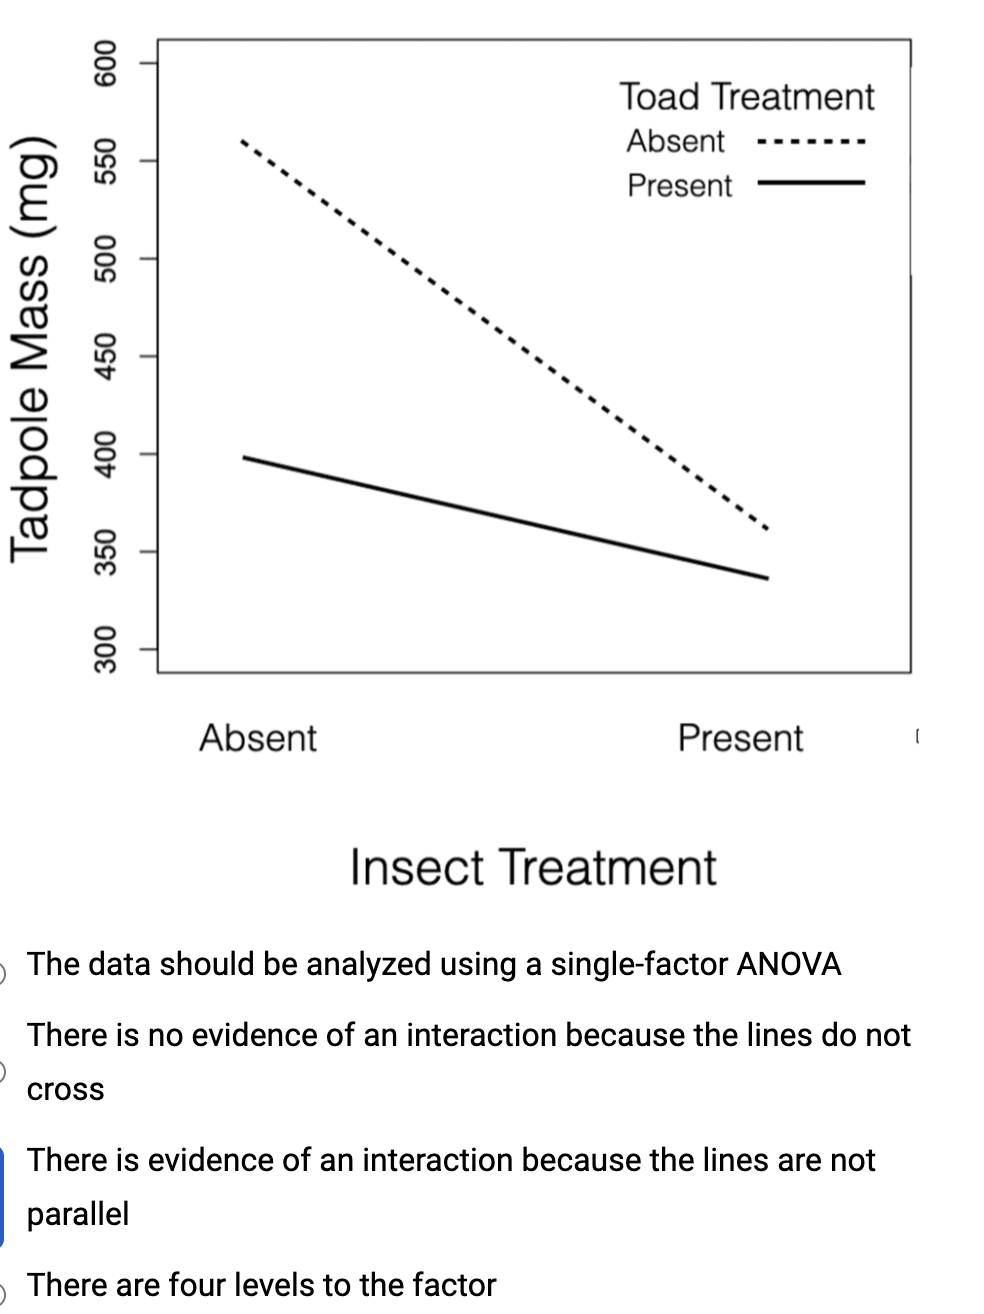
There is evidence of an interaction because the lines are not parallel