Money, Growth, and Inflation
1/25
There's no tags or description
Looks like no tags are added yet.
Name | Mastery | Learn | Test | Matching | Spaced |
|---|
No study sessions yet.
26 Terms
If the price level increased from 200 to 250, then what was the inflation rate?
a. 50 percent
b. 25 percent
c. 20 percent
d. None of the above is correct.
b. 25 percent
Deflation
a. increases incomes and enhances the ability of debtors to pay off their debts.
b. increases incomes and reduces the ability of debtors to pay off their debts.
c. decreases incomes and enhances the ability of debtors to pay off their debts.
d. decreases incomes and reduces the ability of debtors to pay off their debts.
d. decreases incomes and reduces the ability of debtors to pay off their debts.
If P denotes the price of goods and services measured in terms of money, then
a. 1/P represents the value of money measured in terms of goods and services.
b. P can be regarded as the “overall price level.”
c. an increase in the value of money is associated with a decrease in P.
d. All of the above are correct.
d. All of the above are correct.
When the money market is drawn with the value of money on the vertical axis, if the price level is
above the equilibrium level, there is an
a. excess demand for money, so the price level will rise.
b. excess demand for money, so the price level will fall.
c. excess supply of money, so the price level will rise.
d. excess supply of money, so the price level will fall.
b. excess demand for money, so the price level will fall.
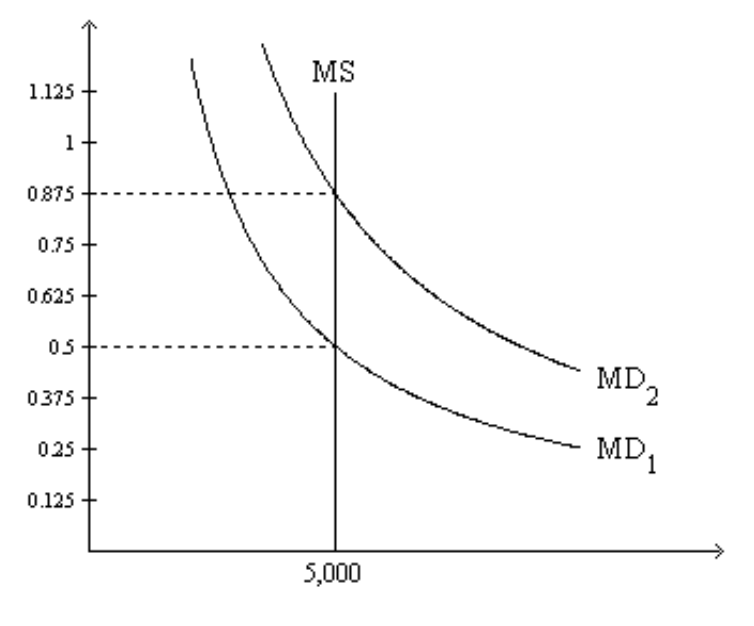
On the graph, MS represents the money supply and MD represents money demand. The usual quantities are measured along the axes.
5. Refer to Figure 1. If the relevant money-demand curve is the one labeled MD1, then the equilibrium value of money is
a. 0.5 and the equilibrium price level is 2.
b. 2 and the equilibrium price level is 0.5.
c. 0.5 and the equilibrium price level cannot be determined from the graph.
d. 2 and the equilibrium price level cannot be determined from the graph.
a. 0.5 and the equilibrium price level is 2.

Refer to Figure 1. If the relevant money-demand curve is the one labeled MD1, then
a. when the money market is in equilibrium, one dollar purchases one-half of a basket of goods and services.
b. when the money market is in equilibrium, one unit of goods and services sells for 2 dollars.
c. there is an excess demand for money if the value of money in terms of goods and services is 0.375.
d. All of the above are correct.
d. All of the above are correct.

7. Refer to Figure 1. Suppose the relevant money-demand curve is the one labeled MD1; also suppose the velocity of money is 4. If the money market is in equilibrium, then the economy’s real GDP amounts to
a. 2,500.
b. 7,500.
c. 10,000.
d. 40,000.
c. 10,000.

Refer to Figure 1. Suppose the relevant money-demand curve is the one labeled MD1; also suppose the economy’s real GDP is 20,000 for the year. If the money market is in equilibrium, then how many times per year is the typical dollar bill used to pay for a newly produced good or service?
a. 4
b. 2
c. 8
d. 10
c. 8
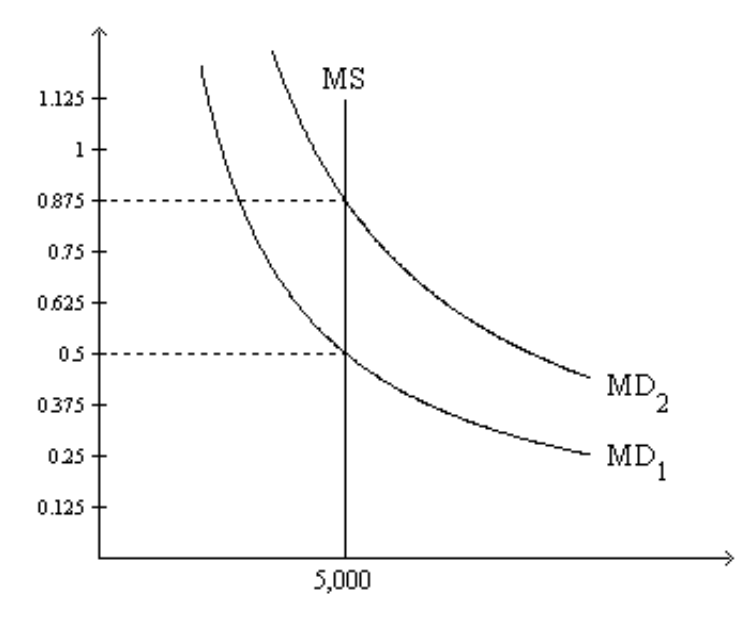
Refer to Figure 1. At the end of 2009 the relevant money-demand curve was the one labeled MD2. At the end of 2010 the relevant money-demand curve was the one labeled MD1. Assuming the economy is always in equilibrium, what was the economy’s approximate inflation rate for 2010?
a. -43 percent
b. -57 percent
c. 57 percent
d. 75 percent
d. 75 percent
If the price level increased from 200 to 250, then what was the inflation rate?
a. 50%
b. 25%
c. 20%
d. None of the above is correct.
b. 25%
Deflation
a. increases incomes and enhances the ability of debtors to pay off their debts.
b. increases incomes and reduces the ability of debtors to pay off their debts.
c. decreases incomes and enhances the ability of debtors to pay off their debts.
d. decreases incomes and reduces the ability of debtors to pay off their debts.
d. decreases incomes and reduces the ability of debtors to pay off their debts.
If P denotes the price of goods and services measured in terms of money, then
a. 1/P represents the value of money measured in terms of goods and services.
b. P can be regarded as the “overall price level.”
c. an increase in the value of money is associated with a decrease in P.
d. All of the above are correct.
d. All of the above are correct.
When the money market is drawn with the value of money on the vertical axis, if the price level is above the equilibrium level, there is an
a. excess demand for money, so the price level will rise.
b. excess demand for money, so the price level will fall.
c. excess supply of money, so the price level will rise.
d. excess supply of money, so the price level will fall.
b. excess demand for money, so the price level will fall.
The price level rises if either
a. money demand or money supply shifts rightward.
b. money demand shifts rightward or money supply shifts leftward.
c. money demand shifts leftward or money supply shifts rightward.
d. money demand or money supply shifts leftward.
c. money demand shifts leftward or money supply shifts rightward.
On a given morning, Franco sold 40 pairs of shoes for a total of $80 at his shoe
a. The $80 is a real variable. The quantity of shoes is a nominal variable.
b. The $80 is a nominal variable. The quantity of shoes is a real variable.
c. Both the $80 and the quantity of shoes are nominal variables.
d. Both the $80 and the quantity of shoes are real variables.
b. The $80 is a nominal variable. The quantity of shoes is a real variable.
When shopping you notice that a pair of jeans costs $20 and that a tee-shirt costs $10. You compute the price of jeans relative to tee-shirts.
a. The dollar price of jeans and the relative price of jeans are both nominal variables.
b. The dollar price of jeans and the relative price of jeans are both real variables.
c. The dollar price of jeans is a nominal variable; the relative price of jeans is a real variable.
d. The dollar price of jeans is a real variable; the relative price of jeans is a nominal variable.
c. The dollar price of jeans is a nominal variable; the relative price of jeans is a real variable.
In 1975 tuition at Wattsomata University was $2,500 and the consumer price index was 80. In 2011 tuition was $12,000 and the price index was 320. Which of the following is correct?
a. Nominal and real tuition were both higher in 1975.
b. Nominal and real tuition were both higher in 2011.
c. Nominal tuition was higher in 1975, real tuition was higher in 2011.
d. Nominal tuition was higher in 2011, real tuition was higher in 1975.
b. Nominal and real tuition were both higher in 2011.
According to the classical dichotomy, which of the following is not influenced by monetary factors?
a. real GDP.
b. real wages.
c. real interest rates.
d. All of the above are correct.
d. All of the above are correct.
If M = 12,000, P = 3, and Y = 32,000, then velocity =
a. 1.125. Velocity will rise if money changes hands more frequently.
b. 1.125. Velocity will rise if money changes hands less frequently.
c. 8. Velocity will rise if money changes hands more frequently.
d. 8. Velocity will rise if money changes hands less frequently.
c. 8. Velocity will rise if money changes hands more frequently.
What is the classical theory of money?
Quantity theory of money, Explain the long-run determinants of the price
level, Explain the inflation rate
What is money demand and what does it depend on?
Reflects how much wealth people want to hold in liquid form, depends on credit cards, availability of ATM machines, interest rate, average level of prices in economy, the demand curve is downward sloping
What is the money supply determined by?
the Fed and the banking system, the supply curve is vertical in the long run, money supply and money demand are brought into equilibrium by the overall level of prices
When economy is in equilibrium what happens?
If the Fed doubles the supply of money they Prints bills and Drops them on market. Or the Fed open-market purchase the New equilibrium supply curve shifts right and the Value of money decreases while Price level increases
What are nominal variables?
Variables measured in monetary units dollar prices
What are real variable prices?
Variables measured in physical units, Relative prices, real wages, real interest rate
What is velocity of money equation?
V = (P × Y) / M
P = price level (GDP deflator)
Y = real GDP
M = quantity of money