AP Psych research Methods
1/31
There's no tags or description
Looks like no tags are added yet.
Name | Mastery | Learn | Test | Matching | Spaced |
|---|
No study sessions yet.
32 Terms
Case Study
One person or group is studying in dept
Sometimes we don't have access to a lot of people with certain rare conditions
It's hard to generalize to others when you only study one person
Naturalistic Observation
Jane goodall and chimpanzee
The researcher goes into someone's natural environment.
Observing and recording only
Like you're invisible
No manipulation
Describe behavior, not explain it.
Meta Analysis
a statistical technique that combines and analyzes the results from many different studies on the same topic or question to produce a single, overall estimate of the effect.
provides a "big picture" view by statistically pooling the data from individual studies to reveal the overall size and consistency of an effect, offering a more powerful and evidence-based conclusion than any single study alone.
Correlation
A measure of the extent to which two factors change together and thus of how well either factor predicts the other.
Relationship between two variables
How well does A predict B
positive correlation
as one variable goes up, the other goes up (vice versa; it can be the same with down) (height and weight on kids' growth charts)
When you grow, you should be growing taller and gaining weight
negative correlation
as one variable increases, the other variable goes down (college alcohol consumption and GPA)
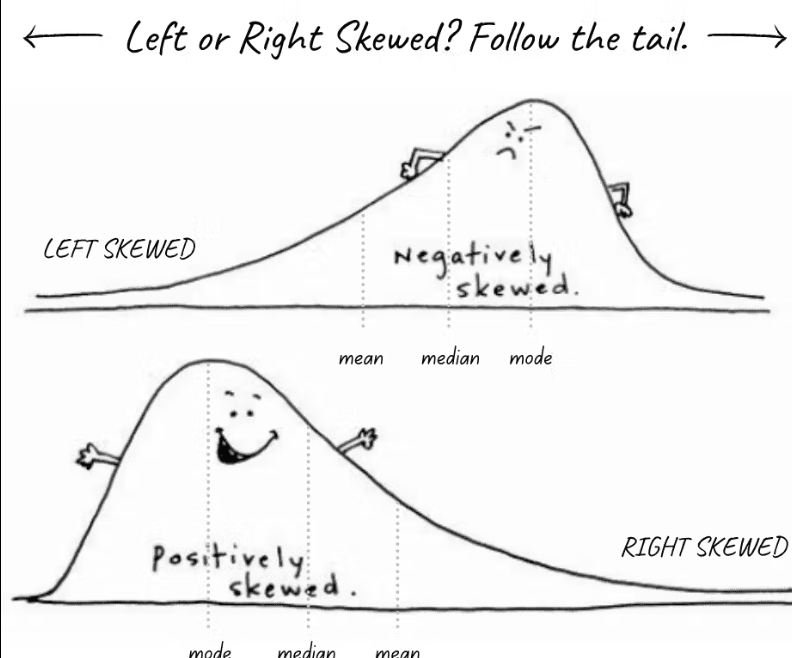
Correlation and causation
You cannot say correlation does not equal causation
You can say there is a RELATIONSHIP (positive or negative) or no relationship
Example: amount of study and grades
Correlation coefficient
Strength of the correlation is measured by the correlation coefficient, a statistical index of the relationship between two variables (from -1.0 to +1.0).
The closer to +1 or -1, the stronger the relationship (between .95 very strong)
-92 and 85. -92 is stronger
Scatter plots
a graphed cluster of dots, each of which represents the values of two variables
The slope suggests the direction of the relationship
The amount of scatter suggests the strength of the correlation – here, there is no relationship – Height and Temperament (personality).
Experiment
a research method where an investigator manipulates one or more factors (independent variables) to observe the effect on some behavior or mental process (the dependent variable).
Can determine cause and effect!
Independent Variable
the variable whose effect is being studied.
What is being manipulated
Dependent Variable
the variable that may change in response to the independent variable.
What is being measured
New anxiety medication and symptoms of anxiety.
Operational Definition
is a carefully worded statement describing the exact procedures (operations) used in a research study.
Measurable and manageable! We want to make sure others can replicate.
Human Intelligence – IQ test score
Stress – score on PSS (Perceived Stress Score)
Control Group
Does not receive the treatment
Serves to evaluate the effect of the treatment.
Random Sampling
A group of participants is selected from a larger population, where every individual in the population has an equal and independent chance of being chosen.
The goal of random sampling is to create a sample that is representative of the entire population, allowing researchers to generalize their findings to that broader group.
Random Assignment
Randomly assign participants to either the experimental or control groups by chance.
Equalizes the two groups
Reduces preexisting differences between the groups (confounding variables).
Representative Sample
subset of a larger group (a population) that accurately reflects the characteristics of that whole group
Doble Blind procedure
procedure where both the participants and the research staff are ignorant (blind) about whether the participants have received the treatment or the placebo.
Limits Experimenter Bias
Commonly used in drug-evaluation studies
Placebo effect
experimental results caused by expectations alone.
Any effect on behavior caused by giving a substance or condition, which the recipient assumes is an active agent.
Social desirability Bias
tendency for people to provide answers that may be dishonest so they will look good.
A confounding variable
a factor other than the independent variable that might produce an effect in an experiment.
Qualitative Data
cannot be translated to numbers (interviews most common).
Qantitative Data
numerical data (Likert scales 1-5) Think quantity/amount.
Standard deviation (definition only, not formula)
a computed measure of how much scores vary/differ around then mean score. (don't need to know the formula)
Statistical Significance
You are trying to determine the likelihood that your result was due to your independent variable, rather than just chance.
To be statistically significant, you want your statistic to be as close to p=.05 What does this mean?
Need to know p=.05
5% likely the results are due to chance
95% Sure that the IV caused the DV
Effect Size
the strength of the relationship between two variables. In other words, the larger the effect size, the more one variable can be explained by another
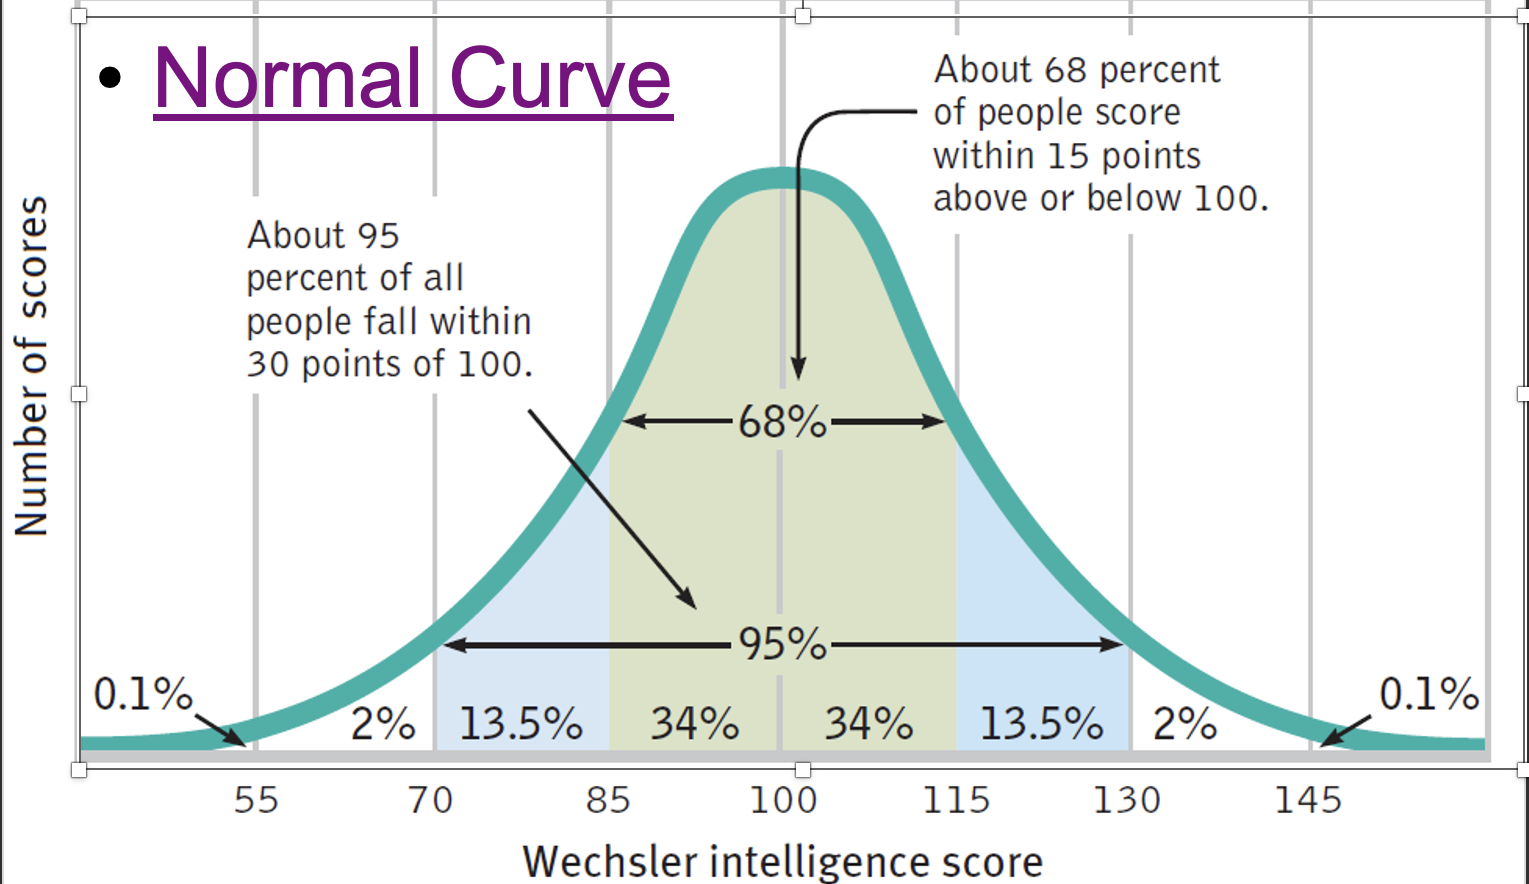
Normal curve
The percentages are going to be the same
By the numbers (55-145) will always change because of the data
A symmetrical, bell-shaped curve that describes the distribution of many types of data.
In a normal distribution the mean, median, and mode are ALL the same number.
Informed Consent
participants should be told enough to enable them to choose whether they wish to participate
Informed Assent
need agreement from those under 18 or cognitively impaired.
Deception
It's okay, but must debrief.
After the experiment, the researcher debriefs the participants, explaining the study, including its purpose and any deception used
Debriefing
post-study when the researchers explain the true purpose of the Study to the participants, especially if deception was used to obtain informed consent and address any confusion
Positive and negative skew