AP Micro / 2.8 Govt Intervention
0.0(0)
Studied by 1 personCard Sorting
1/3
Earn XP
Description and Tags
Last updated 2:27 PM on 12/11/24
Name | Mastery | Learn | Test | Matching | Spaced | Call with Kai | Chat |
|---|
No analytics yet
Send a link to your students to track their progress
4 Terms
1
New cards
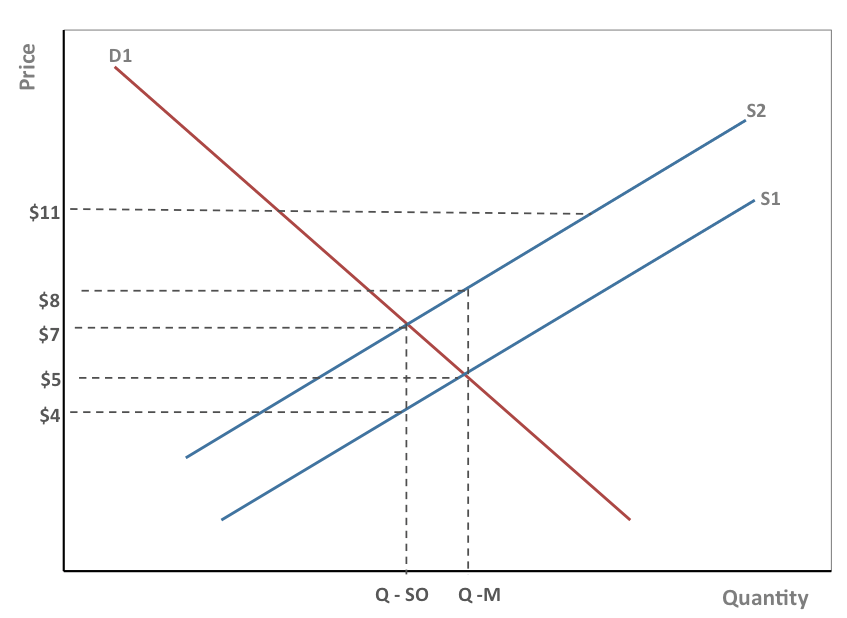
Explain what caused the graph to shift its supply from S1 to S2, and how that affects either supply or demand.
Because the graph shifts its supply up parallel, it means an excise tax was imposed, and demand will be lowered at equilibrium.
2
New cards
What is an excise tax?
A tax that raises the price of each unit of goods.
3
New cards
What is a subsidy and why are they given to producers?
A government payment to producers for each unit sold to encourage production and lower market prices.
4
New cards
a
a