Module 1
1/28
Earn XP
Description and Tags
Name | Mastery | Learn | Test | Matching | Spaced | Call with Kai |
|---|
No analytics yet
Send a link to your students to track their progress
29 Terms
What is data visualization?
Visualization is typically used for data exploration and making the unseen visible.
Why visualization works?
Based on human perception, exploit pattern recognition capabilities of the human visual system, eyes act as a very high-bandwidth channel to the brain, large portion dedicated to visual processing, processing occurs in parallel at the precociousness level.
Why not statistics or ML instead of Viz ?
Statistics for different dataset can be the same. Wrong conclusion can be drawn from same statistics. One outlier in the data can mess up the statistics.
What is information visualization?
The use of computer-supported, interactive, visual representations of abstract data to amplify cognition.

Why human in the loop?
Visual representations of datasets and interactions designed to help people carry out tasks more effectively.
For well-defined questions, stats or ML are often sufficient.
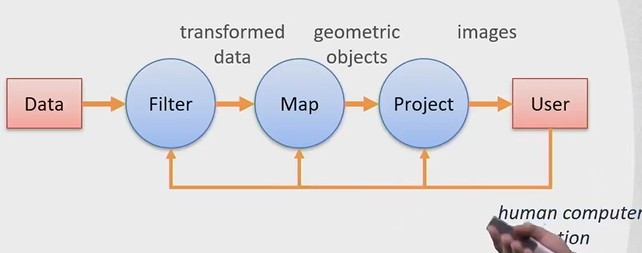
Visualization pipeline
Data —> Filter (transform data) —> Map (geographical objects) —> project (images) —> User.
Goals of visualisations?
To explore - data exploration.
To analyze - verification or falsification
To present - communication of results.
Visualization Design
Huge space of design alternatives.
there are always tradeoffs.
Many possibilities are know to be ineffective.
Guidelines continue to evolve.
Visualization design process
Look at the design space as globally as possible.
If you start with specific thought, you will limit your space, ending up in bad visualization.
Question to ask while validation of visual design ?
How do you know if the visual design works?
better?faster?
more effective?
get more insights?
What sort of tasks do we need to evaluate?
Who are the intended users?
Which data are we using?
Validation is a difficult task.
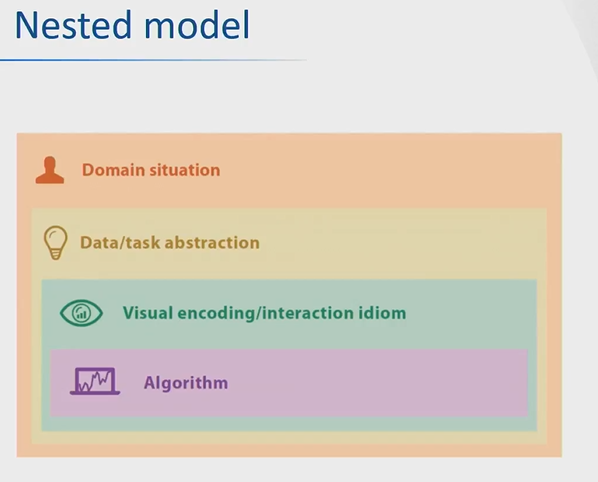
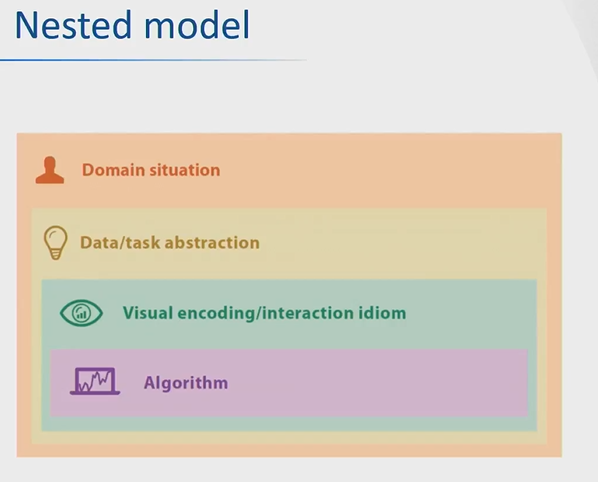
Nested model for Design process.
Iterative/refinement process.
Domain situation, Data/task abstraction, visual encoding/interaction idioms, algorithms.
Domain situation - problem characterization
Understanding data, tasks, users.
1. Users:
what are their needs/wants/limitations/skills? What is their workflow?
How to provide actionable knowledge?
what decision must be made?
what information is relevant for that?
How to make them?
Happy/enthusiastic/satisfied?
Data:
use domain specific vocabulary.
Produce a set of tasks/questions of target users on the data on different levels.
Information obtained through interviews, observations.
Data/task abstraction
Converts a domain situation to a visualization problem.
Abstraction of data and task in terms of table, hierarchy, sets, search, compare, see trends, etc.
Visual encoding/interaction idioms
Take the data, task, and analyses to visualizations.
explore design space.
1. Sketching is important: find solution, structure, break and make solution.
2. Engineering, systematic approach
Algorithm
Layout algorithm, ordering, rendering.
Disadvantages of nested models
A mistake at the higher level cannot be corrected on the lower.
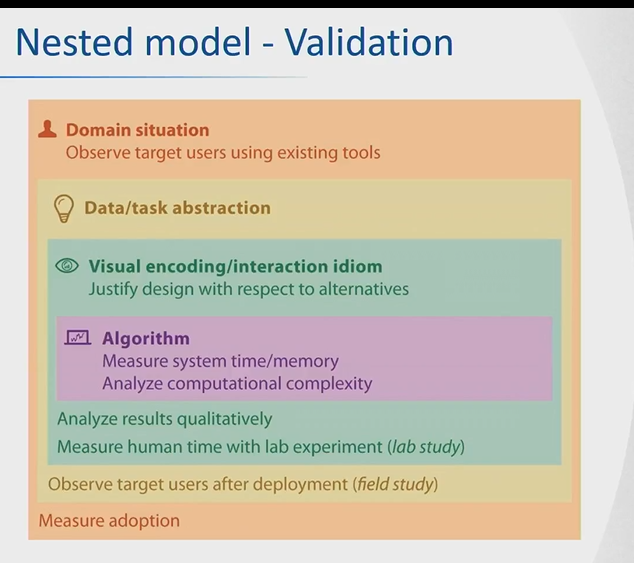
Nested model - Validation
Visual Encoding Design - Analysis framework
Domain and data/task abstraction
What about the data → data abstraction
Why is the user looking at → task abstraction.
Visual encoding/interaction idiom
How is it shown → visual encoding and interaction.
What? Data abstraction.
Data and Dataset types:
Tables: Items and attributes.
Networks and Trees: Items, Links and attributes.
Fields: Grids, positions, attributes.
Geometry: Items, positions.
Clusters, Sets, Lists: Items
What ? (Attributes) Data abstractions
Attributes → columns
Key attribute → ID.
Types of Attribute
Categorical - No order at all. E.g. Fruits, colors, shapes
Ordered -
Direction: Sequential: Age, length, weight, Diverging: temperature, , Cyclic: weeks, months.
ordinal - Have an order. E.g Age, temperature. NO CONTINUOUS SPACE.
quantitative - Continuous space.
Dataset Availability: static and dynamic.
ID: IS CATEGORICAL, because it does not have an intrinsic meaning.
Task Abstraction
Is this a good visualisation? Main question
Domain question might be too vagure, not relevant, hard to understand without domain knowledge, hard to match to a proposed solution.
We need to translate domain language into more abstract structures.
Reason about the most appropriate encoding.
Reflect about differences and commonalities.
Task abstraction - Tuples as Tuples (Actions and Target).
Actions: Analyze, Search, Query - How vis is used.
Targets: All Data, Attributes, Network data, Spatial data - Aspects of data of interest.
Actions - Analyze
Consume:
Discover: Fine new knowledge, generate hypothesis, verify.
Present: Communication of information.
Enjoy: Causal encounters.
Produce:
Annotate: addition of graphical or textual annotations to existing data, Typically manual.
Record: Save/capture
Derive: Produce new data elements based on existing data elements.
Action - Search
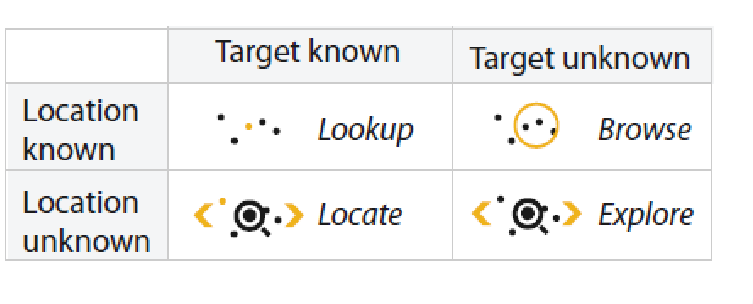
Action - Query
Identify: characteristics of single target.
Compare: Compare multiple targets.
Summarise : Summarization of all possible targets.
Target - All data
Trend - high level patterns in the data, increase, decrease, peak, valley.
Outliers - Data that does not fit with backdrop or normal behavior.
Features - Particular structures of interest, task and data dependent.
Target - Attributes
One
Distribution - extremes
Many
Dependency
Correlation
Similarity.
Targets - Network and Spatial Data
Topology - paths
Spacital Data - shape