parametric tests, hypothesis testing, correlation and anova & z-test and chi-square test
 Call Kai
 Learn
Learn Practice Test
 Spaced Repetition
 Match
Match Flashcards
 Knowt Play
1/124

There's no tags or description
Looks like no tags are added yet.
Name | Mastery | Learn | Test | Matching | Spaced | Call with Kai | Chat |
|---|
No analytics yet
Send a link to your students to track their progress
125 Terms
PARAMETRIC TESTS
the tests applied to data that are normally distributed, the levels, of measurements which are expressed in the interval and ratio.
the distribution is normal
We use a parametric test when
The level of measurement to be analyzed is expressed in interval and ratio data.
We use a parametric test when
t-test for independent sample
t-test is a test of the difference between two independent groups where the means are compared (-x1 & -x2)
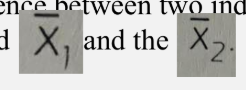
When we compare the means of two independent groups
When do we use the t-test for independent samples?
When the samples are less than 30
When do we use the t-test for independent samples?
formula for t-test for independent samples
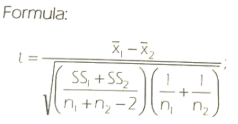
T-tests for Correlated Samples (paired t-test)
another parametric test applied to one group of samples
When the samples are less than 30.
when do we use paired t-test / t-test for correlated samples?
T-tests for Correlated Samples (paired t-test)
can be used in the evaluation of certain program or treatment
When the mean before (pretest) and the mean after (post test) are being compared
When do we use the t-test for a correlated sample?
to find out if a difference exists between the before and
after means.
Why do we use the t-test for correlated samples?
an appropriate test for the evaluation of government programs. This is used in an experimental design to test the effectiveness of a certain technique or method or program that had been developed
Why do we use the t-test for correlated samples?
formula for t-test for correlated samples / paired t-test
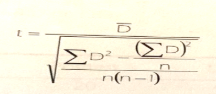
Correlation
is a measure of relationship between two variables.
Coefficient of correlation
determines validity, reliability and objectivity of an examination prepared.
Coefficient of correlation
It also indicates the amount of agreement or disagreement between
groups of scores, measurements, or individuals.
from -1.00 through 0.00 up to +1.00
Correlation ranges in value
Positive Correlation
it indicates that as the value of x increases the value of y also increases. Likewise, if the value of x decreases, the value of y also decreases.
negative correlation
it indicates that for every increase of x, there’s a corresponding decrease of y. likewise, for every decrease of x, there’s a corresponding of y.
the relationship is inverse.
Pearson Product Moment Coefficient of Correlation
Pearson r
It is used to find the correlation between interval and ratio data.
What is the Pearson r?
used to determine the index of relationship between two variables, the independent and the dependent variables.
What is the Pearson r?
x
in pearson r, the independent variable can be represented by
y
in pearson r, the dependent variable can be represented by
-1, zero to +1
the value of r is
there exist a perfect correlation between x and y.
If the value r is +1 or -1,
then x and y are independent of each other
if r equals zero
We want to analyze if a relationship exists between two variables.
Why do we use Pearson r?
Why do we use Pearson r?
If there is a relationship that exist between x and y, then we can
determine the extent that of x influences y by means of the
coefficient of determination (COD) which is equal to the square
of r and multiplied by 100.
When do we use Pearson r?
used to determine the index of relationship between two variables, the independent and the dependent variables.
perfect positive correlation
if r = +1
negative perfect correlation
if the value of r = -1
then there is no correlation between two variables x and y.
if r = 0
formula for pearson r
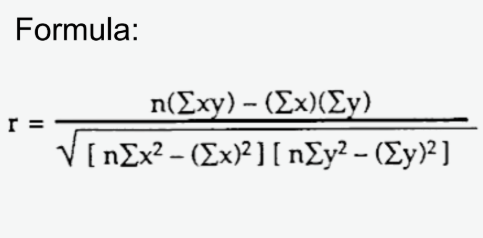
verbal interpretation:
No Correlation
correlation interpretation:
range = 0
verbal interpretation:
Indifferent, almost negligible relationship
correlation interpretation:
range = ±0. 01 - ± 0.20
verbal interpretation:
Low correlation, slight relationship
correlation interpretation:
range = ± 0.21 - ± 0.40
verbal interpretation:
Moderate correlation, substantial or marked relationship
correlation interpretation:
range = ± 0.41 - ± 0.70
verbal interpretation:
High to very high correlation/relationship
correlation interpretation:
range = ± 0.71 - ± 0.99
Perfect Correlation
correlation interpretation:
range = ± 1
ANOVA or F-TEST
ANALYSIS OF VARIANCE
Another parametric test used to compare the mean of three or more groups of independent samples.
What is F-Test?
Sir Ronald Aylmer Fisher
analysis of variance (ANOVA) / f-test was developed by __________________
He was a British statistician, geneticist, and academic.
One-way analysis of variance, Two-way analysis of variance and Three-way analysis of variance
3 Kinds of ANOVA
When there is a normal distribution and when the level of measurements is expressed in interval and ratio data just like t-test and the z-test.
When do we use F-Test?
When do we use F-Test?
We want to find out if there is a significant difference between and among the means of the three or more independent groups.
used to determine if there are significant differences between the means of three or more independent (unrelated) groups
what is one-way anova?
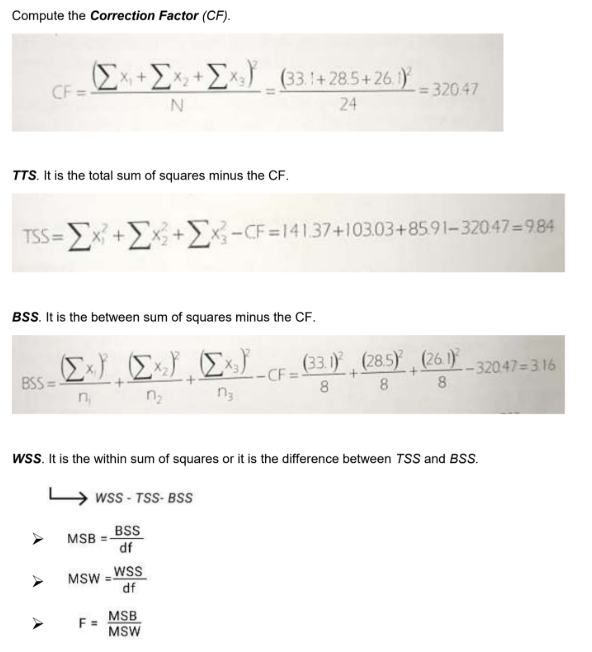
formula for anova
anova summary table
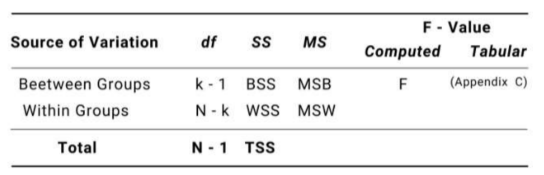
between groups
df of anova is k - 1
within groups
df of anova is N - k
hypothesis testing
It first determines the probability that the pattern could have been produced by chance alone.
the pattern can reasonably be explained by chance
what happens if probability is large enough?
we can rule out chance as a plausible explanation to conclude that some meaningful, systematic force created the pattern
what happens if the probability is extremely small?
hypothesis testing
It deals with the problem of testing specific assertions about the population.
hypothesis testing
is a statistical procedure that allows researchers to use sample data to draw inferences about the population of interest.
tentative solution
it needs further testing and series of experimentation before it can be accepted as a solution to the problems a researcher is trying to arrive
Null Hypothesis (Ho)
Alternative Hypothesis (Ha)
what are the kinds of hypothesis
Null Hypothesis (Ho)
no difference relationship hypothesis.
Null Hypothesis (Ho)
implies neutrality and objectively which must be present in any research undertaking.
Null Hypothesis (Ho)
a statement that the value of a population parameter is equal to some claimed value.
Alternative Hypothesis (Ha)
stated opposite the very way how the null hypothesis
is stated
Alternative Hypothesis (Ha)
an alternative solution just in case one failed to find that the null hypothesis is the true to the problem a researcher is working.
TYPE I ERROR OR ALPHA ERROR
When the null hypothesis is rejected and the alternative
hypothesis is accepted.
TYPE II ERROR OR BETA ERROR
When the null hypothesis accepted and the alternative
hypothesis is rejected.
Level of Significance
The probability of rejecting the null hypothesis when it is true, (also known as a type 1 error).
Level of Significance
This is decided by the individual but is normally set at 5% (0.05) which means that there is a 1 in 20 chance of rejecting the null hypothesis when it is true.
there’s a 1 in 20 chance of rejecting the null hypothesis when it’s true
what does a level of significance at 5% or 0.05 mean?
state the hypothesis about a population
use hypothesis to predict characteristics of sample
obtain a random sample
compare obtained sample data with prediction that’s made from the hypothesis
what is the hypothesis-testing procedure?
then we conclude that the hypothesis is reasonable.
if the sample mean is consistent with the prediction
we decide that the hypothesis is wrong.
if there is a big discrepancy between the data and the prediction
Independent t-test
Compare two independent groups for parametric test
Mann–Whitney U Test
Compare two independent groups for nonparametric equivalent
Paired t-test
Compare two related groups for parametric test
Wilcoxon Signed-Rank Test
Compare two related groups for non-parametric equivalent
One-way ANOVA
Compare 3+ independent groups (1 factor) for parametric test
Kruskal–Wallis Test
Compare 3+ independent groups (1 factor) for non-parametric test
Repeated Measures ANOVA
Compare 3+ related groups for parametric test
Friedman Test
Compare 3+ related groups for non-parametric equivalent
Two-Way ANOVA
Compare 3+ groups with 2 factors for parametric test
No exact direct equivalent; sometimes use Scheirer–Ray–Hare test
Compare 3+ groups with 2 factors for non-parametric equivalent
Pearson r
Measure relationship (correlation) for parametric test
Spearman rho
Measure relationship (correlation) for non-parametric test
Linear Regression
Prediction / effect of variables for parametric test
Rank-based / nonparametric regression
Prediction / effect of variables of nonparametric equivalent
— (Not parametric)
Test association between categorical variables for parametric test
Chi-Square Test of Independence
Test association between categorical variables for non-parametric test
parametric test
a kind of hypothesis test which gives generalizations for generating records regarding the mean of the primary/original population.
non-parametric test
does not require any population distribution, which is meant by distinct parameters.
Compare exam scores of male vs female students
(EXAMPLE)
Compare two independent groups - Independent t-test - Mann–Whitney U Test
Scores before and after a tutorial
(EXAMPLE)
Compare two related groups - Paired t-test - Wilcoxon Signed-Rank
Test
Scores of Sections A, B, C
(EXAMPLE)
Compare 3+ independent groups (1 factor) - One-way ANOVA - Kruskal–Wallis Test
Same students’ scores across 3 exams
(EXAMPLE)
Compare 3+ related groups - Repeated Measures ANOVA - Friedman Test
Effect of teaching method (online vs face-to-face) and gender on
scores
(EXAMPLE)
Compare 3+ groups with 2 factors - Two-Way ANOVA - (No exact direct
equivalent; sometimes use Scheirer–Ray–Hare test)
Study time vs exam scores
(EXAMPLE)
Measure relationship (correlation) - Pearson r - Spearman rho
Predict score based on study hours
(EXAMPLE)
Prediction / effect of variables - Linear Regression - Rank-based /nonparametric regression
Relationship between gender and strand chosen
(EXAMPLE)
Test association between categorical variables - — (Not
parametric) - Chi-Square Test of
Independence
It is used to compare perceived population mean against the sample mean.
what is z-test one sample group?
the samples are equal or more than 30
you use z-test when