correlational analysis
1/8
There's no tags or description
Looks like no tags are added yet.
Name | Mastery | Learn | Test | Matching | Spaced | Call with Kai |
|---|
No study sessions yet.
9 Terms
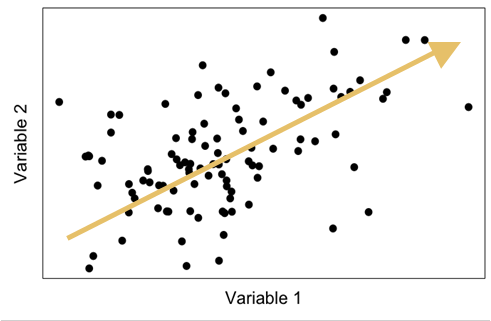
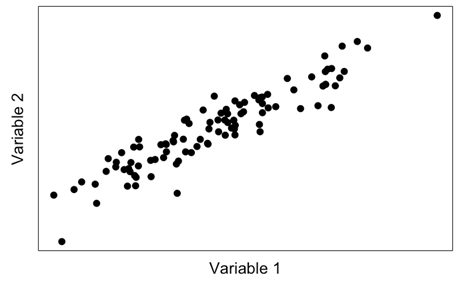
positive association
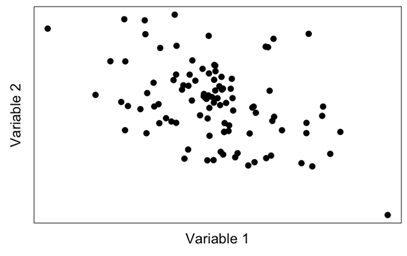
negative association
strong association
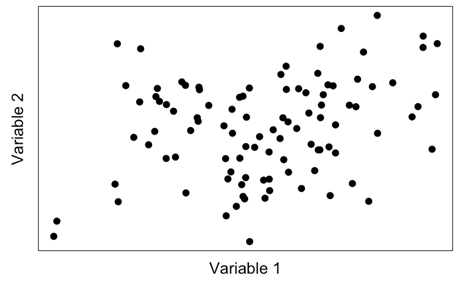
weak association
correlation coefficients
descriptive statistics that describe an association between variables
Pearson’s product-moment correlation
Describes linear associations between variables
Used for interval/ratio level data that is normally distributed
-1 is a perfect negative linear association
0 no linear association
+1 perfect positive linear association
Spearman’s rank correlation
Describes linear associations between variables
Used for ordinal level data or interval/ratio data that is skewed
Uses ranks instead of raw data values
1 = perfect negative correlation
0 = no correlation
+1 = perfect positive correlation)
reporting a correlation test
R= Spearman’s and Pearson’s are always denoted as r
Rs= tells us this is a Spearman’s correlation
(33) = degrees of freedom (n-2)
.62 correlation coefficients to a maximum of 3 d.p
How to report a Spearman’s/Pearson’s correlation coefficient
Spearman’s/ Pearson’s correlation was computed to assess the relationship between [variable 1] and [variable 2]. There was a [negative or positive] correlation between the two variables r(degrees of freedom) = the r statistic, p = p value.