Module 2: 2.1: Displaying and Summarizing Categorial Data
1/9
There's no tags or description
Looks like no tags are added yet.
Name | Mastery | Learn | Test | Matching | Spaced |
|---|
No study sessions yet.
10 Terms
Categorical Data provides:
1) The values being observed
2) How often each value occurred

Relative frequency
percentage of the frequency that the category appears in the data set
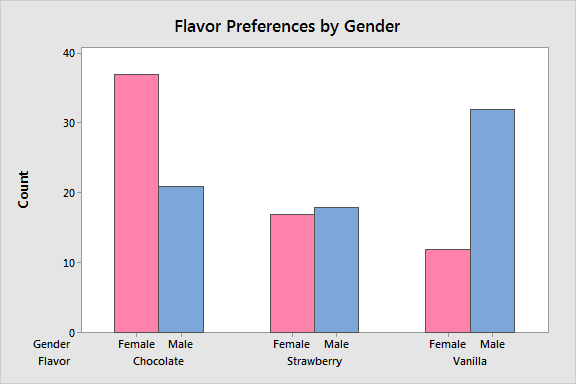
Bar Chart:
shows the frequencies or percent in the different categories
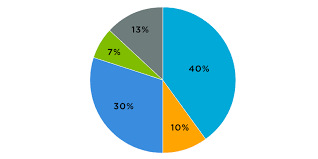
Pie Chart:
displays relationship between parts and whole
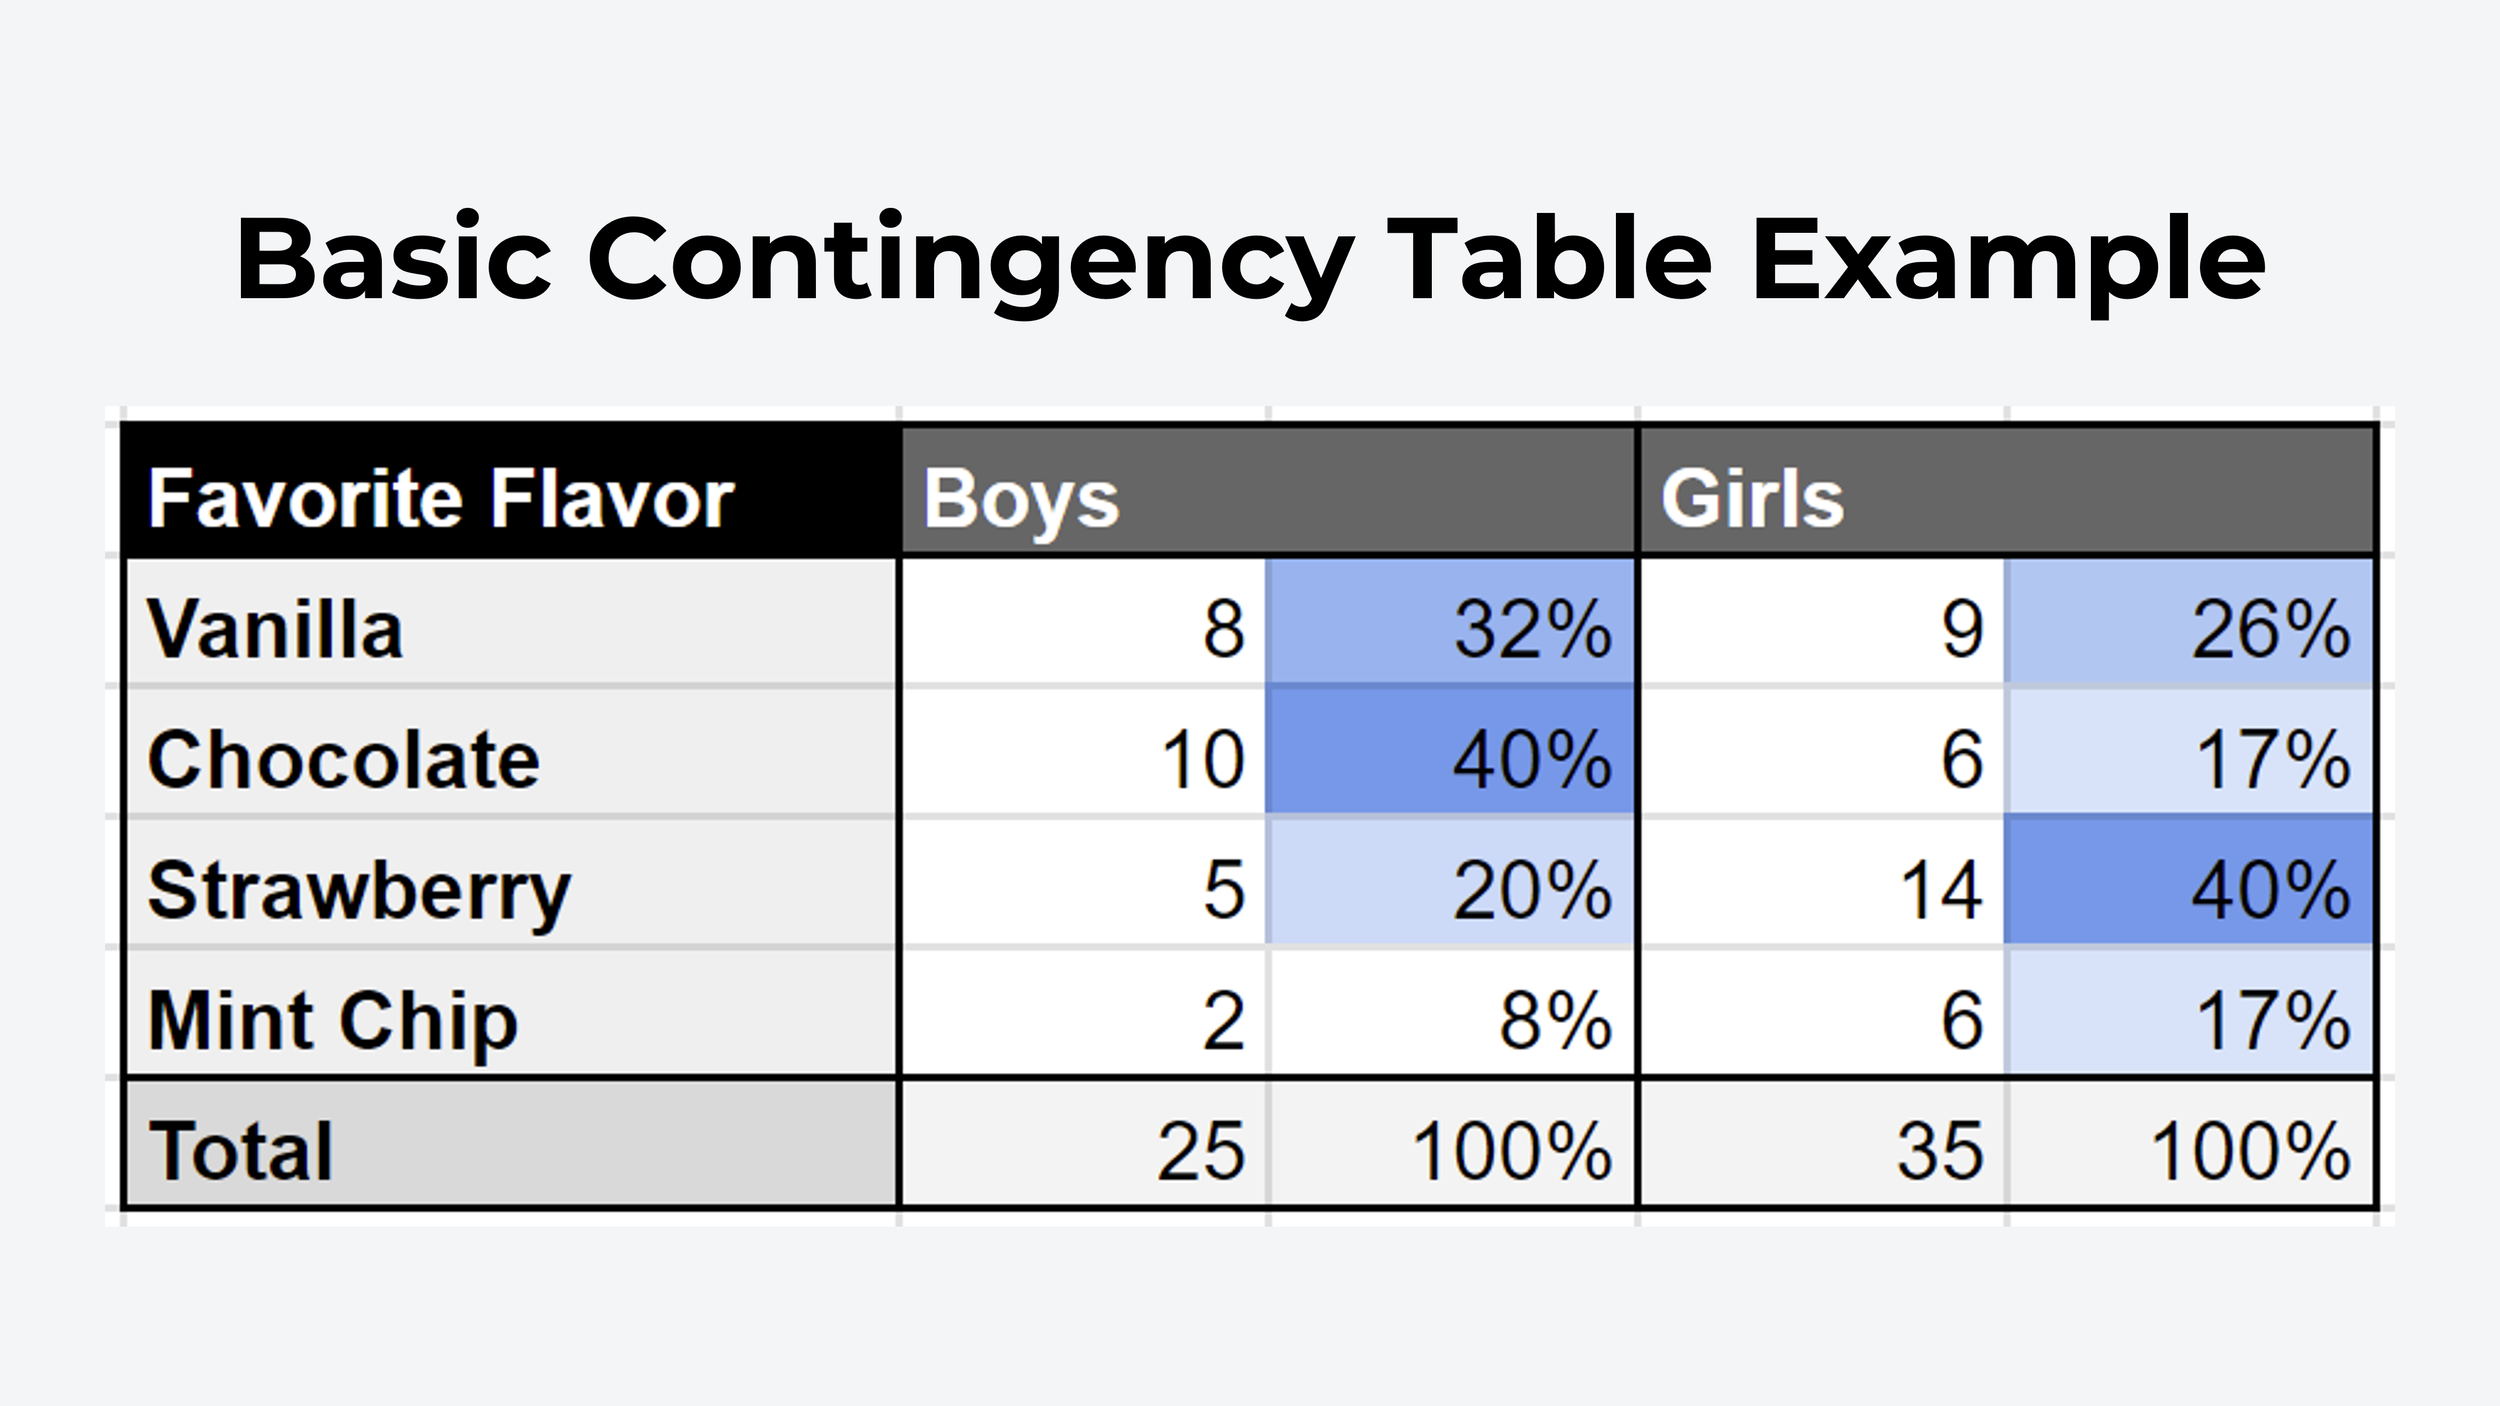
Contingency table
shows relationship between 2 categorical variables
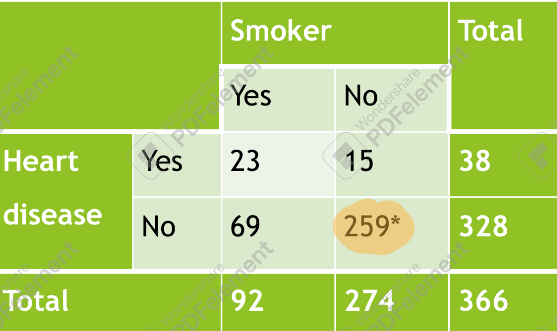
Contingency table cells:
gives count for a combination of the two variables
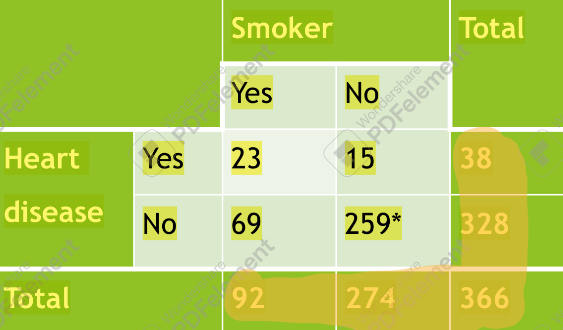
Contingency table margins:
give totals and frequency distributions for each of the variables; marginal distribution
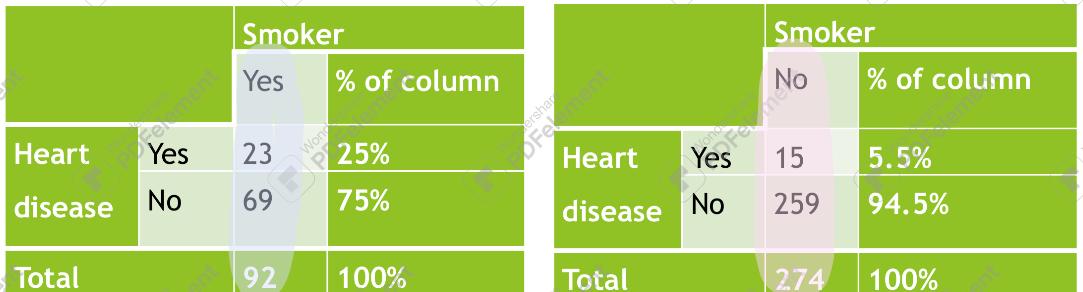
Contingency table: conditional distribution
shows distribution of one variable for just the individuals who satisfy some condition on another variable
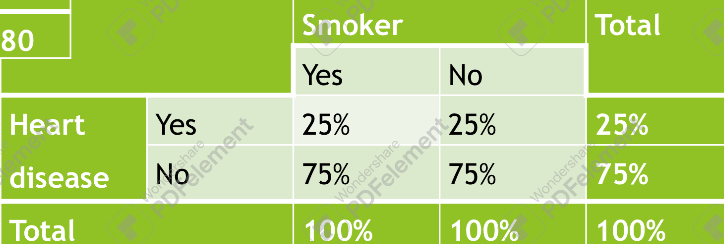
Independent variables
conditional distribution of one variable is the same for each category: no association between
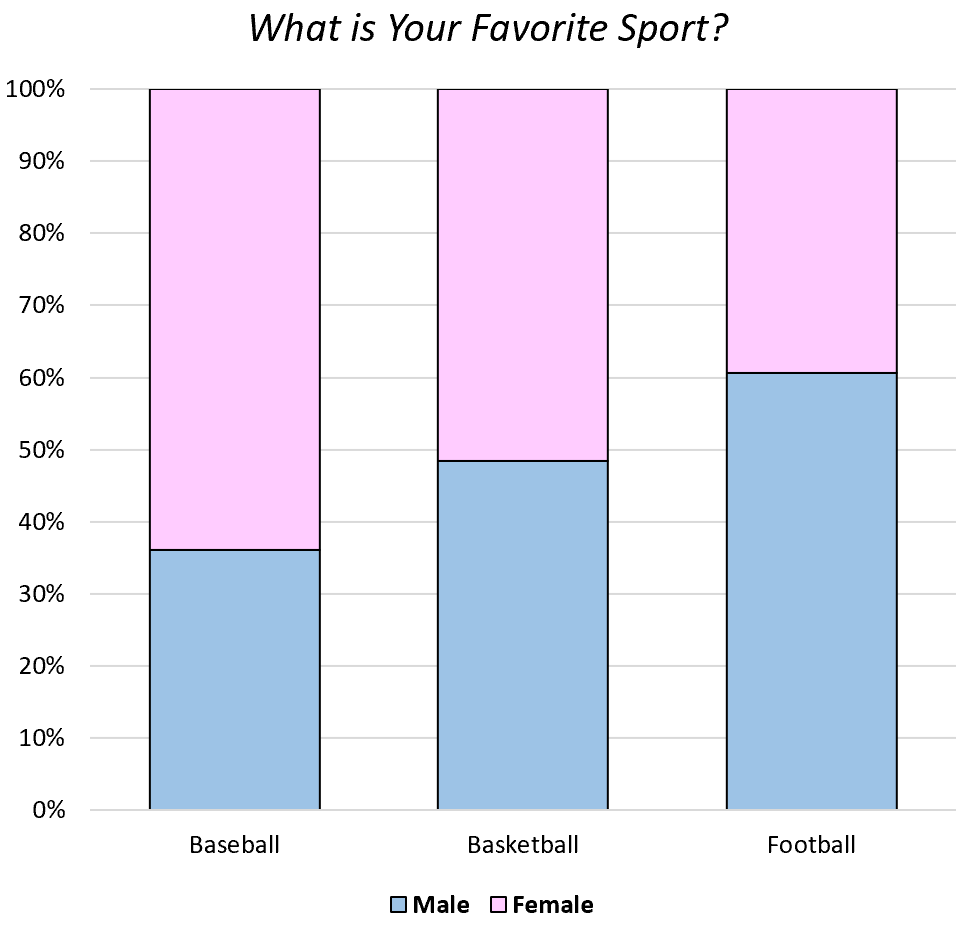
Segmented Bar Chart
same info as pie chart but in the form of bars