Neur research final
1/314
There's no tags or description
Looks like no tags are added yet.
Name | Mastery | Learn | Test | Matching | Spaced |
|---|
No study sessions yet.
315 Terms
what is the primary goal of the experimental research strategy
to establish a cause and effect relationship between variables. Changing the independent variable (IV) causes a change in the dependent variable (DV)
how is validity in experimental research strategies
high internal validity : they are conducted in a controlled and constant lab
limited external validity: conducted in unfamiliar environment-cant be generalized
how is validity in not experimental research strategies
high external validity: realistic environments
limited internal validity: environemnt is not manipulated or controlled
What are factorial designs?
Factorial experiments are experiments where multiple independent variables are manipulated
How does factorial designs correlate to the real world
In the real world, effects have multiple causes thus behavior is rarely attributed to only one variable
Why is it better to examine combinations of different potential causes in an experimental setting of Factorial designs
Examining multiple factors increases external validity and better approximates the real world
What is used for each independent variable (factor) in a factorial designs
A numeral’ the value of the numeral indicates th E number of level of the independent variable
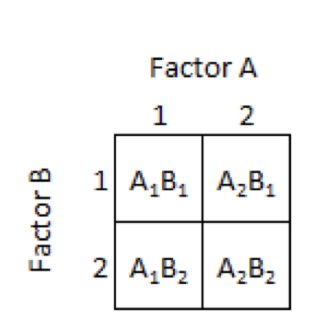
What are 2×2 factorial designs
Usually 2 independent variables, 2 levels for each independent variable and 4 conditions
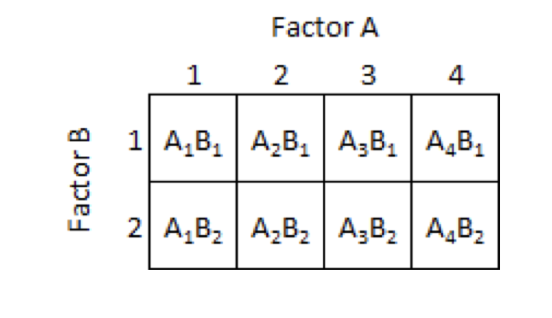
What is a 4×2 factorial designs
2 independent variables, 4 levels fr one independent variable and 2 levels for the other independent variable; 8 conditions
What’s are 5×3 factorial designs
Two independent variable, five levels for the first IV, 3 levels for the second and 15 total condtions.
What is a 2×3×2 factorial designs
3 independent variables: 2 levels for the first one, 3 for the second one and 2 for the third one; 12 total conditions
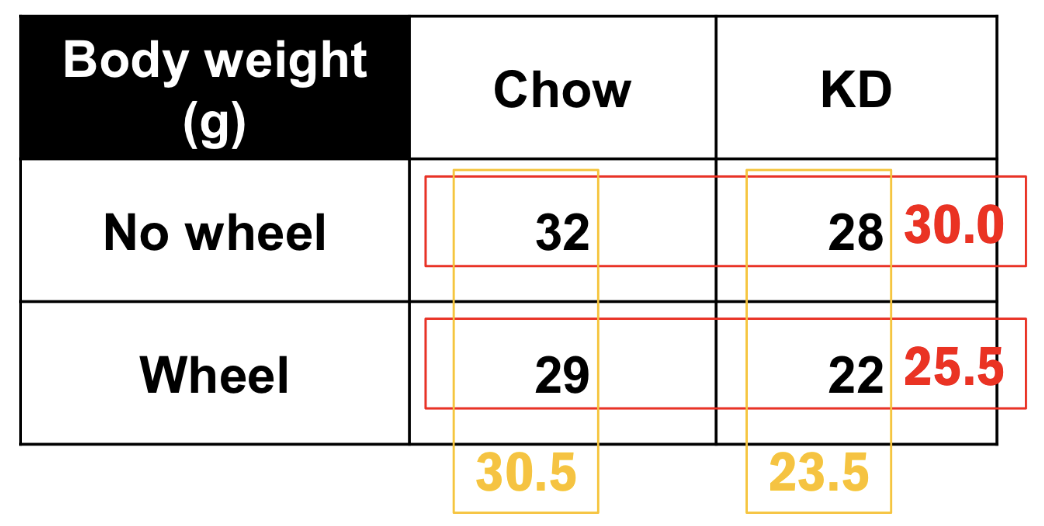
In a factorial matrix, how can you know if the main effect is on the row factor or the column factor
Calculate the average of each row and column;
If the row average are different, the main effect is on the row factor
If the column averages are different, the main effect is on the column factor
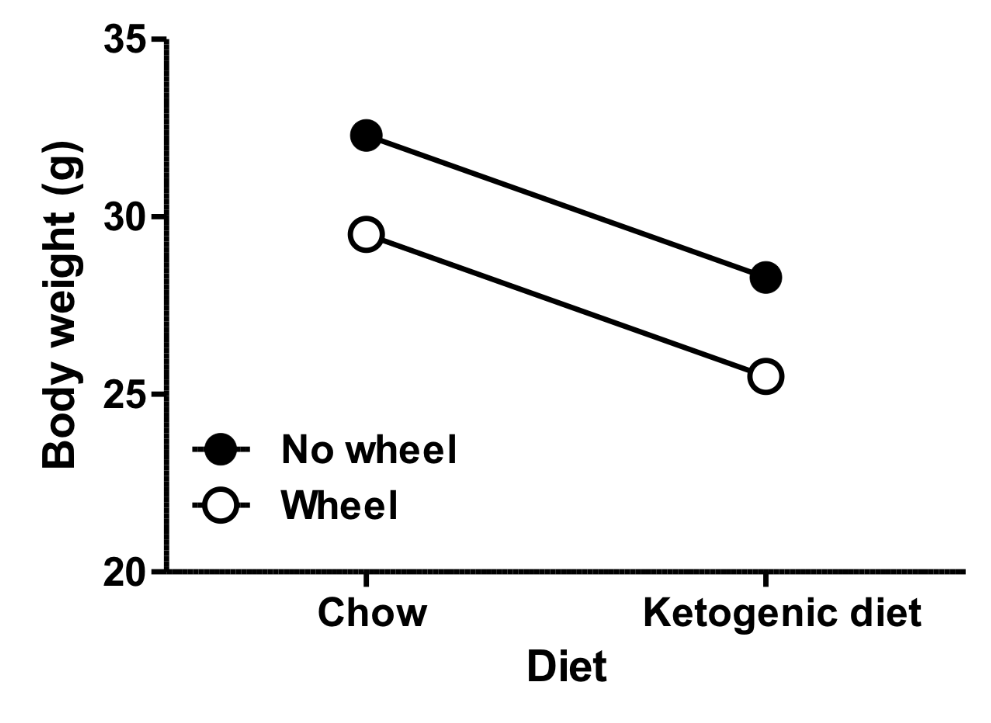
In a factorial matrix, how can you know if there is an interaction, from the graph
If the lines are parallel on the graph there is no interaction but if they aren’t then there is.
How do interactions affect the main effect in a factorial matrix
if there is an interaction, the effect of A cannot be described without taking into account the effect of B
What does an interaction mean in a factorial design
It determines how a combination of factors work together to affect behaviour. Occurs when one factor has a direct influence on the second factor/ Factor A can exaggerate/minimize the effects of Factor B
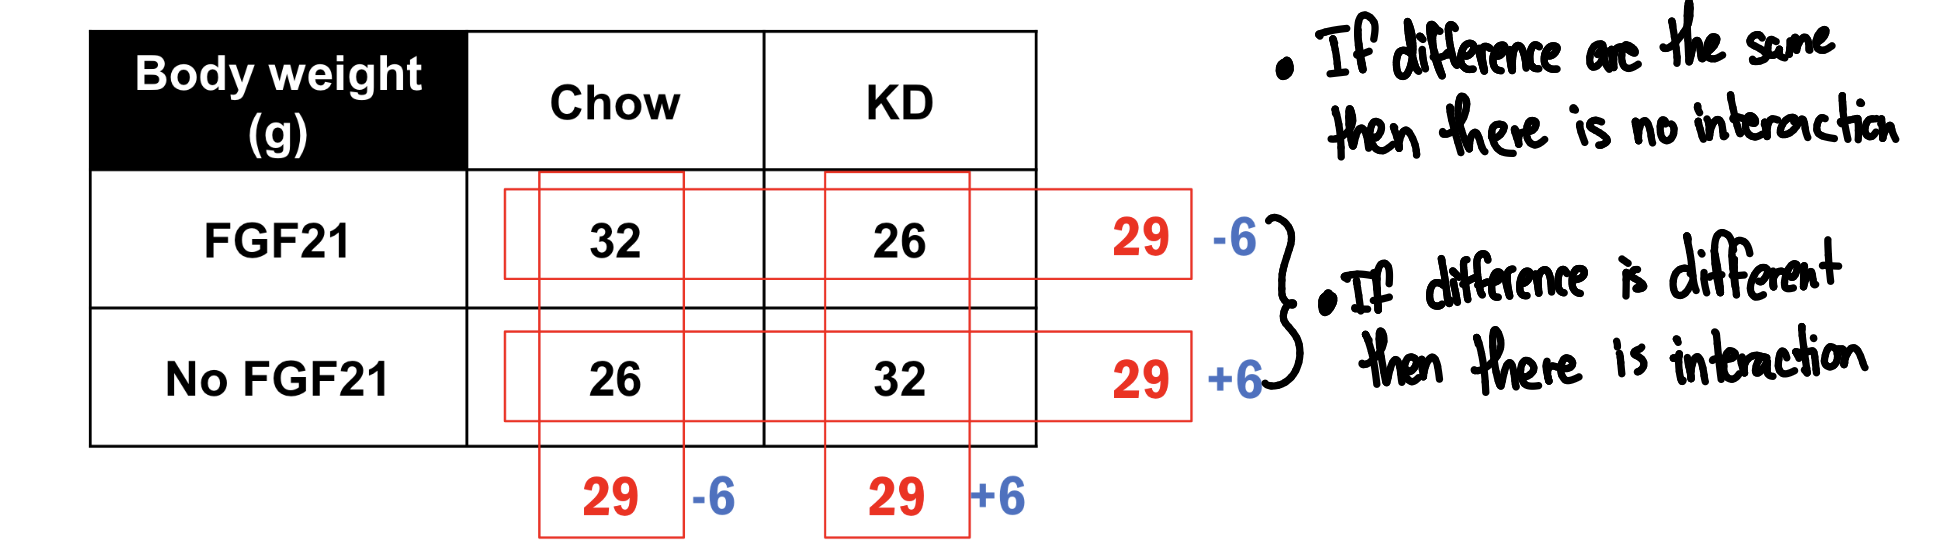
How can you find an interaction in a factorial design just from the matrix
Compare the mean difference in any individual row with the mean differences in other rows. If no interaction, then the size and direction of the differences in each row is the same as the other rows. If there is an interaction then the differences change from one row to another
What is the maximum number of main effects in a factorial design
2×2 - 2 main effects
2×3 - 2 min effects
2×45×8×10 - 4 main effects
Rule of theme: max main effects = number of factors (IV)
How many interactions can happen in each factorial design
Number of interactions = 2^F - 1 - F (F=factors)
Ex. 2×2 design = 2² -1 -2 =1 interaction
What are the types of factorial designs
Between-subjects: independent groups; factorial experiments between different groups of people
Within-subjects: repeated measures; factorial experiments using different manipulations in the same individual
Mixed design: combination of between and within subjects; one factor is between subjects and another is within subjects
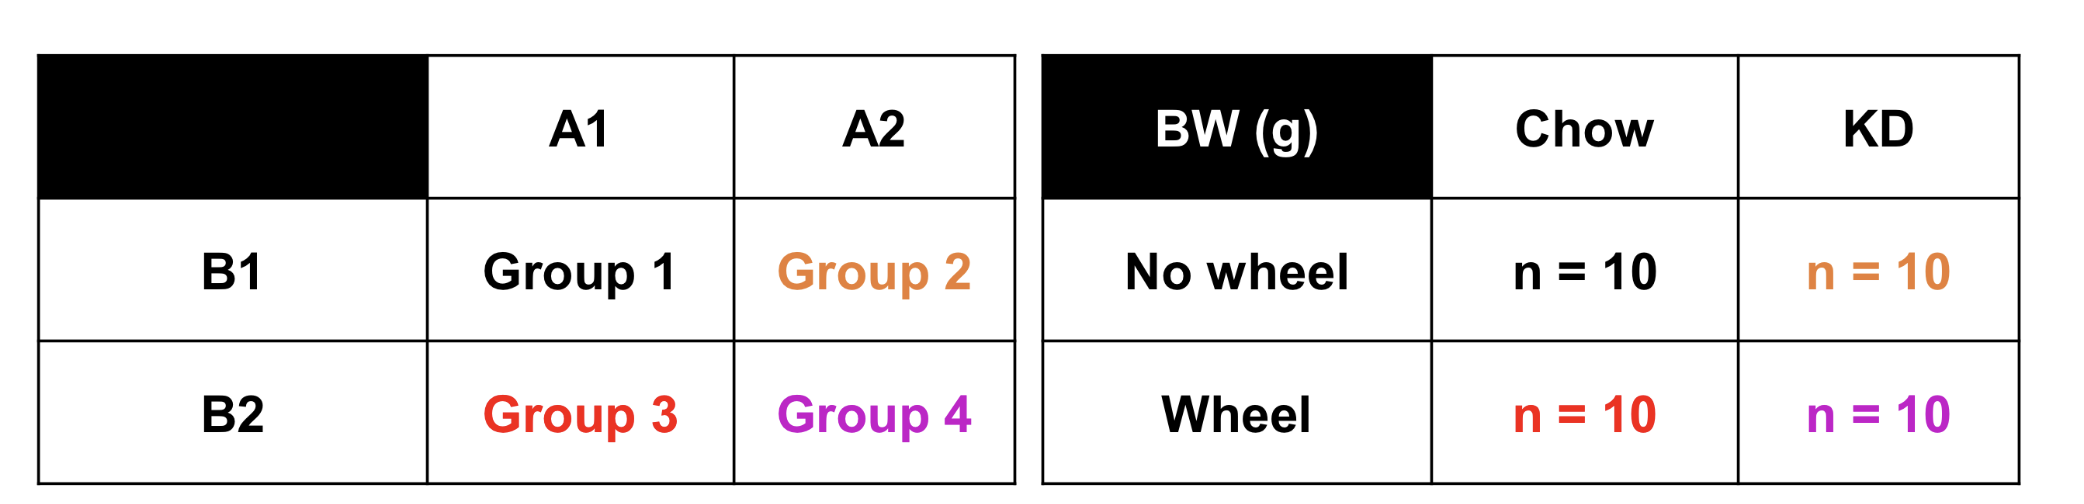
What is pure factactorial, between-group design and its pros and cons
participants are randomly assigned to each cell of the design. - one group for every conditons (4)
cons: individual differences can become confounding variables and increqase the varience of scores
pros: avoid order and sequence effects and can be done in one day
how many subjects are in a pure factorial between-groups factorial design
4 separate groups of n
ex. 4 separate groups of n = 10 each → 40 subjects
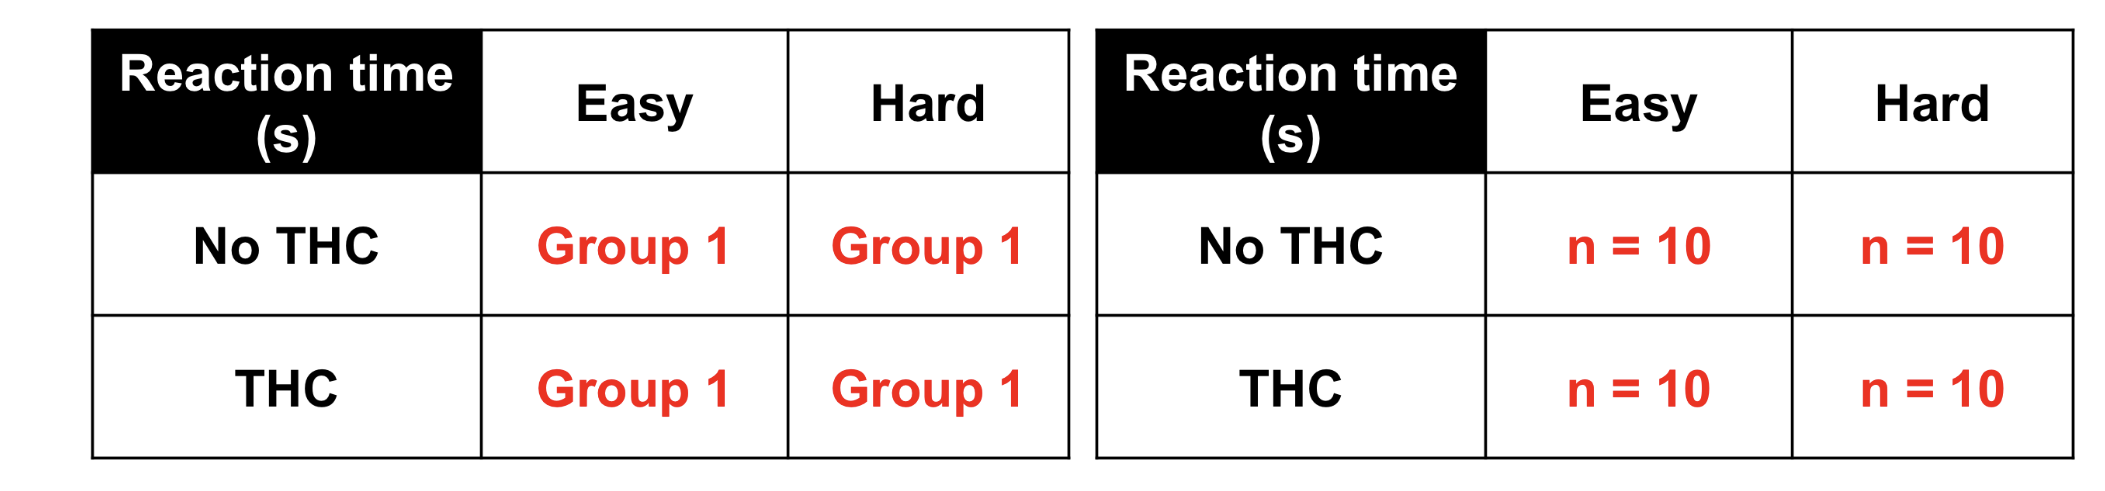
what is pure factorial within-group design and its pros & cons
same individuals participate in ALL conditions.
cons: number of different treatment conditions can be high and time consuming for subjects;. carry-over effect; has to be done in multiple days
pros: fewer individuals needed; reduces problems related to individual differences; can compare between all conditions because all participants are in all conditions.
Which pure factorial design should be chosen if you know individual differences will be large
within group design
how many subjects will be in a pure factorial within-group design
1 group of n
ex. 1 group of n = 10 → 10 subjects total
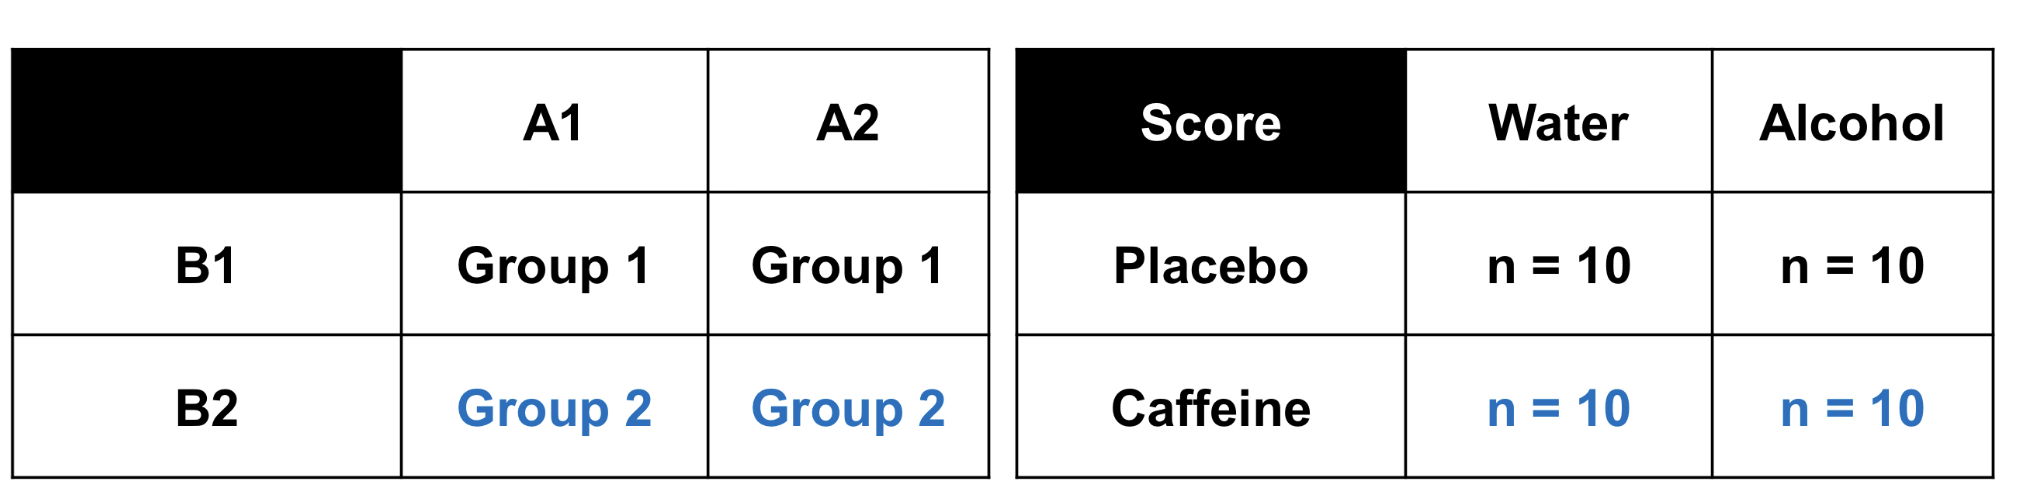
What is the mixed factorial desgn
combines both between and within subject design; effect of manipulations on two groups of individuals

which factorial design is used in before-after situations between 2 groups
mixed factorial design
how many subjects are in a mixed factorial design
2 groups of n
ex 2 groups of n = 10 → 20 subjects total
what are the pros and cons of a mixed factorial design
pros: control for unwanted individual differences, while investigating specific individual differences
cons: limits ability to make casual statements about the relationship between variables; limits internal validity
what are advantages of factorial designs
increases external validity - variation of a single independent variable is unusual in real life situations
theories with 2+ independent variables can only be tested via factorial designs
greater experimental control: testing multiple variables in one experiment reduces random variations that arise when comparing in different experiments
what are disadvantages of factorial designs
Too many variables can result in:
huge experiments and requirement for multiple conditions; a lot of participants
interactions that are not easily interpreted; might test conditions that don’t naturally exist
make the experiment too long/unfeasible
why do we need statistics?
to know why a result is significant; to see relationships and do comparisons. Allow for:
accurate conclusions to be drawn (if results happened by chance vs statistically significant)
specific quantification of observations
for observations to be summarised
what are the two types of statistics
descriptive: to describe, organise and summarise data
inferential statistics: to make interpretations from data; whether one result was more significant than another to make conclusions.
what are examples of descriptive statistics
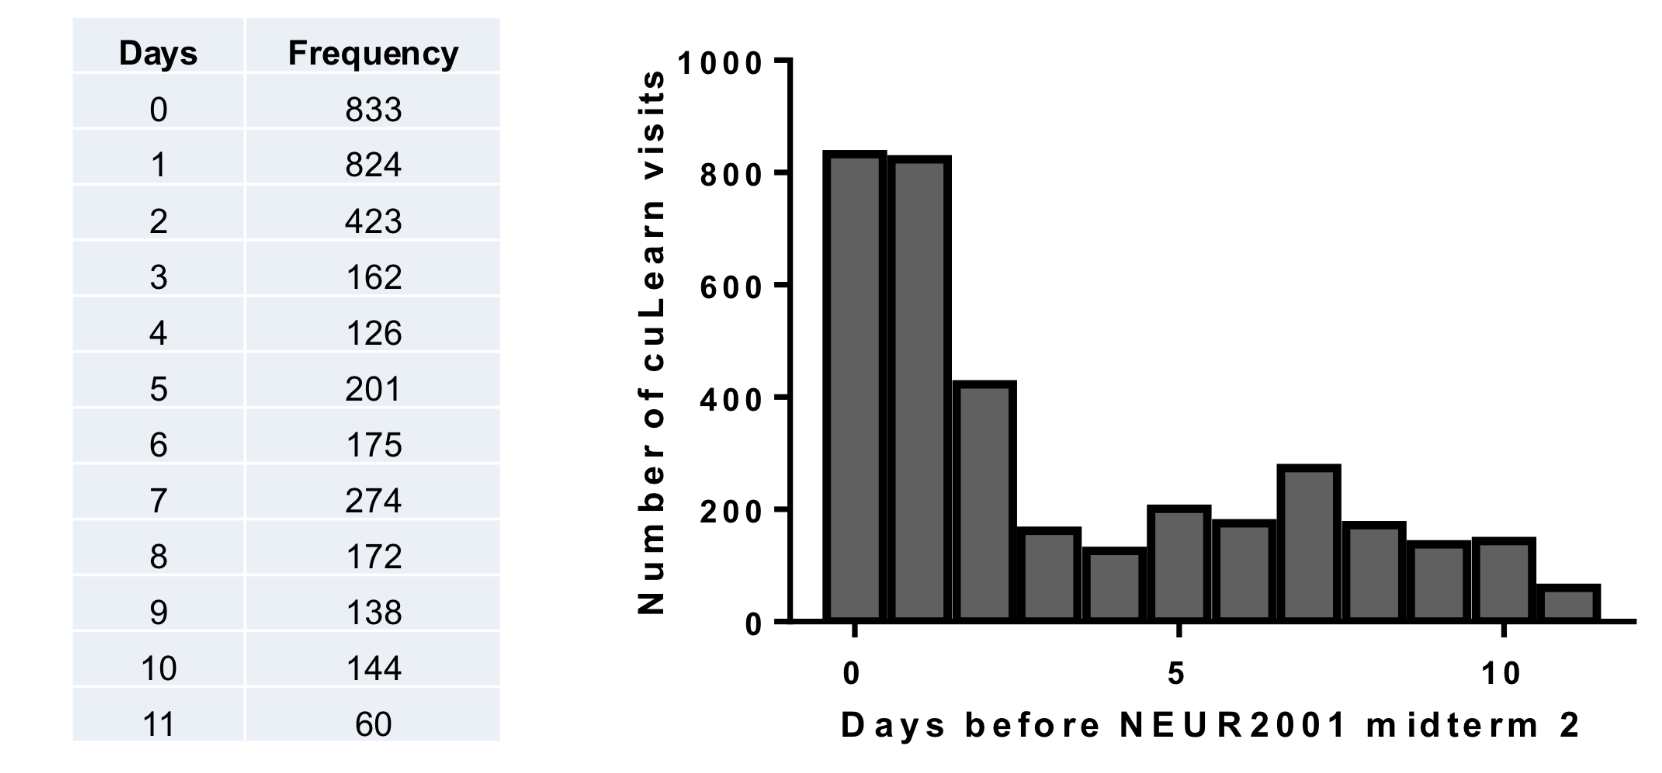
organize data: frequency distribution - way to organize/visualize data, doesnt tell mean or median, just the mode
summarize data:
measures of central tendency (mean, median, mode)
measures of disperdions (standard diviation, variance, range)
measures of relationship (pearson, spearman)
what is the first step after collecting data
making a frequency distribution
What is frequency distribution
organizes a set of scored by grouping them into a display (graph)
eligible for all sets of measurments
preliminary method of statistical analysis
define mean, median and mode
mean: average of scores (balance point of data)
median: score in the middle (for odd number of scores, take the average of the two middle scores) - applicable if outliers are present
mode: most frequent/standard value -not commonly used
what are advantages and disadavnteages of the mean
Advantages: easily understood and useful for inferential stats
disadvantages: does not produce a representative value when there are outliers
Which measure of central tendency represents the amount each individual would receive if the total were divided equally among them?
mean (add all scores and divided them by the number of individuals)
what is the statistically capability of a nominal scale (categorical info)
only has frequency distributions and mode
what is the statistically capability of a ordinal scale ( rank)
has only frequency distributions, mode, median and range
what is the statistically capability of an interval scale ( rank with distances)
has frequency distributions, mode, median, range, standard diviation and can add/substract values
what is the statistically capability of a ratio scale
has ALL: frequency distributions, mode, median, range, standard diviation, can add/substract values, multiple/divide values and has a true zero
What are the different measure od dispersions
range: distance from smallest to biggest score ( range = max-min)
standard deviation: typical distance away from the mean ( how far each score is from the mean) - S = √variance [distance from mean]
standard error: spread of sample means (SE = s/√n)
what is Simple quota sampling
little is known about the characteristics of a targer population but an equal number of participants are selected.
what are some characteristics of a range
only based of 2 scores but not very informativeas it ignores most of the data
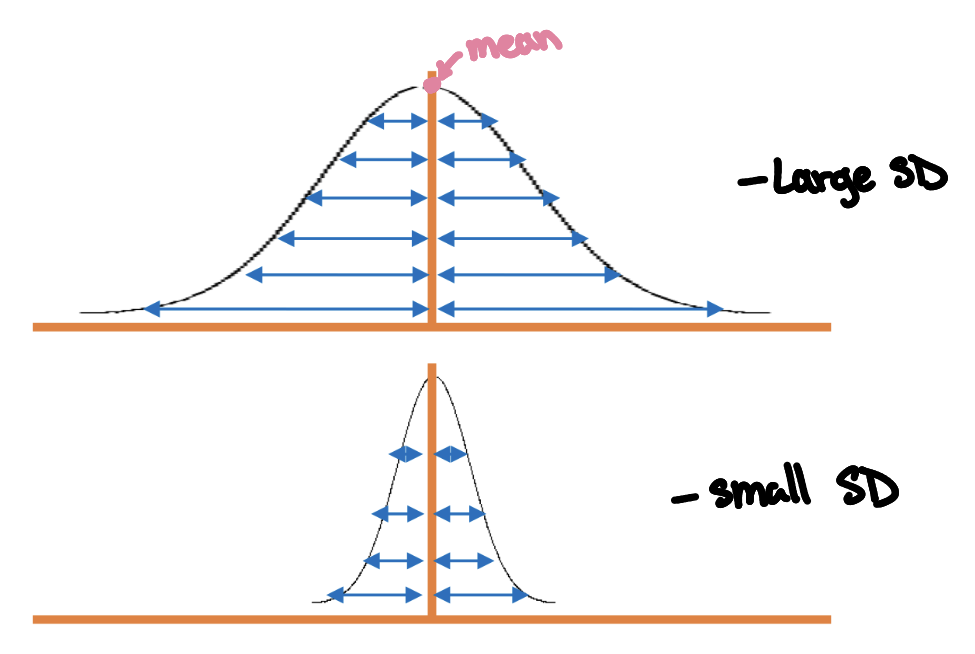
what is the relationship between the mean and the standard deviation
SD uses the mean as a reference point then measure the distance between each score and the mean.
if scores are wide apart from the mean, SD is large
if if scores are close to the mean, SD is small
What can the standard error of the mean provide
a measure of how much difference is reasonabke to expect between a sample and its population
which measure of varience measure how accuratly your smaple reflects the population. “ how certain am I that the sample ean accuratly estimates the population mean”
standard error of variance
how are measures of variance used in practice
standard deviation is used when trying to assess sample of identify outlier
standard error to report final mean
what are outliers
fall out of normal distribution and can be removed from data set. values 2 standard deviations away from mean are considered outliers
what are inferential statistics
allow researchers to infer and generalize observations to the larger population “how likely it is that the differences between groups is due to random chance”
what is the max p-value allowed in science
5% to be statistically significant
what is a p-value
the threshold of statistical significance; the arbitrary line between sufficient and not sufficient. ranges fro 0 (results mostly likely not due to chance) and 1 (results most likely due to chance)
what does a low p-value allow
allows to makes inferences (generaliztion) from sample to population bc it is not due to chance
what is the null hypothesis
Start by assuming you’re wrong, then conduct a study to reject null hypothesis.
states that there is no effect; any pattern in the sample os just due to chance (p-value = 1); goal is to show that a treatment has real effect and not due to chance → want a low p-value
what boundary of p-value can reject or fail to reject null hypothesis
if p<0.05, reject null hypothesis
if p>0.05, fail to reject null hypothesis
what are some ways to commnicate research
paper
posters
presentations
textbooks
podcasts
theses
what is the most common form of presentation and honours thesis
paper poster up to 4 feet (height) X 6 feet. (width), allows for collaboration
what are the different types of presentation
symposium: collection of x minutes talks on the same topic by several people (mini lectures)
datablitz or lightning talks: 1-3 minutes
what are some pros and cons of datablitz or lightning talks
pros:
get people interested in your research
get to the bottom line fast
number of graphs shown are minimised
cons:
How do you fit all the info in 1-3 minutes?
what are things to consider when writing a manuscript
type of scientific article
choose and appropriate journal with peer reviews
work must be consistent with the aims and scopes of journal
what are aims and scopes of a journal
tells us what type of articles does the journal accept (review articles, data,etc)
What is the difference between a primary and a secondary source
primary: study conducted by you and publish your own raw data with all details needed to replicate study
secondary:summarizes info from primary sources and the author’s opinion (invalid) on what primary source is doing.
distinguish between PMID and DOI
PMID: how to find the article in PubMED
DOI: link to the article in any database on the internet
from the abstract of a paper how can you know if it is primary or secondary
primary has its abstract broken down in sections (background, methods, results, conclusion,…)
What is the correlation between high impact factor and citation number
high impact factor papers will have lots of citations. but low impact factor does not indicate unimportant work (more niche journals naturally get less citations)
what counts as a citation
For the web of Science: any citations that are then published in the web of Science are counted, anything else isn’t - biased but vetted for accuracy
for Google Scholar: anywhere the article has been cited in the entire internet - true reflection of impact factor
what is the process to submit an article
write an artice
either release a preprint (if impatient) or submit to journal
after submiting to journal it either gets declined or the journal is interested
if the article is declined, submit to a different journal and restart the loop
if journal is interested, itll undergo peer review
after peer review, the jounal gets accepted of resent to be revised based on reviewer comments
after the article has been revised based on reviewer comments, it get submited to journal again to either be declined or accepted (another peer review loop)
what is a preprint and its pros and cons
research paper that is shared before peer review
Pros: feedback from community, visibility and credit
Cons: not peer reviewed and can be scooped ( someone takes your findings for theur own research and get it published before you)
what is the equation for impact factor
(#citations over past 2 years)/(#articles in the journal in the past 2 years)
How much more than the attrition rate must you recruit
50% more than the attrition rate
what are the most important elements of power analyisis
effect size ( difference between mean or proportions of two groups
standard deviation (variability within a sample)
how can financial compensation for participation affect study
can introduce confounding variables
What P-value is considered significant
P=0.05
How does biased sample happen
can occur by change or as a result of selection bias
What are the four basic elements of an experimental research strategy?
Manipulation
Measurement
Comparison
Control.
What is the purpose of Manipulation in an experiment?
To manipulate the independent variable (IV), which helps determine which variable is the cause and which is the effect.
What is the purpose of Measurement in an experiment?
To measure the dependent variable (DV) and obtain scores for each treatment condition
What is the purpose of Comparison in an experiment?
To compare the scores obtained in one condition with the scores obtained in another condition
What is the purpose of Control in an experiment?
To control all other variables so they do not influence the two variables being examined - involves eliminating or controlling confounding variables
What is a Confounding Variable?
A variable that changes with the independent variable and can affect the dependent variable.
what happens to a obscuring variable when it influences the dependent variable (the result)
it becomes confounding
What is an Obscuring Variable?
A variable that makes changes in the dependent variable hard to observe
what do obscuring variables lead to
Lead to measurement error and noisy data, reducing internal validity.
How can researchers control obscuring variables?
By ensuring the manipulation is effective (adequate strength)
reducing measurement error (e.g., improving instrumentation or training)
and minimizing excessive variation in data (often due to individual differences)
What is the Directionality Problem?
A challenge that occurs when a research study establishes a relationship between two variables, but does not explain the direction of the relationship (which one causes the other)
What are the two critical components of an experiment?
The Independent vs. Dependent variable and the Experimental vs. Control group
In experimental terminology, what is a Factorial design?
A design that includes more than one Independent Variable (IV)
In experimental terminology, what is a Multivariate design?
A design that includes more than one Dependent Variable (DV)
List three methods used for control in experiments.
Holding variables constant (easy for things like light, temperature, noise); Matching; and Randomization
What is the downside of holding variables constant or matching for control?
it may limit generality (external validity)
What is a Control group?
The group NOT exposed to the manipulation
What is a No-Treatment control group?
A control group where subjects do not receive the treatment being evaluated
What is a Placebo control group?
A control group where participants receive a placebo (e.g., a sugar pill) instead of the actual treatment. This is typically used in clinical studies
Define the Placebo effect.
Responses to the fake medication, meaning people experience improvement even though they received a dummy sugar pill. This effect involves the power of expectation and care
Define the Nocebo effect.
Experiencing negative symptoms due to expected side effects - opposite of placebo effect
How does the experimental research strategy typically balance validity?
It allows careful control of the environment, leading to high internal validity, but often uses unfamiliar environments, which limits external validity
What is Internal Validity?
The confidence that the research produces an unambiguous explanation for the relationship between two variables, demonstrating that change in the DV MUST be due to change in the IV within the experiment.
What is External Validity?
The extent to which your experimental result holds true outside your specific study. This involves generalizing results to different samples, settings, or measurements
What is a major threat to internal validity?
Any factor that raises doubts or allows alternative explanations for the relationship between variables (ex. assignment bias, environmental variables, and time-related variables)