Principles of Economy: Chapter 4-6
 Call Kai
 Learn
Learn Practice Test
 Spaced Repetition
 Match
Match Flashcards
 Knowt Play
1/23

Name | Mastery | Learn | Test | Matching | Spaced | Call with Kai | Chat |
|---|
No analytics yet
Send a link to your students to track their progress
24 Terms
Competitive Market
A market with so many buyer and sellers that each has little effect on market price (PRICE TAKERS)
Monopoly
A market with only one seller who sets the price (Price Maker)
The Law of Demand
All else equal, when price falls, Quantity demanded rises
The Law of Supply
All else equal, when price rises, Quantity supplied rises
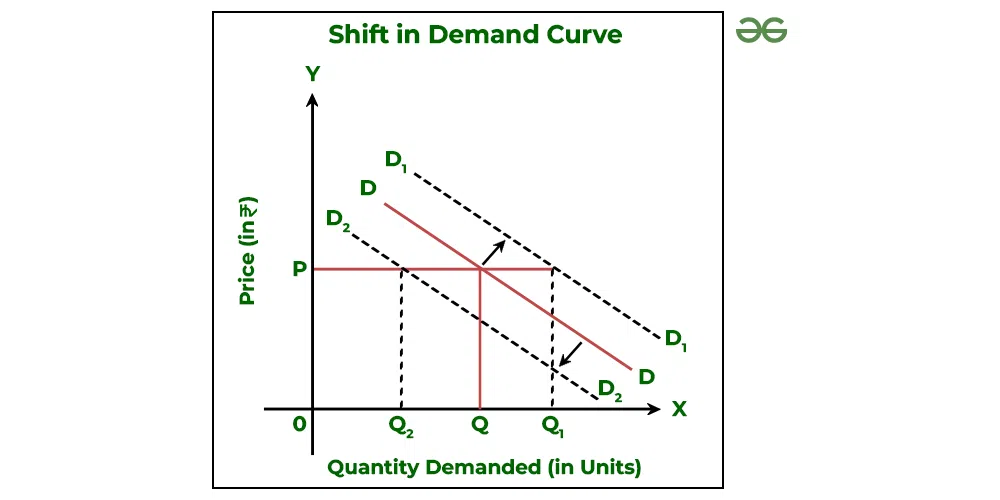
What are common causes of shifts in the the Demand Curve?
Income changes
Normal vs Inferior goods
Change in price of Substitutes/complements
Tastes/ preferences
Expectations change
Increased amount of buyers
Normal vs Inferior goods (defintion+ examples)
Normal goods: when income rises, demand rises
Demand increases (Not Quantity of Demand) so the whole demand curve shifts
Ex: Luxury sports car
Inferior goods: when income rises, demand falls
Ex: Public transport tickets
Substitutes vs Complements (definition + examples)
Substitutes: two similar, interchangeable goods ==> Price1 rises, Demand2 rises
Complements: two goods often bought together ==> Price1 rises, Demand2 falls
What are common causes of shifts in the Supply Curve?
Price/accessibility of inputs
Technology improves
Expectation change
Number of sellers in the market
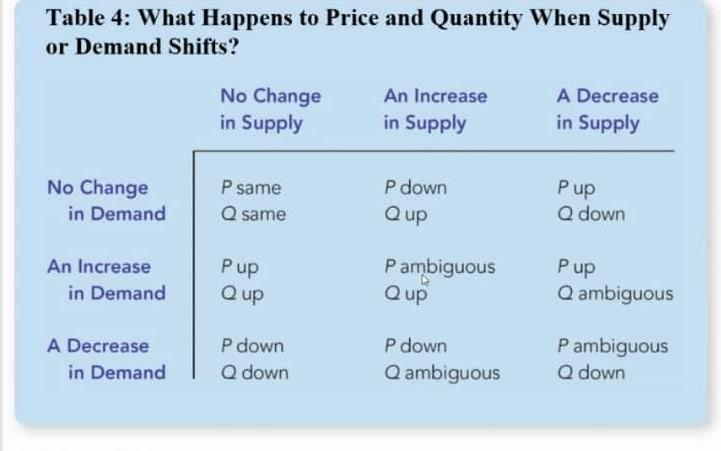
What happens to Price and Quantity when Supply or Demand shifts?
Increased Supply + no changed demand ==> P down, Q up
Decreased Supply + no changed demand ==> P up, Q down
Increased Demand + no changed supply ==> P up, Q up
Increased Demand + no changed supply ==> P down , Q down
Properties of Equilibrium (Graph, Quantity)
Supply and demand curves intersect
Qs and Qd are equal (No shortages or surplus)

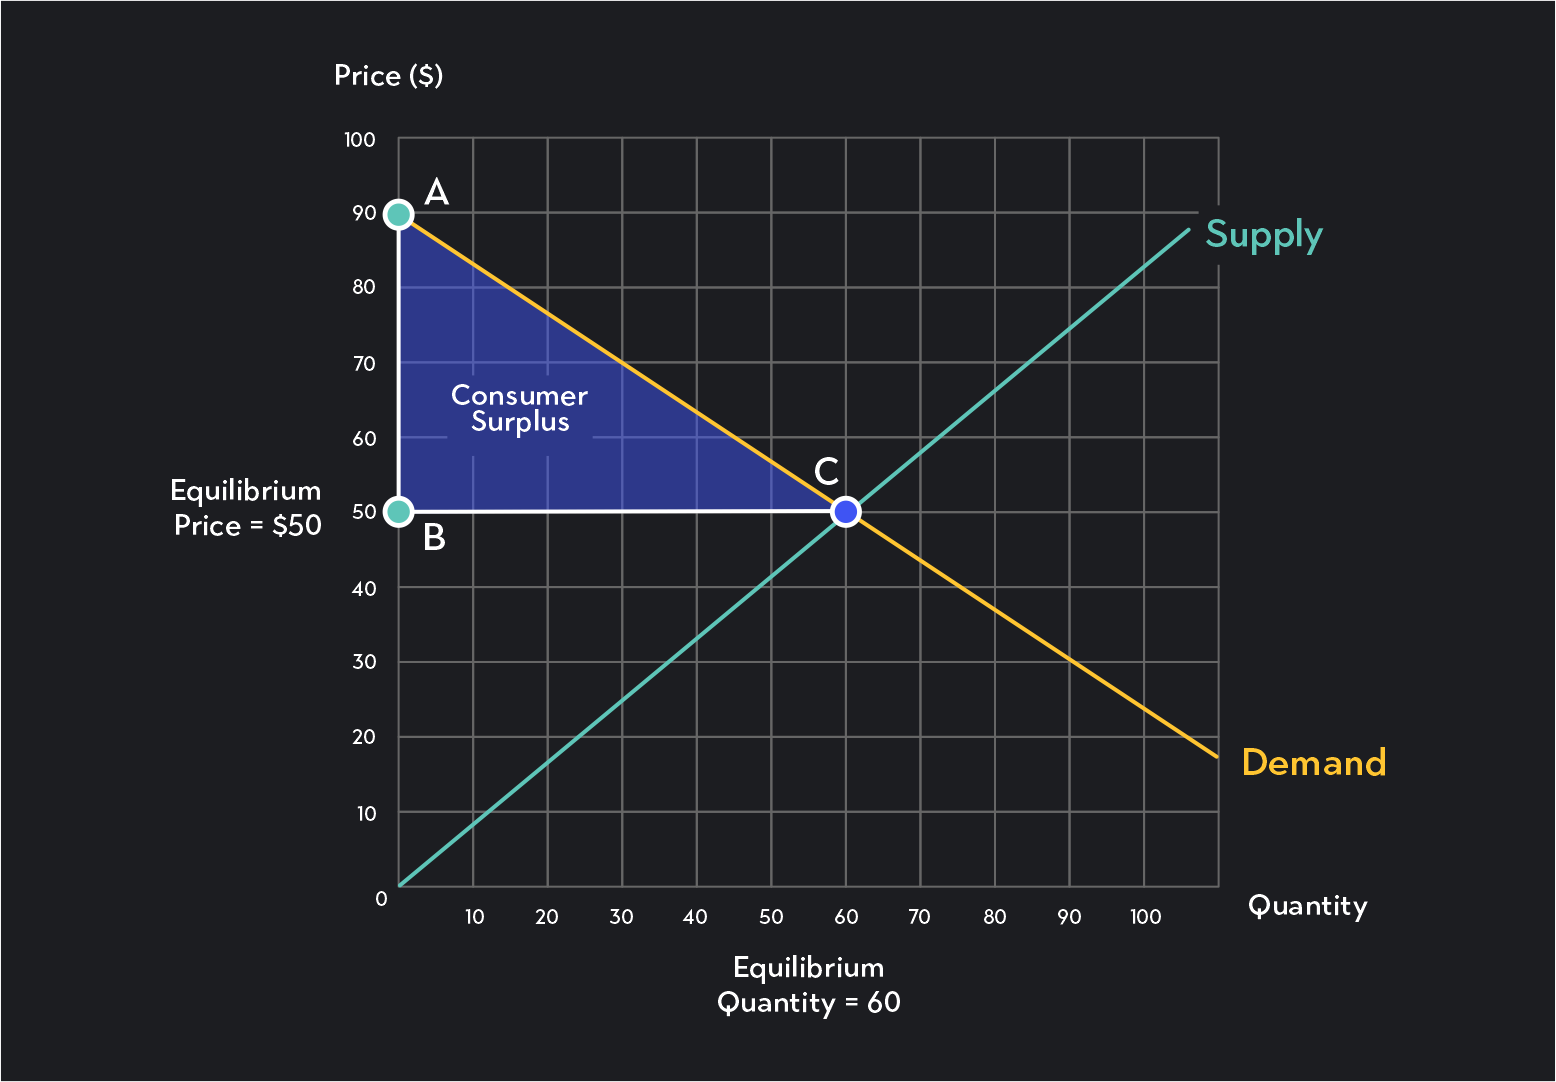
Consumer Surplus (definition + formula)
Difference between what consumers are willing to pay and what they actually pay
½(Q*)(Pmax - P*)
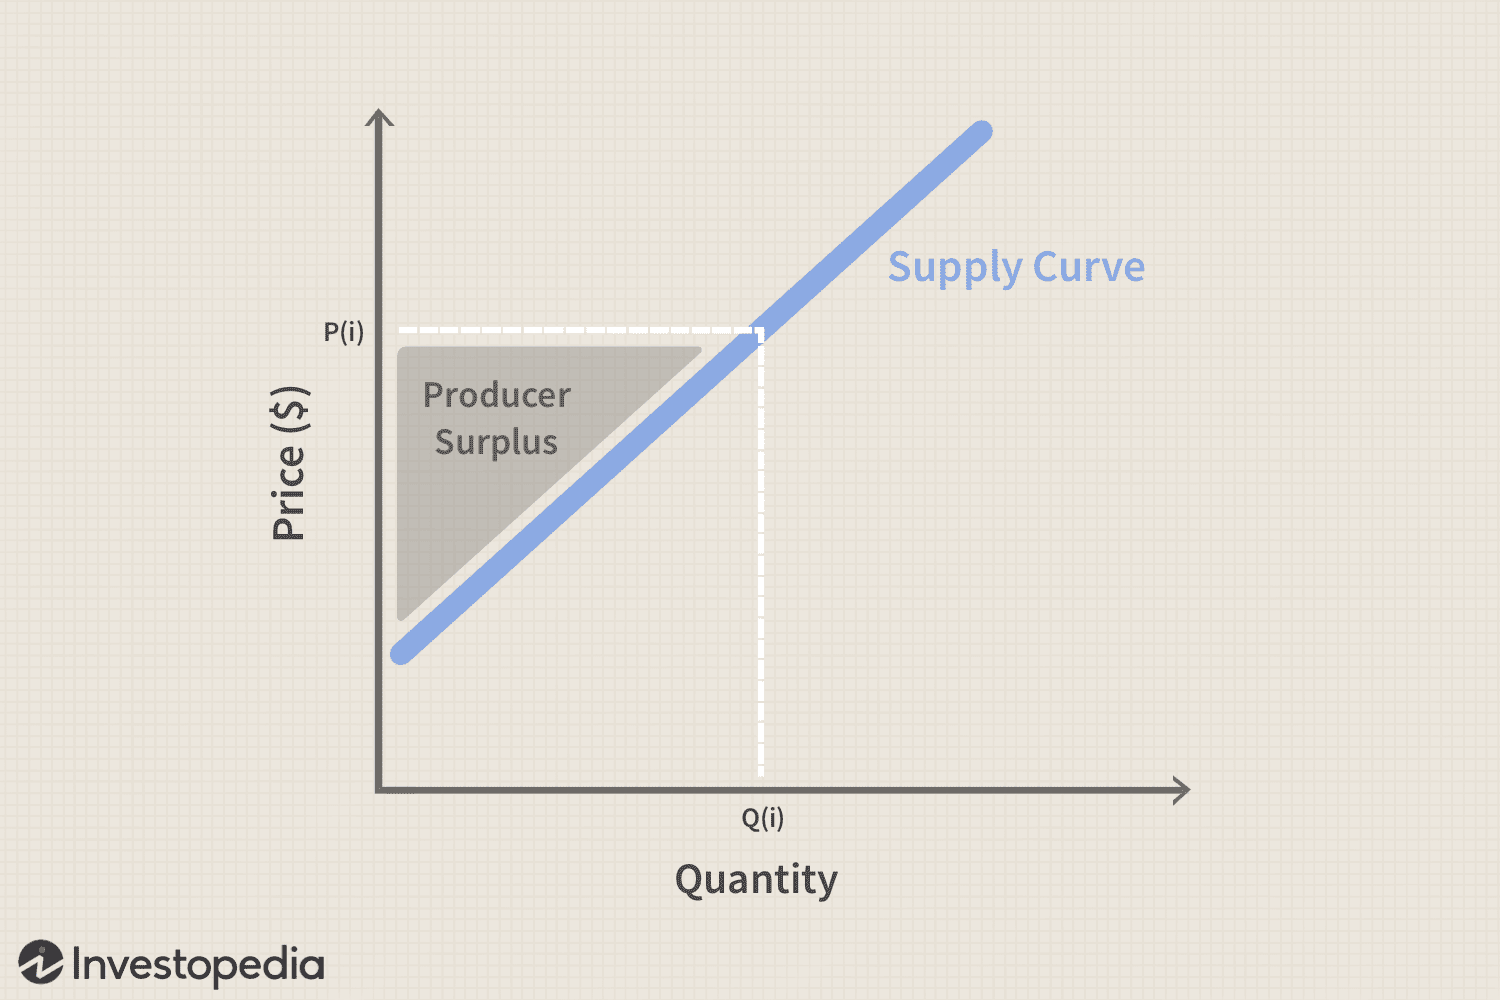
Producer Surplus (definition + formula)
Difference between the price received and sellers’ cost of production
½ (Q*)(P*- Pmin)

Total Surplus (Definition + formula)
overall net benefit or economic welfare gained by buyers and sellers in a market
½ (Q*)(Pmax - Pmin)

Deadweight Loss (definition + key rule + formula)
Surplus lost when actual quantity traded doesn’t equal Q*
changing quantity ==> creates/destroys DWL
½ (Pb - Ps)(Q* - Qt)
Why Equilibrium is Efficient (Graph)
Left of Q*: MB (Deman) > MC (supply)
that unit is worth making, but isn’t made so surplus turns into DWL
Right of Q*: MC > MB
that unit costs more than it’s worth, shouldn’t be made
At Q*: MB = MC exaclty
every worthwhile unit made, no wasteful ones, so surplus is maximized
Price Elasticity of Demand (definition + formula)
How much quantity demanded changes when price changes
Increased elasticity = small changes in price lead to large changes in quantity demanded
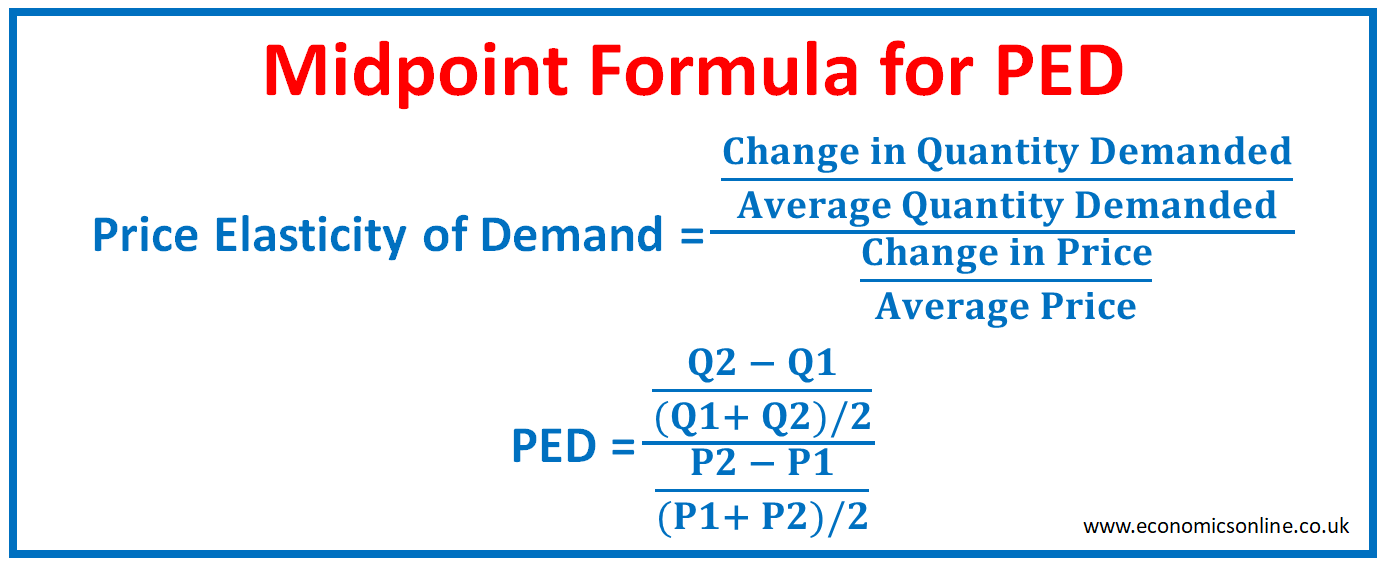
Price Elasticity of Supply (definition + formula
How much the quantity supplied changes when price changes
Increased elasticity = small changes in price leads to large changes in quantity supplied

Elasticity landmarks
Elasticity = 0: Perfectly inelastic
0 < Elasticity < 1: Inelastic
Elasticity = 1: Unit elastic
1 < Elasticity < infinity: Elastic
Elasticity = infinity: Perfectly Elastic
Determinants of Price elasticity of Demand
Narrowly defined vs Broadly defined
Availability of close substitutes
Luxury Goods (unnecessary)
Long time horizon: bigger time interval shows more elasticity
Elasticity (in relation to revenue)
Revenue = (P)(Q)
If demand is inelastic, a price increase will raise revenue
if demand is aielastic, a price increase will lower revenue
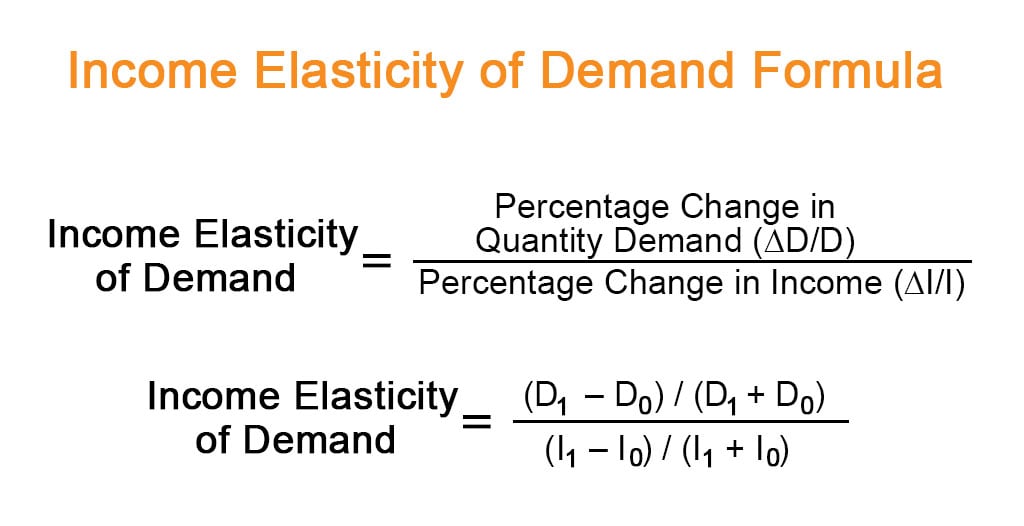
Income elasticity of demand
How much quantity demanded changes when income changes
Increased elasticity = small change in income leads to large change in demand
Cross Price elasticity of demand
How much quantity demanded of good Y changes when the price of good X changes
Increased elasticity = small changes in price of good X leads to large change in demand of good Y

Price ceiling (definition + who it helps + effect when binding + example)
a level above which price is not allowed to rise
Helps consumers
Binding price ceiling (below P*) ==> shortage (Qd > Qs)
Qs = the actual quantity sold
Surplus transfers from PS to CS on units still being sold
DWL on units no longer made
Ex: Rent Control

Price floor (definition + who it helps + effect when binding + example)
a level below which price is not allowed to fall
Helps producers
Binding price floors (above P*) ==> surplus (Qs > Qd)
Qd = the actual quantity sold
Surplus transfers from CS to PS on units still sold
DWL on units no longer sold
Example: minimum wage (surplus = unemployment)