Single Species Population Growth
1/21
There's no tags or description
Looks like no tags are added yet.
Name | Mastery | Learn | Test | Matching | Spaced |
|---|
No study sessions yet.
22 Terms
What does ecology describe?
Describes the patterns of abundance and distribution of species and identify the mechanism that give rise to these patterns
What is population ecology?
The study of changes in the size of population of a given species through time and the factors that regulate it
What does population mean?
Group of individuals of a single species that occupy the same genral area
By using the definition of population what does this mean for an individuals?
→Rely on the same resources
→Are influenced by biotic and abiotic factors
→Have a high probability of interacting
What are the 3 things that characterise populations:
→How many individuals/density/biomass
→How fast it grows
→Limits to its growth
Equation for growth and explain each variable:
Nt+1=Nt+Bt+It-Dt-Et
Nt=Number of individuals
Bt+It=How fast it grows
Dt-Et=Limits to its growth
What are the 3 survivorship curves:
→Type I=K strategists
→Type II=Bothe R and K
→Type III=R strategists
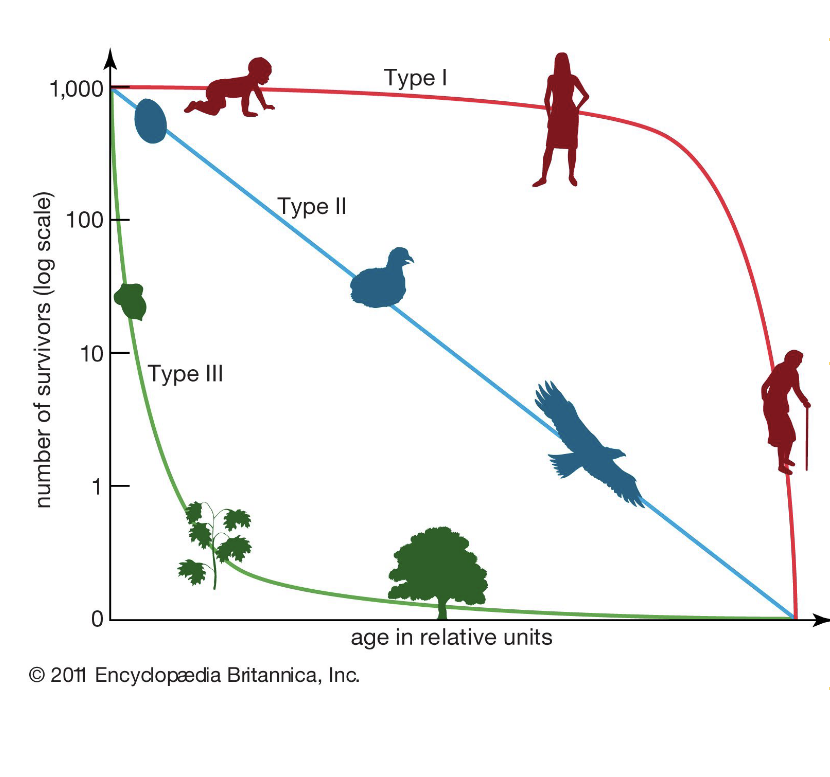
Type I=K strategists
→Live to old age
→Few offspring, long periods of parental care
Type II=Both R and K
→Constant survivorship
→Many offspring, some parental care
Type III=R strategists
→Low early and high late survival
→Many more offspring, little or no parental care
When do populations grow exponentially?
→Births and death rates are constant
→More births than deaths
→There are no limiting resources
Equations for local, closed populations in exponential growth: Discrete/Difference
Nt+1=RNt
Nt=N0ert
What does the R/r in these two equations, Nt+1=RNt/Nt=N0ert, represent?
R=Finite rate of population
r=Intrinsic rate of increase
Equation for local, closed populations in exponential growth: Continuous/Differential
dN/dt=rN
Discrete time vS Continuous time
Discrete:
→Model change over one time step
→Easy to stimulate
→Easy to analyse
→Difference equations
→Less stable
Continuous:
→Model instantaneous rate of change
→Simulations often require numerical integration
→Analytical solutions might be limited to equilibrium points
→Differential equations
→More stable
Difference equation
Nt+1=RNt
Differential equation
dN/dt=rn
What does it mean by stability in discrete time and continuous time?
The amount of delay in populations
→more delay=less stable
→less delay=more stable
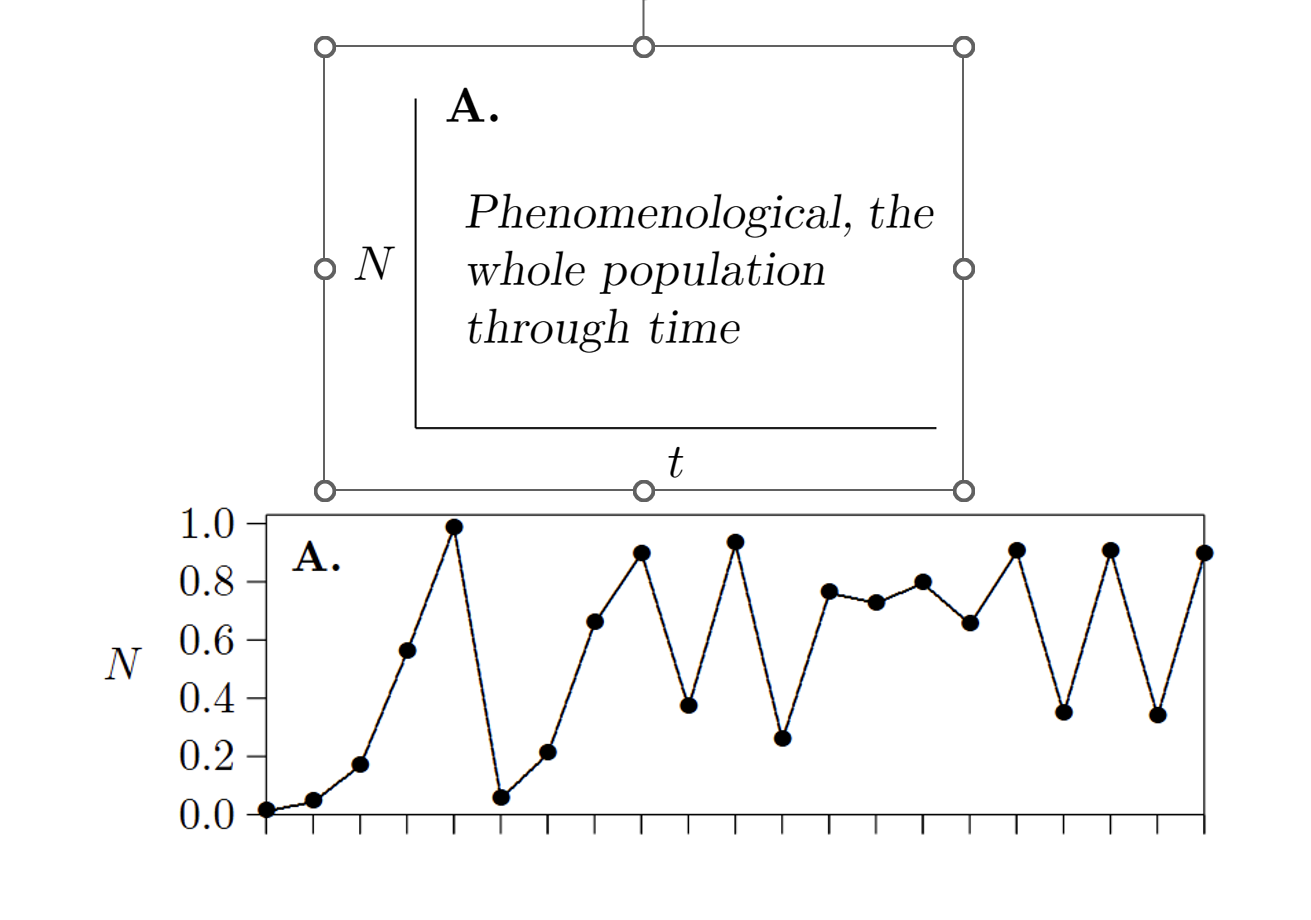
How do you represent data that is phenomenological, the whole population through time?
X-axis=Time (t)
Y-axis=Population size (N)
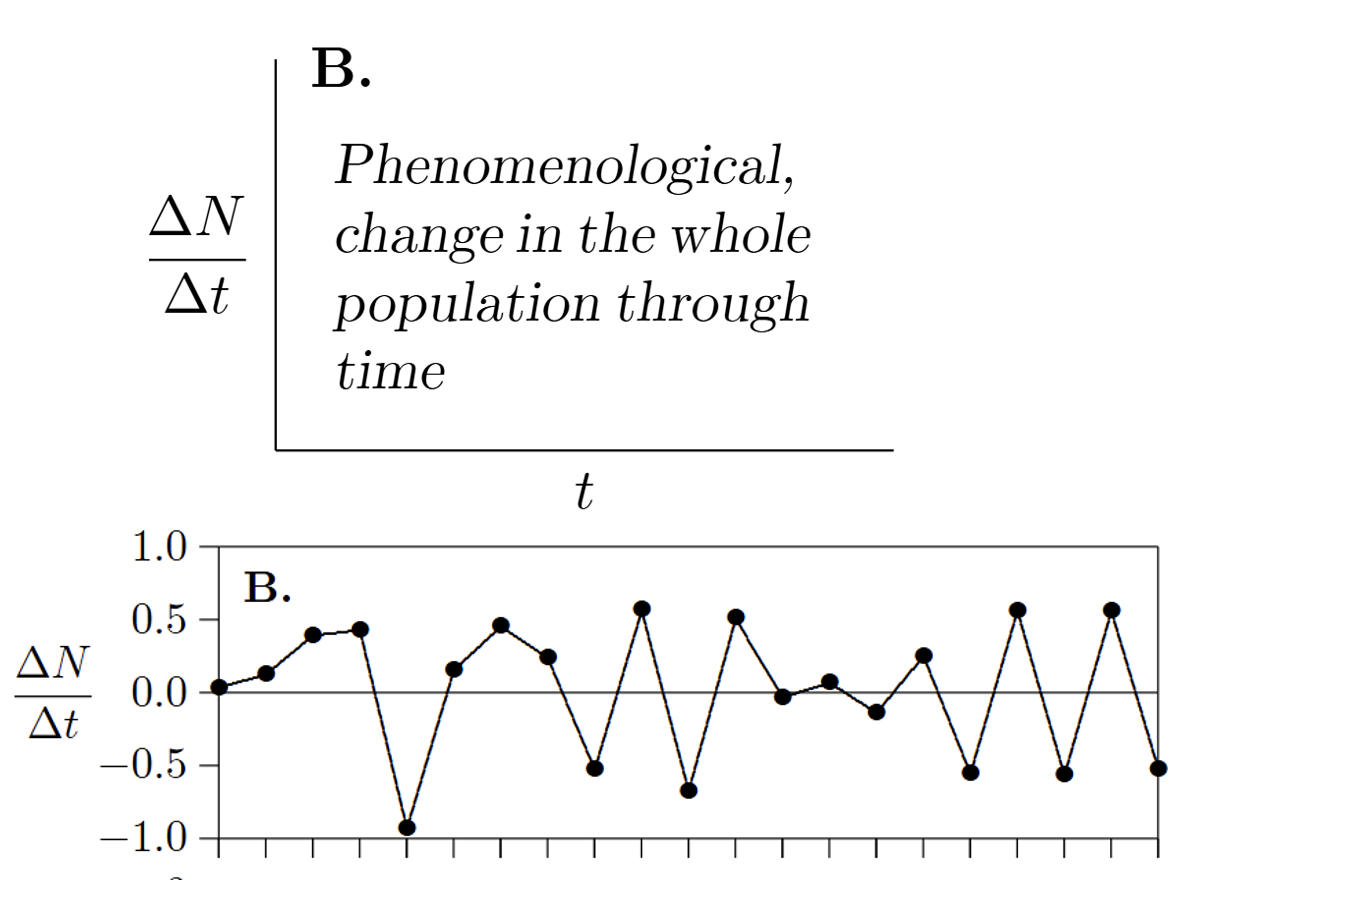
How do you represent data that is phenomenological, change in the whole population through time?
X-axis=Time (t)
Y-axis=Rate of change in population over time (∆N/∆t)
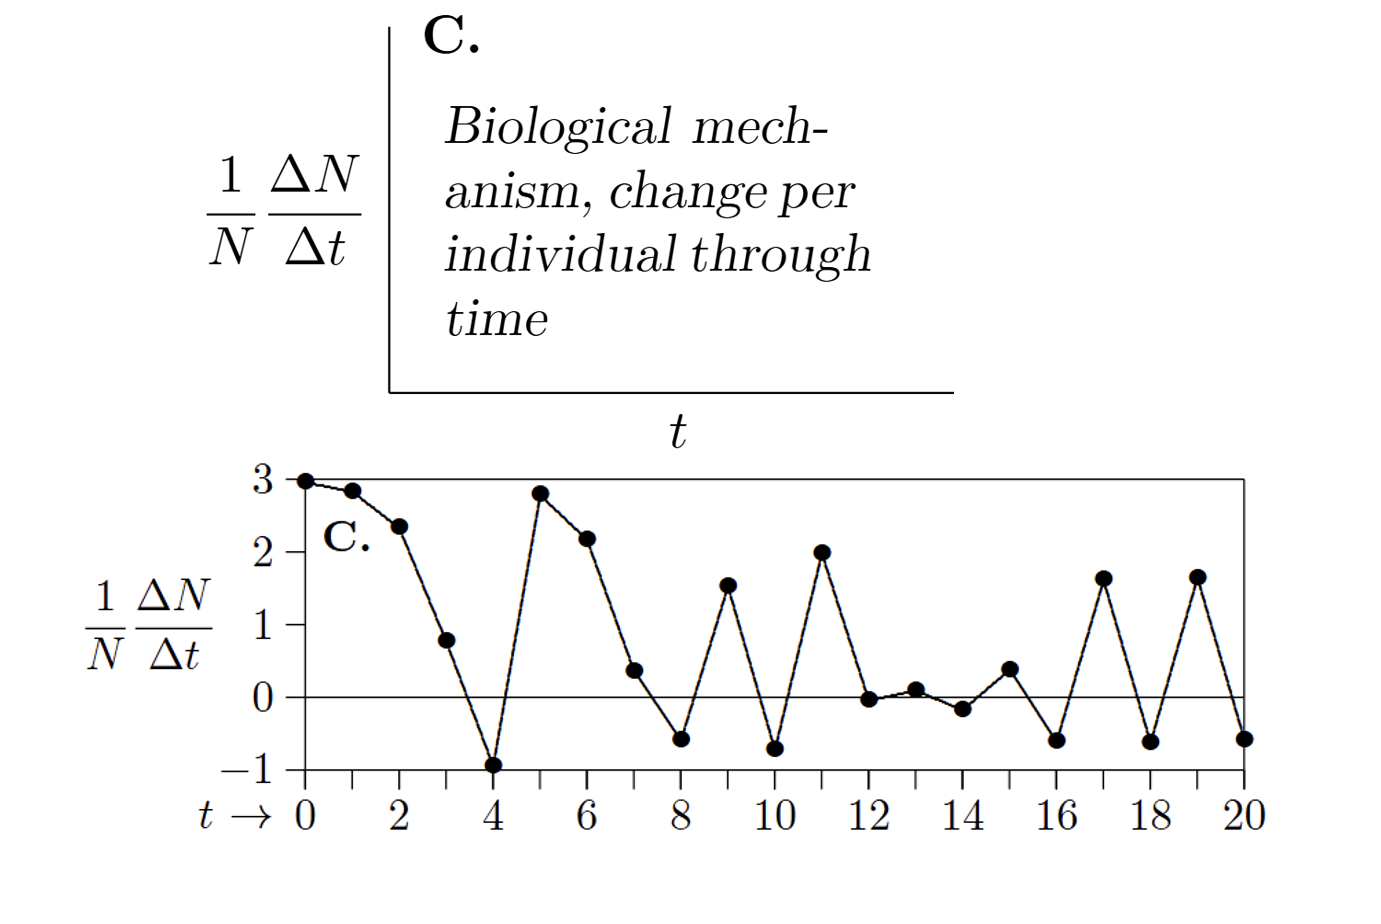
How do you represent data that has biological mechanism, change per individual through time?
X-axis=Time (t)
Y-axis=Per capita rate of population change (1/N∆N/∆t)
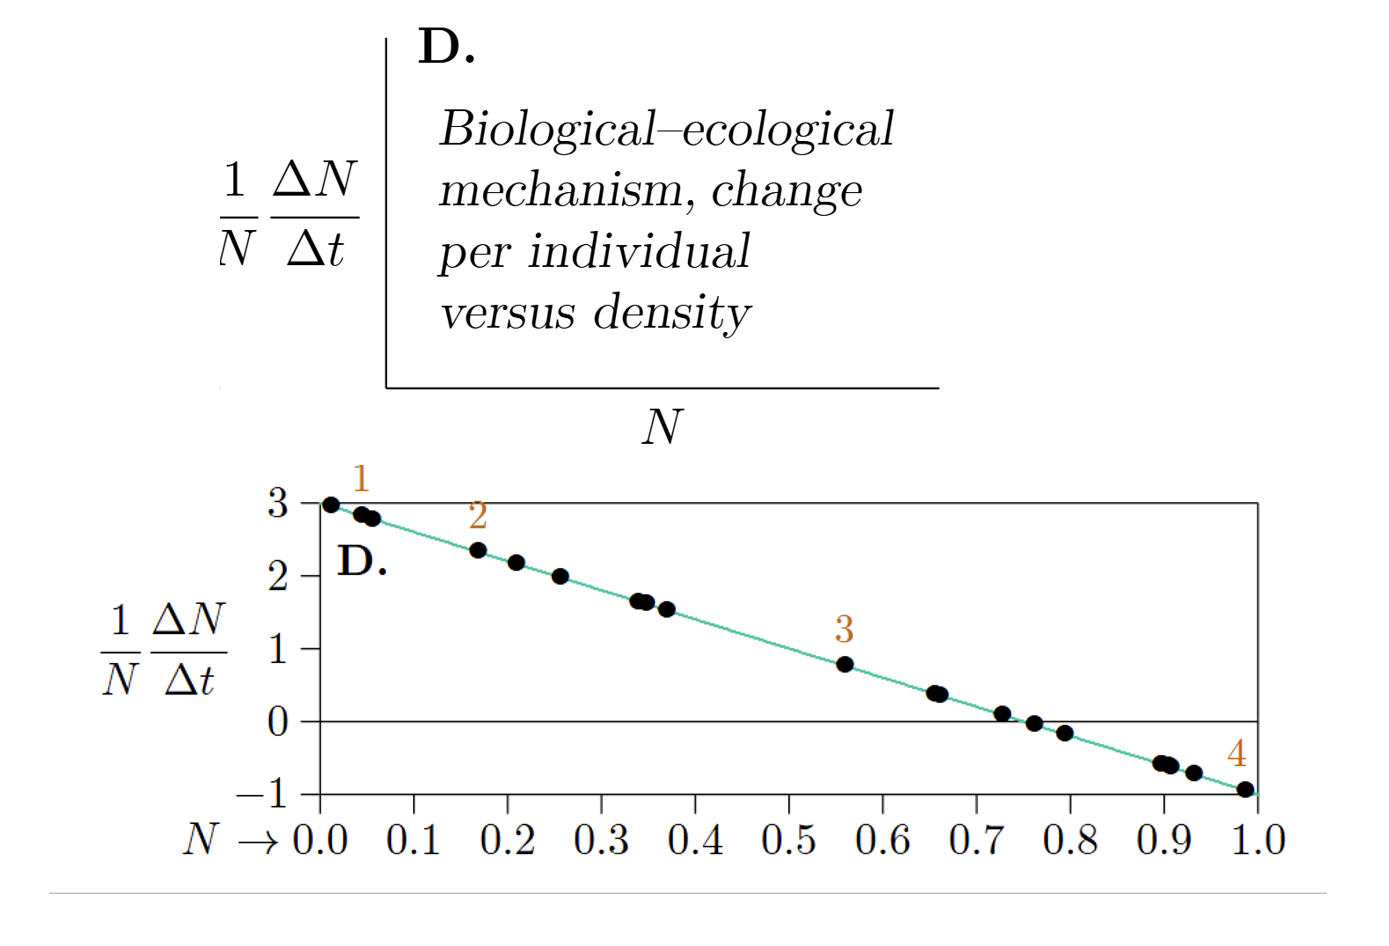
How do you represent biological-ecological mechanism change per individual versus density?
X-axis=Population size
Y-axis=Per capita rate of population change (1/N∆N/∆t)