Cumulative Test ESS
5.0(1)
Studied by 63 peopleCard Sorting
1/71
Earn XP
Description and Tags
Last updated 11:02 PM on 11/30/22
Name | Mastery | Learn | Test | Matching | Spaced | Call with Kai | Chat |
|---|
No analytics yet
Send a link to your students to track their progress
72 Terms
1
New cards
EVS
is a set of paradigms that shapes the perception of Environmental threats, How they may impact the environment, and their importance.
2
New cards
Factors that can affect EVS
Culture
Religion
Education
Experience
Family
and more...
Religion
Education
Experience
Family
and more...
3
New cards
Ecocentric
nature and ecology are at the center. They propose minimal disturbance of the natural processes to achieve sustainability.
4
New cards
Anthropocentric
People-centered approach in which people manage their environment and themselves with the help of independent regulatory authorities.
5
New cards
Technocentric
Technology will keep pace with and provide solutions to all problems.
6
New cards
Open System
exchanges matter and energy with its surroundings (living organisms)
7
New cards
Transfer and Transformations
Transfer: move energy or matter from one place to the other in the same form
Transformation: move energy or matter but changes state or form
Transformation: move energy or matter but changes state or form
8
New cards
Closed system
exchanges energy but not matter with its surroundings (nitrogen and carbon cycle)
9
New cards
Isolated System
doesn't exchange
10
New cards
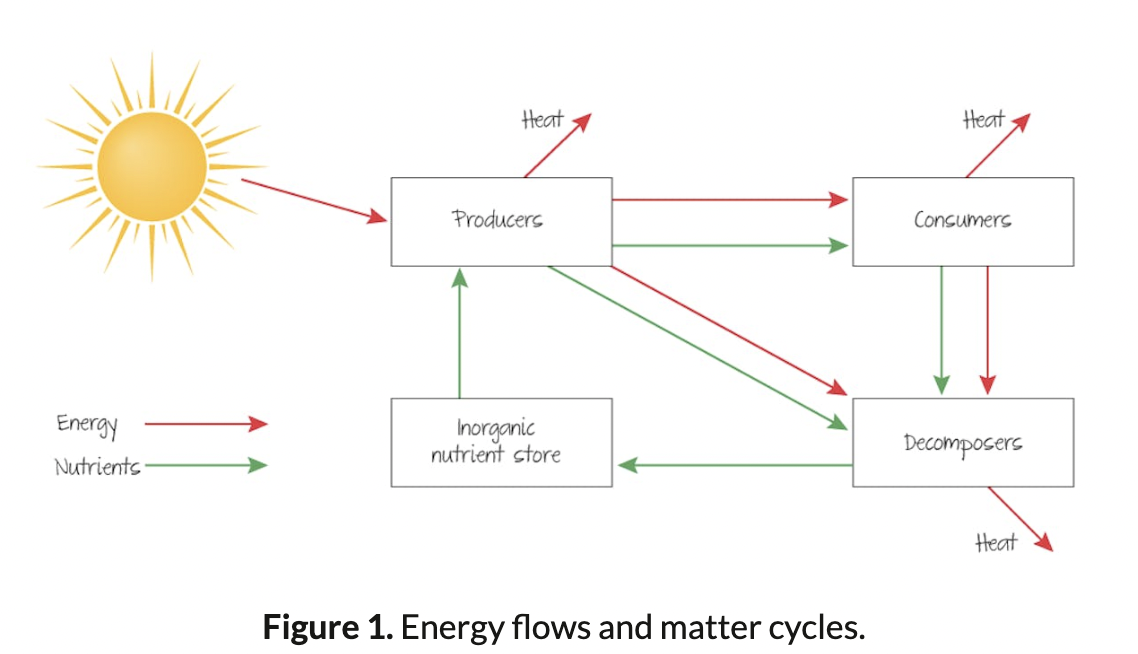
Matter and Energy
Energy flows, Mater cycles
11
New cards
Feedback
Part of the system's output re-enters the system as a new input.
12
New cards
Negative Feedback
tends to balance, neutralize, and promote an ecosystem
13
New cards
Positive Feedback
increases change and creates instability an ecosystems
14
New cards
Tipping points
part of a system that kick-starts self-perpetuating positive feedback loops that push the systems to a new state of equilibrium.
15
New cards
1st law of thermodynamics
Energy cannot be created or destroyed. We transform existing energy to the energy. (Ex. in a food chain, light to chemical to heat energy)
16
New cards
2nd law of thermodynamics
Every energy transfer or transformation increases the entropy of the universe. (Entropy: the increase of randomness and disorder in an ecosystem)
17
New cards
3rd Law of thermodynamics
The entropy of a system approaches a constant value as the temperature approaches zero.
18
New cards
Static Equilibrium
when the components of the system remain constant over a long period of time
19
New cards
Steady State Equilibrium
Many small changes over short periods of time
20
New cards
Resistance and Resilience
Resistance: when the ecosystem continues to function *during* the disturbance. Resilience: ability of the ecosystems to recover *after* disturbance
21
New cards
Natural Capital
Natural resources that produce sustainable natural income of good and services
22
New cards
Sustainability
The ability to keep in existence or maintain. A sustainable ecosystem is one that can be maintained
23
New cards
Types of Pollution
organic or inorganic, persistent or biodegradable, acute or chronic, primary and secondary.
24
New cards
Sources of Pollution
point source (single identifiable) and non-point source (pollution from diffuse sources)
25
New cards
Model of pollution management
Educate, legislate, remediate
26
New cards
DDT (dichlorodiphenyltrichloroethane)
It is an organochloride insecticide that is colorless, tasteless, and odorless. Highly effective in controlling malaria, but is a persistent pollutant.
- can cause cancer and damage the reproductive system
- not biodegradable.
- Bioaccumulates increases of concentration in organisms and biomagnifies and accumulates through the food chain.
- can cause cancer and damage the reproductive system
- not biodegradable.
- Bioaccumulates increases of concentration in organisms and biomagnifies and accumulates through the food chain.
27
New cards
Biotic and Abiotic
living (biotic) and nonliving components of an ecosystem (abiotic)
28
New cards
3 components of the ecosystem
Producers: plants that convert energy into matter
Consumers: animals that eat plants/animals
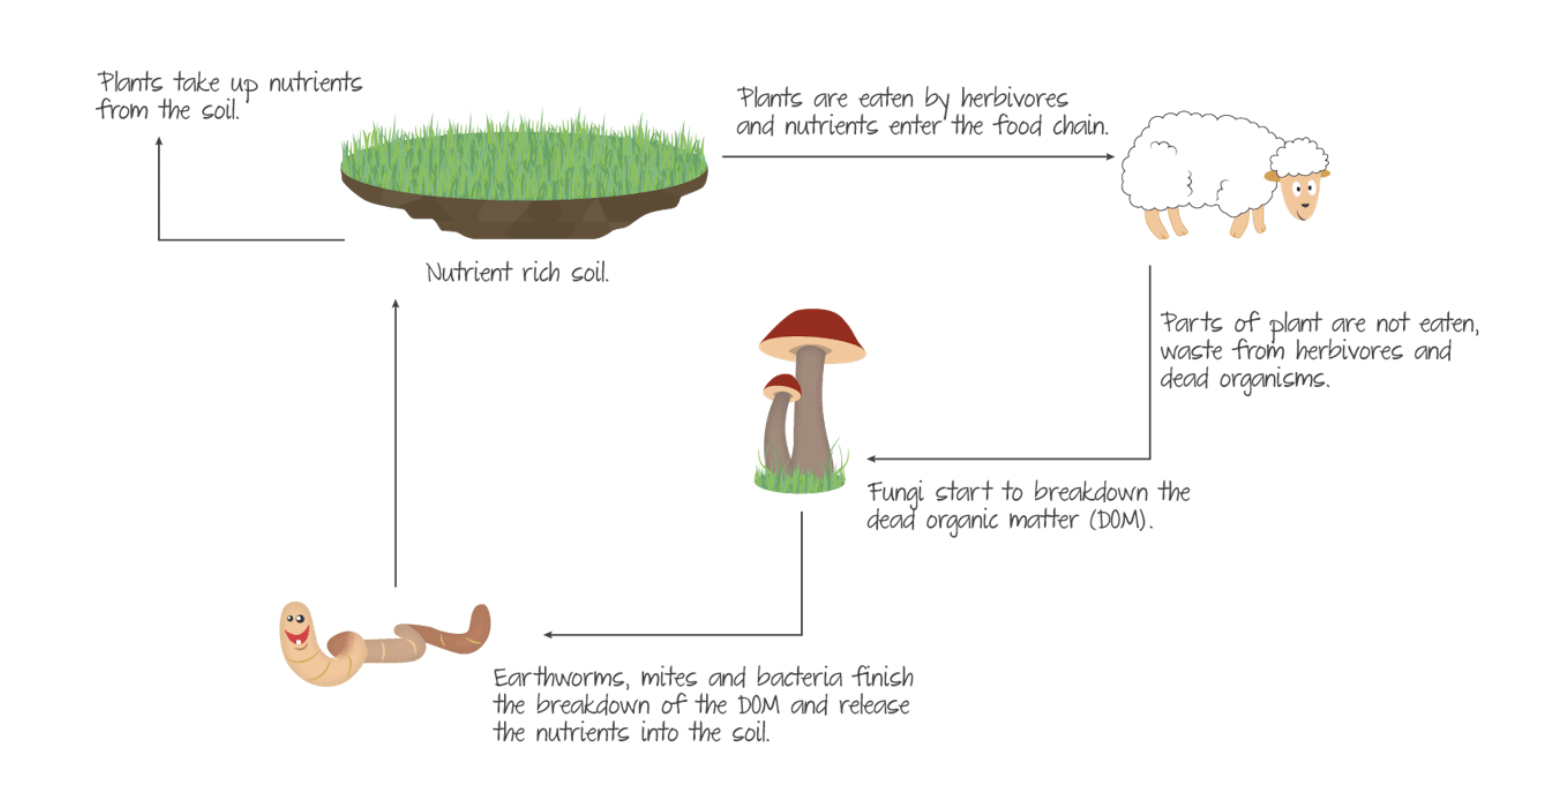
Decomposers: break down waste into reusable components
Decomposer Cycle
Consumers: animals that eat plants/animals
Decomposers: break down waste into reusable components
Decomposer Cycle
29
New cards
Niche
An organism's particular role in an ecosystem, or how it makes its living.
30
New cards
Carrying Capacity
Largest number of individuals of a population that a environment can support
31
New cards
Population growth curves
A graphical representation of how a particular quantity increases over time. J-shaped and S-shaped curves
32
New cards
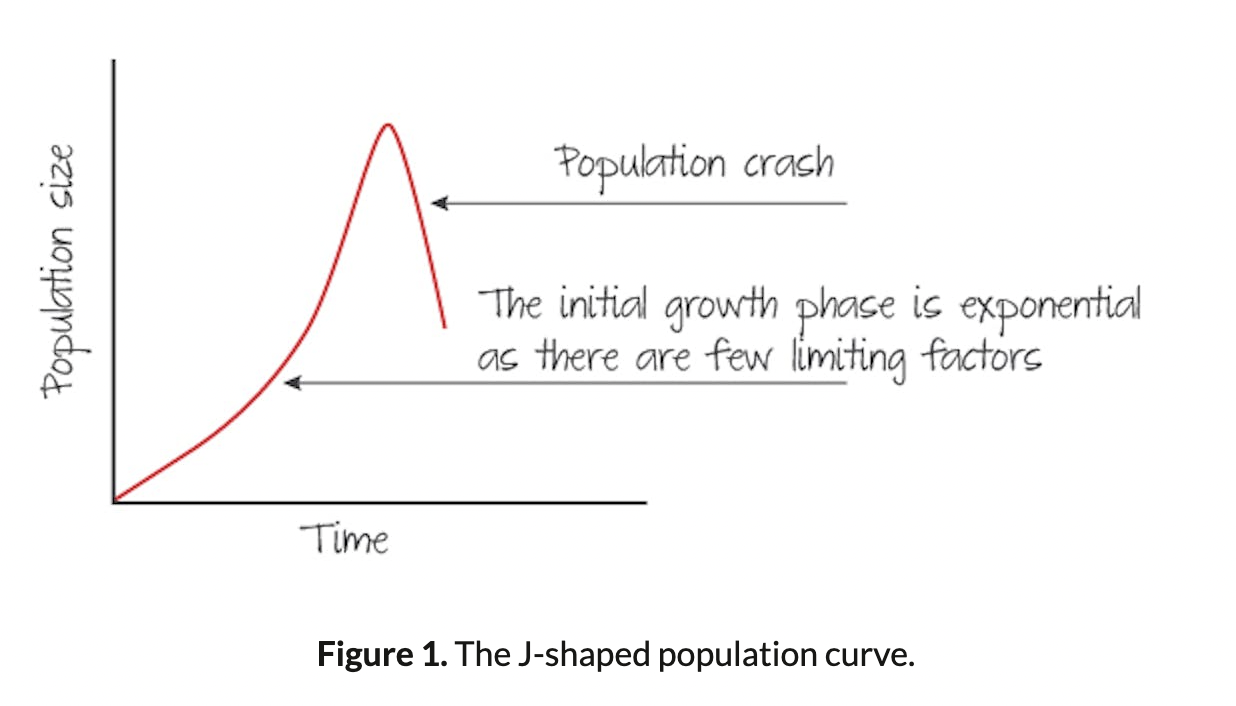
J-Shaped curves
Exponential growth under ideal conditions with plenty of resources and limited competition. Population continues to grow until enviromental resistance takes effect (could be organisms have used all the resources available).
Organisms which follow this graph generally show great fluctation and a boom and bust pattern in population numbers.
Organisms which follow this graph generally show great fluctation and a boom and bust pattern in population numbers.
33
New cards
Photosynthesis
green plants are able to take light energy and use it to make chemical energy to gain biomass
inputs: carbon dioxide, water, light energy
Outputs: Oxygen, Glucose, chemical energy
IMAGE
inputs: carbon dioxide, water, light energy
Outputs: Oxygen, Glucose, chemical energy
IMAGE
34
New cards
Respiration
is the oxidation of glucose to release energy that is then used in all activities in the organism.
Inputs: Oxygen, Glucose
Oxidation
Outputs: carbon dioxide, water, energy
Inputs: Oxygen, Glucose
Oxidation
Outputs: carbon dioxide, water, energy
35
New cards
Trophic levels
IMAGE
36
New cards
NPP
the amount of usable biomass in an ecosystem
37
New cards
GPP
all the biomass produced by primary producers in a given time
38
New cards
Secondary Productivity
The production of organic matter by the consumers
39
New cards
NSP
calculated by substracting respiratory losses from GSP
40
New cards
Sustainable Yield
the amount of biomass that can be extracted without reducing natural capital of the ecosystem.
41
New cards
Matter Cycles
IMAGE
42
New cards
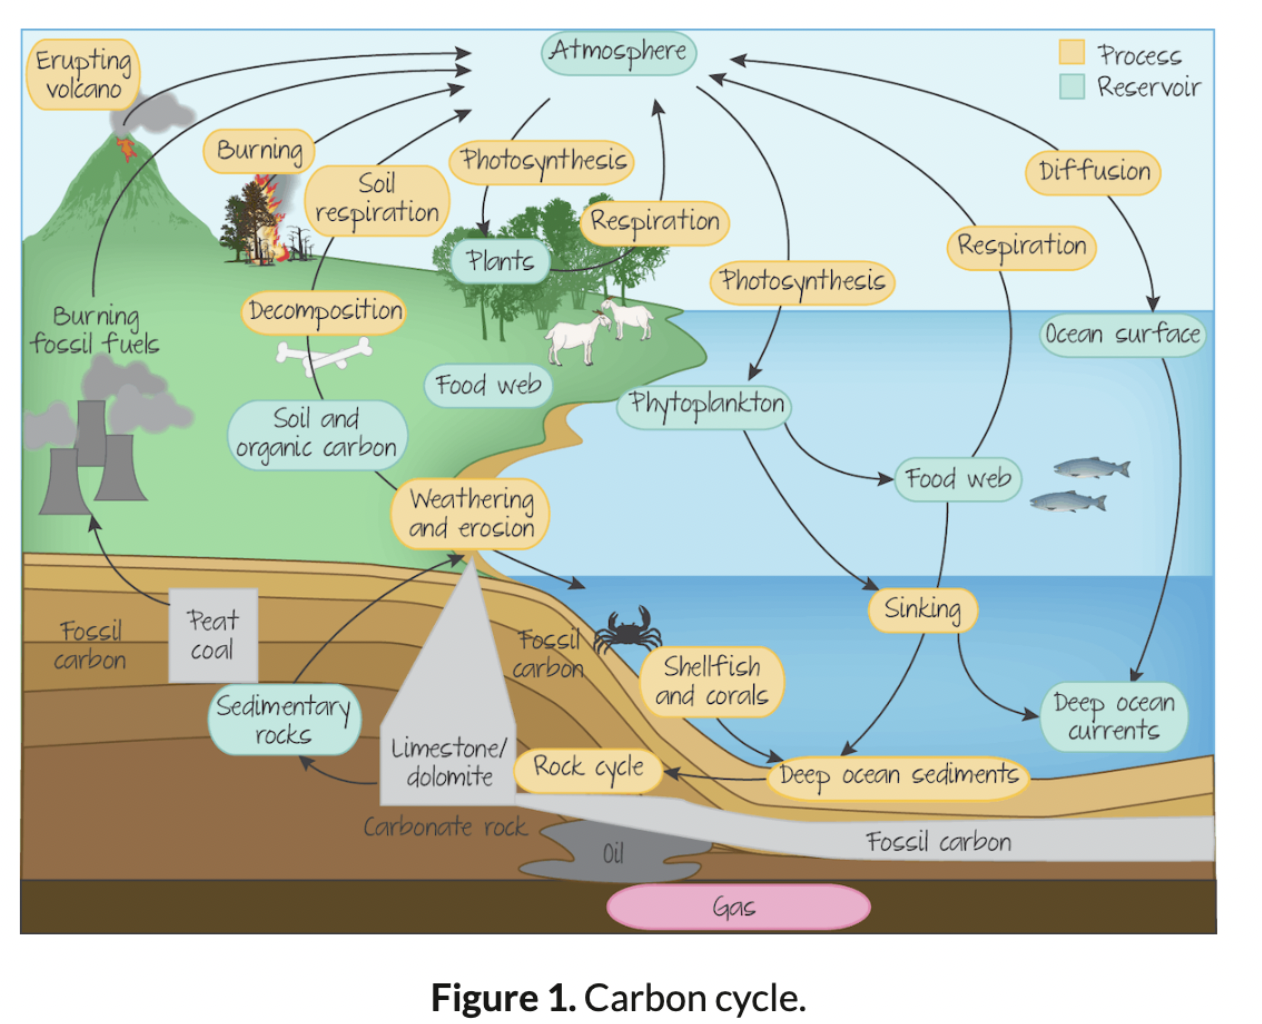
Carbon Cycle
IMAGE
43
New cards
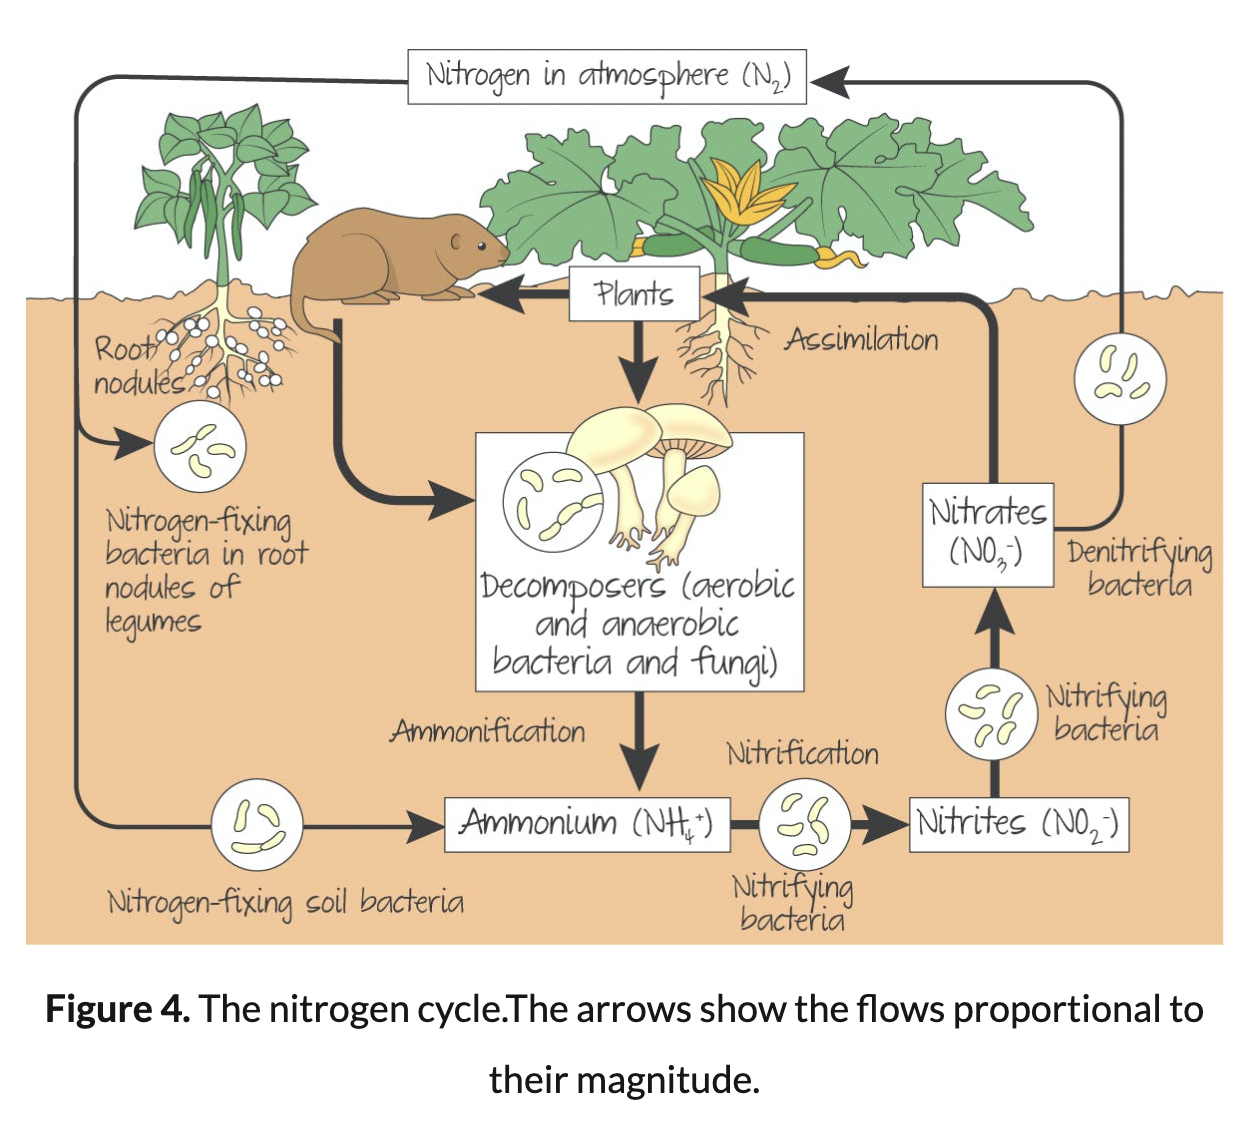
Nitrogen Cycle
Nitrogen in the atmosphere, nitrogen fixing-soil bacteria, nitrifying bacteria, and denitrifying bacteria
44
New cards
Types of interactions
Predation, herbivory, parasitism, mutualism, disease, competition
45
New cards
Interactions
regulate population size and impact the balance of the food web
46
New cards
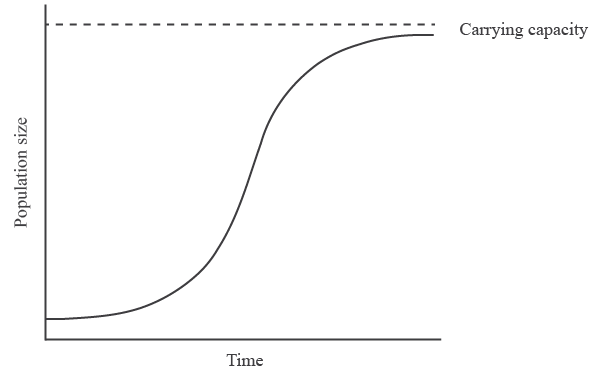
S-shaped curves
- More likely when resources are limited (limiting factors). - Exponential growth is only possible for a short period of time
- More likely to be accurate until the population approaches carrying capacity.
- More likely to be accurate until the population approaches carrying capacity.
47
New cards
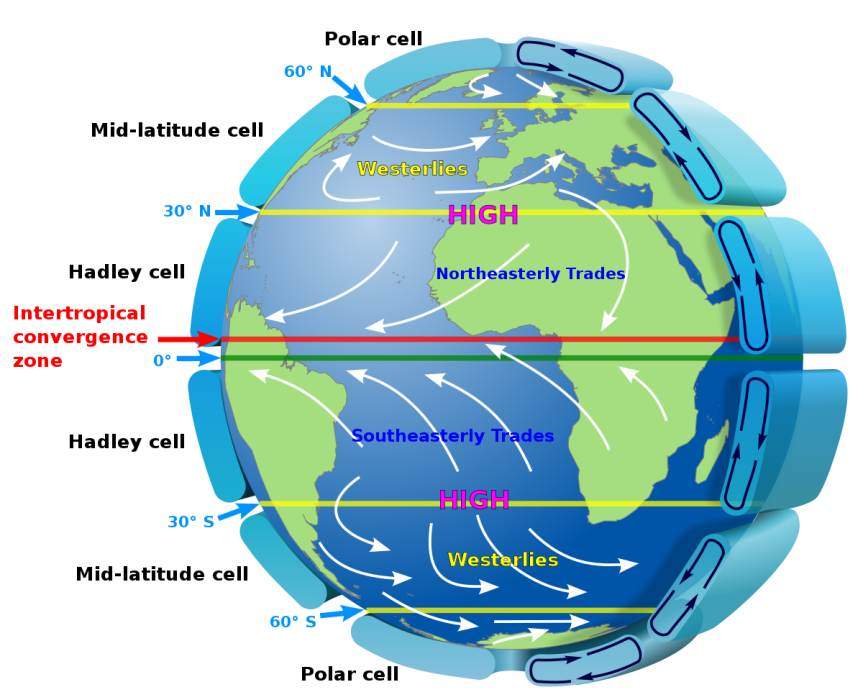
Tri-cellular model
Hadley Cells (larger cell, greatest heating), Ferrel Cells (flow in the opposite direction) Polar Cells (smaller cells)
48
New cards
Biomes
is a collection of ecosystmes that are classified according to their predominant vegetation.
49
New cards
Five categories of Biomes
Aquatic: Freshwater, Marine
Forest: Tropical Rainforest
Grassland: Savanna
Desert
Tundra: Arctic
Forest: Tropical Rainforest
Grassland: Savanna
Desert
Tundra: Arctic
50
New cards
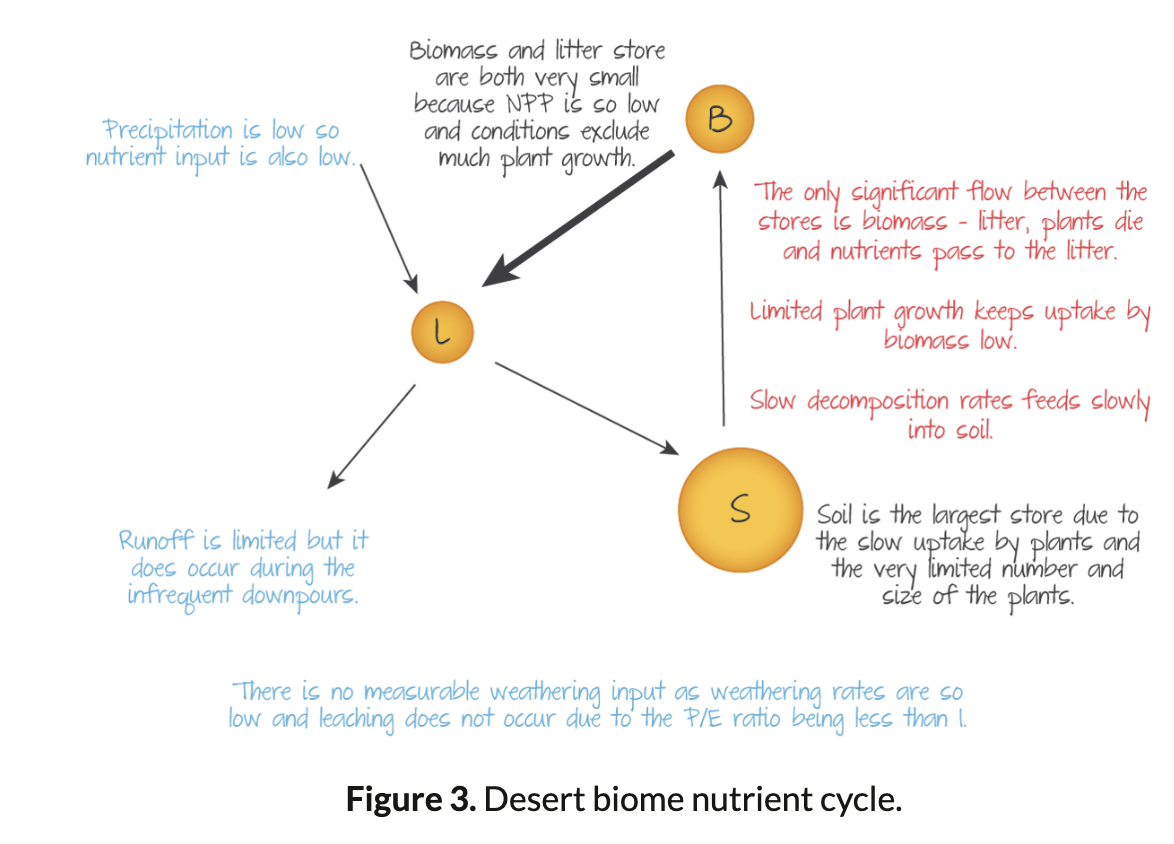
Nutrient cycle for Desert Biome
Soil is the largest store, then Biomass, then litter.
51
New cards
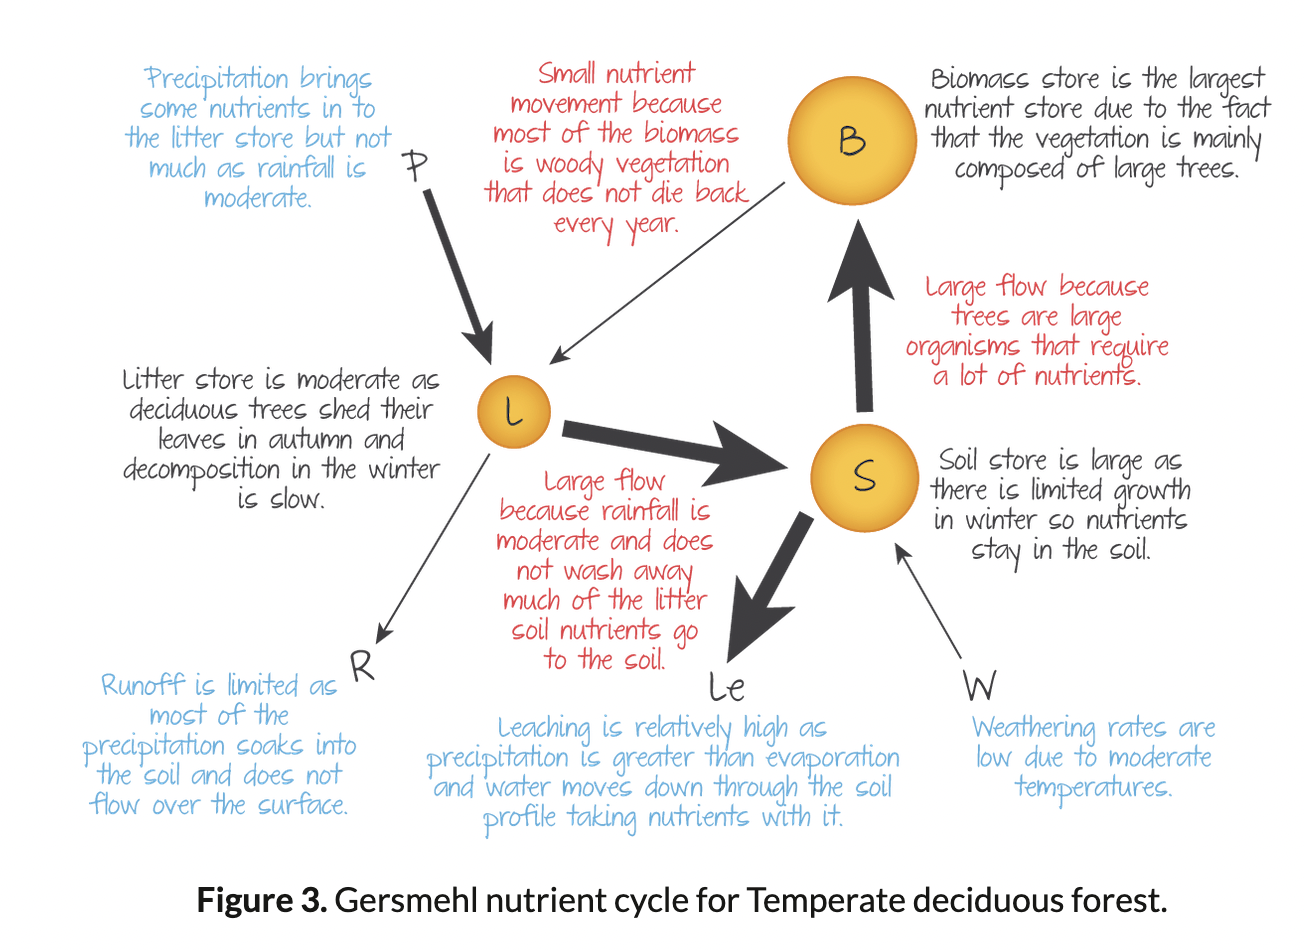
Nutrient Cycle for Temperate deciduous Forest Biome
Biomass is the largest store, then soil, then litter.
52
New cards
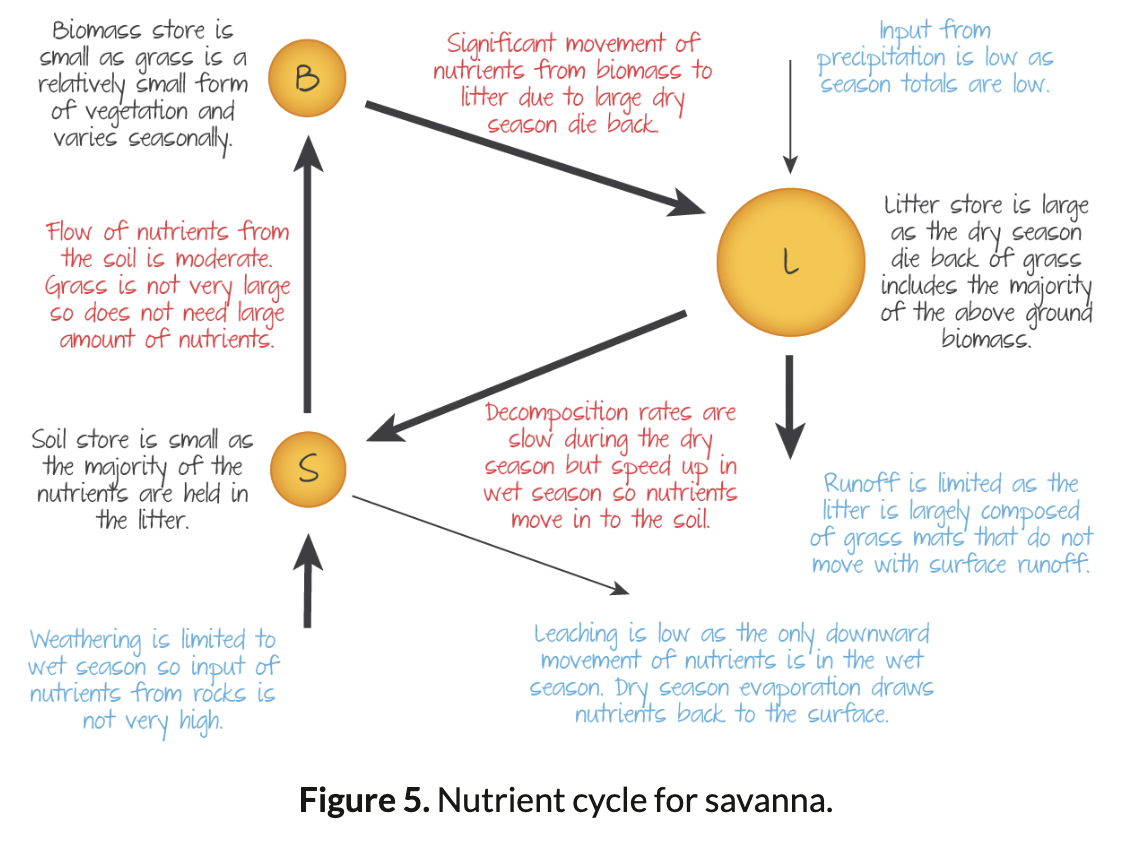
Nutrient Cycle Grassland Biome
Litter is the largest store, then biomass, then soil.
53
New cards
Zonation
is the change in a vegetation community along an environmental gradient (spatial and terminated by changes in the abiotic factors)
54
New cards
Sucession
is the predictable change in a vegetation community over time (starts with a pioneer community) a group of species whom all inhabit new land together.
Primary: occurs in areas that never have been occupied
Secondary: occurs in areas has been a natural or human-made disturbance
Primary: occurs in areas that never have been occupied
Secondary: occurs in areas has been a natural or human-made disturbance
55
New cards
Sucession Stages
Colonization: initiated by pioneer and r-strategists species
Energy and nutrient cycling is limited. NPP is high, GPP is low.
Establishment: the 'ecosystem' starts to compose. Soil becomes deep enough for invertebrates.
Competition: The environment is less extreme and more sustainable—k-strategist start to dominate.
Climax Community: is in steady state equilibrium. NPP is low and GPP is high.
56
New cards
K-Strategist (K-selcted species)
- Produce very few offspring, but they increase their quality of them by investing in a lot of parental care.
- More survival rate
To be able to do this the environment needs to be stable. In succession, stability increases with time so K-strategists are more common in the climax community.
- More survival rate
To be able to do this the environment needs to be stable. In succession, stability increases with time so K-strategists are more common in the climax community.
57
New cards
R-strategist (r-selected species)
- Focus on the increased quantity of offspring
- With little or no parental care, survival chances are low
The ability to reproduce in large numbers of offspring quickly is beneficial in unstable, unpredictable environments. The early stages of succession are unstable, harsh environments thus r-selected species are common in the pioneer stages.
- With little or no parental care, survival chances are low
The ability to reproduce in large numbers of offspring quickly is beneficial in unstable, unpredictable environments. The early stages of succession are unstable, harsh environments thus r-selected species are common in the pioneer stages.
58
New cards
Why are Cilmax Communities stable?
Stability is related to the complexity of the system. More complex = more stable. Stability tends to give an ecosystem a higher level of resilience
59
New cards
3 main sampling techniques
Random, Systematic, Stratified sampling
60
New cards
Random sampling
a sample that fairly represents a population because each member has an equal chance of inclusion
61
New cards
Systematic Sampling
select some starting point and then select every kth element in the population
62
New cards
Stratified sampling
researchers divide subjects into subgroups based on characteristics that they share
Stratified systematic sampling
Stratified random Sampling
Stratified systematic sampling
Stratified random Sampling
63
New cards
Quadrat
is an appropriately shaped plot used to identify an area you wish to study
64
New cards
Transects
Line transects: a line place according to a sampling strategy and then the vegetation that touches the line can be recorded
Belt transects: A belt of sampling
Belt transects: A belt of sampling
65
New cards
Testing Abiotic Factors
Turbidity, flow velocity, wind speed, slope angle, and soil
66
New cards
Testing Turbidity
To measure the transparency of a water body. Measured using a Secchi Disk which enters the water until is no longer visible.
67
New cards
Testing flow velocity
The speed at which a river flows. Measured using a flow meter, and simple flow. Which you put it on the water and the speed at which it rotates tells you the speed of the river.
68
New cards
Testing wind speed
Measured using an anemometer.
69
New cards
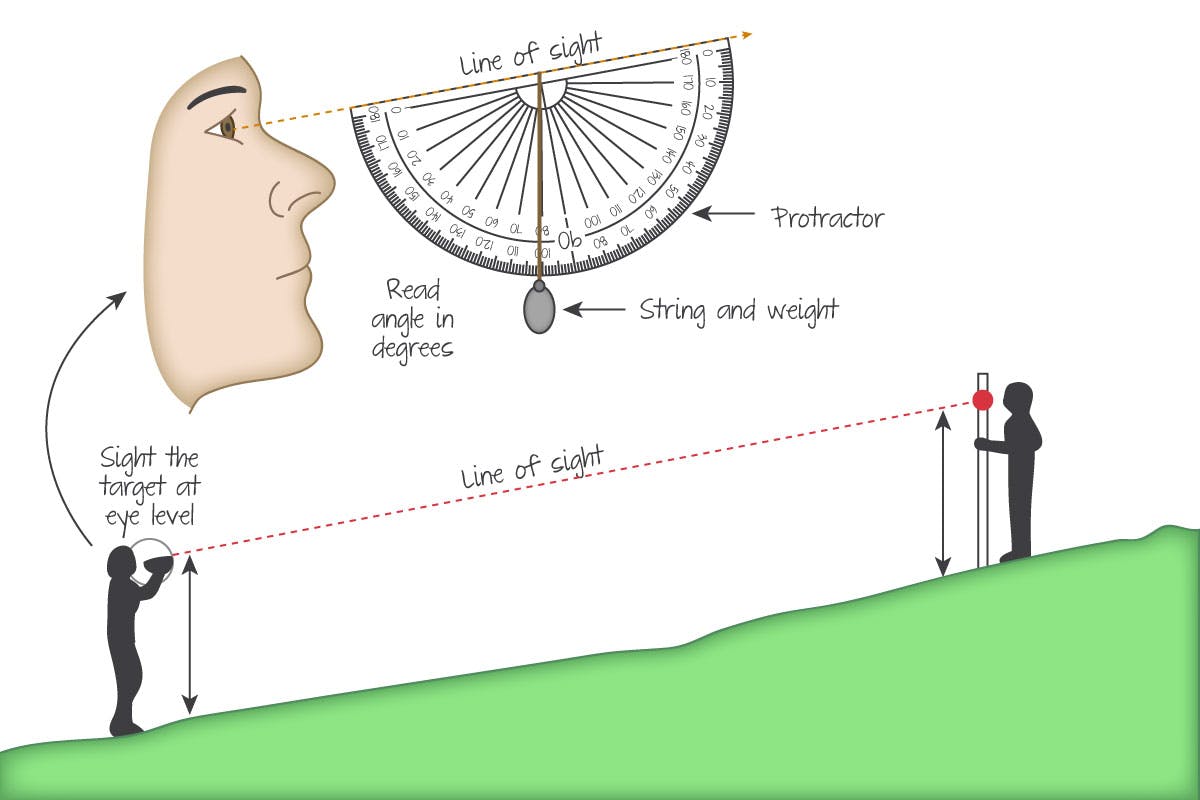
Testing Slope angle
Measured using a clinometer.
70
New cards
Capturing motile organisms
Traps, Nets, Pitfall Traps, Aerial Photography, Kick-sampling, Sweep Nets.
71
New cards
Lincoln Index
an indirect method by which the size of an animal population can be estimated. capture/mark/release/release/recapture
Assumptions:
- the proportion of marked animals in the second sample is the same as the proportion of marked animals in unmarked animals
- Enough time has elapsed to allow full mixing of marked and unmarked animals
- The population is closed and that there is no immigration
Assumptions:
- the proportion of marked animals in the second sample is the same as the proportion of marked animals in unmarked animals
- Enough time has elapsed to allow full mixing of marked and unmarked animals
- The population is closed and that there is no immigration
72
New cards
Enviromental gradient
the gradual change in the biotic factors through space.