BIOL 416 Invasion Bio Exam 2 Pt 2
5.0(1)
Card Sorting
1/34
Earn XP
Description and Tags
Study Analytics
Name | Mastery | Learn | Test | Matching | Spaced |
|---|
No study sessions yet.
35 Terms
1
New cards
Hybridization and Introgression
Interbreeding between individuals of distinct species and gene flow between species. These cause genetic pollution, which is adding new genes to a native species.
2
New cards
How does hybridization have genetics impacts on native species in mallards?
Mallards are invasive in many areas, and they mate with native ducks and have fertile offspring. Due to having higher numbers, the hybrids will then mate back with mallards instead of natives, adding more exotic genes to the gene pool
3
New cards
How does hybridization have genetics impacts on native species trout?
Brook trout are an exotic species that will mate with any trout around it. The resultant hybrid offspring are fertile but have low fitness. This results in gamete wasting. However, there are enough brook trout for them to find the right mate often enough. Native bull trout have a harder time finding the right mate, so the gamete wasting effects them more
4
New cards
Impacts of invasive species: Monarchs and pale swallowwort
Monarchs are milkweed specialists. They are on the decline due to agricultural herbicide and pesticide runoff effecting milkweed and themselves. It has been observed that they lay eggs on pale swallowwort, an exotic, but larvae never survived past 1st stage, which wastes gametes
5
New cards
Impacts of invasive species: Red imported fire ants vs mice and fence lizards
Mice need to find food at night while also avoiding owls, so they scavenge more often after rain for cover. When fire ants are present, the mice have to change their behavior and hunt more often without cover.
Since the invasion of red fire ants, fence lizards twitch and flee more often, as well as have longer leg length. This is to deal with and escape from fire ants
Since the invasion of red fire ants, fence lizards twitch and flee more often, as well as have longer leg length. This is to deal with and escape from fire ants
6
New cards
Spotted knapweed for population level impacts
SK is an invasive species, and one of the natives it effects is Mt. Sapphire rockcress. An experiment was done by removing SK in some fields of MSR and observing the different populations. It was found that the native species always did better when the exotic was weeded out.
7
New cards
Lake Victoria for community impacts via mass extinction
Lake Victoria was home to hundreds of species of cichlids. Nile perch were introduced to the lake as a game fish in 1950s and took up 1% of annual biomass, then took up 97% in 1987. Nile Perch are huge and feed exclusively on smaller fish, and cichlids never had to adapt to a larger predator, which lead to mass extinction
8
New cards
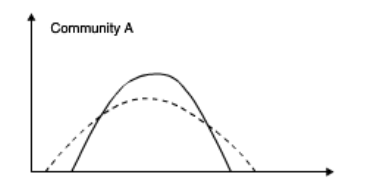
Genetic homogenization
Lower variation among the trait, but the mean is still the same.
9
New cards
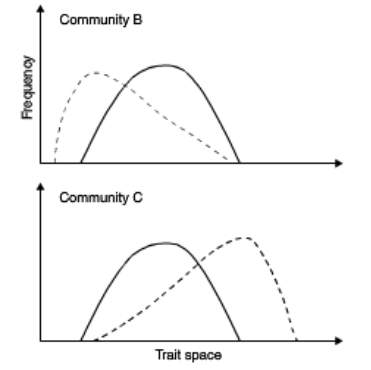
Functional homogenization
Lower variation among the trait, but the mean has shifted
10
New cards
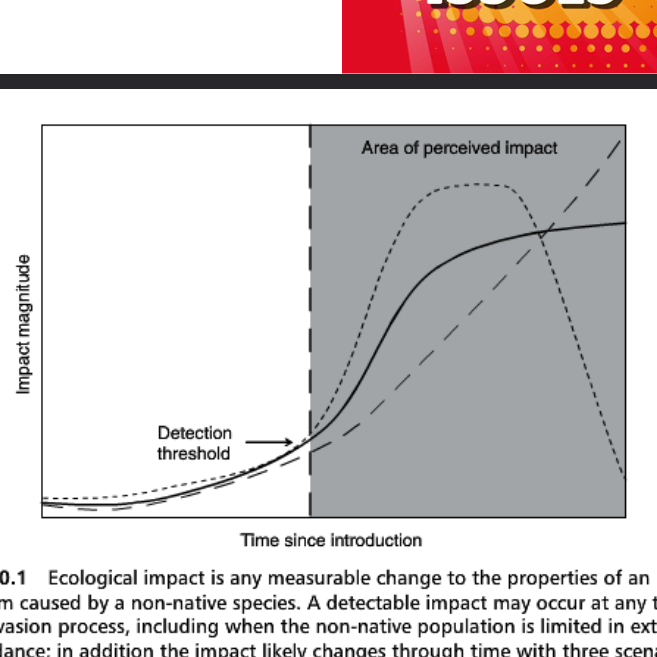
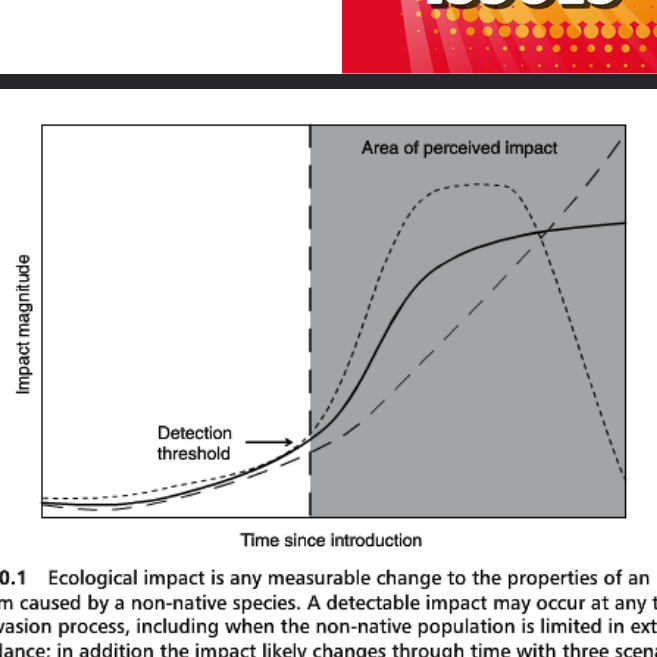
Attenuating ecological impacts
Rapid growth, flattens out, then a rapid fall (short dashed)
11
New cards
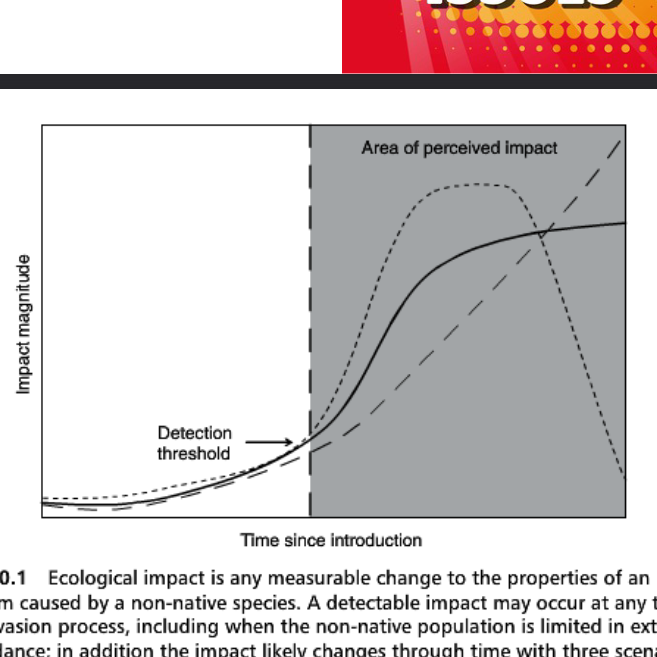
Asymptotic ecological impacts
Eventually hits a maximum amount of impact (solid)
12
New cards
Accelerating ecological impacts
Worst case scenario, impacts continuously get worse (long dashed)
13
New cards
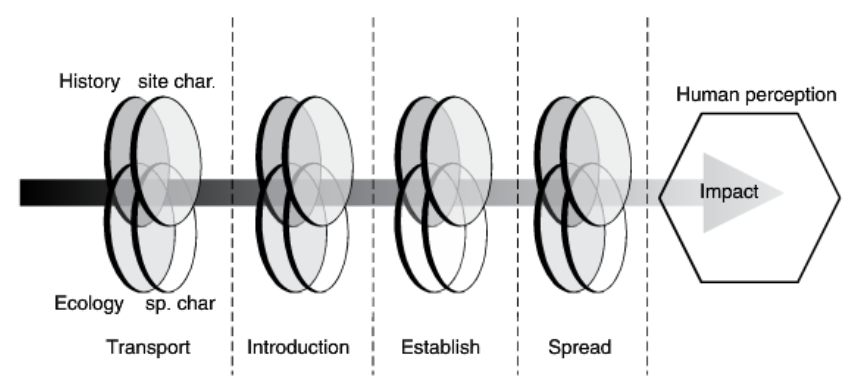
Human-related factors of impacts of invasive species
Species characteristics, environmental site characteristics, ecological interactions, and history all interact to impact assessment, but that is always viewed through a human lens of importance, which are subject to change (economics, aesthetics, culture, scientific views, and health)
14
New cards
Three philosophical arguments for preserving biodiversity
Humans get direct benefits from their presence, they do ecosystem services so we don’t have to, and the intrinsic value of simply existing
15
New cards
Unique attributes of invasive species
Can only be analyzed in specific invasions or are difficult to generalize (toxins in spines and herding hunting strategy in lionfish)
16
New cards
Universal attributes of invasive species
Easily compared across species and ecosystems (population density, body size, fitness, longevity)
17
New cards
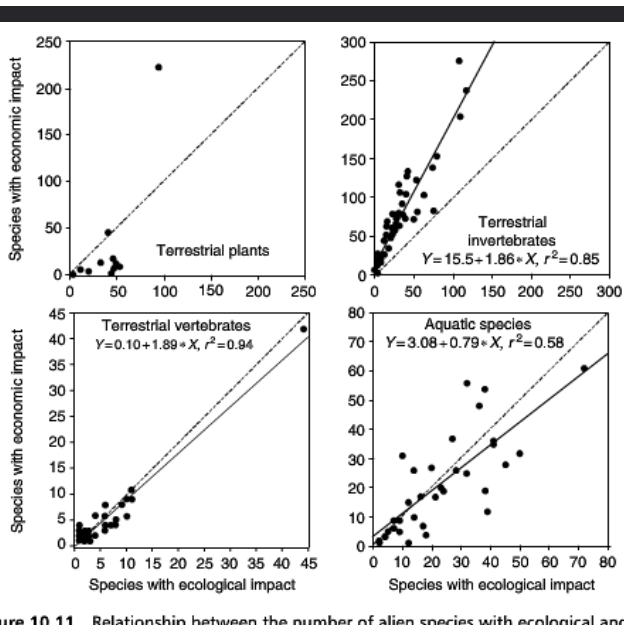
Ecological vs economic impacts between taxa
Most taxa have a relationship where the impact are pretty even. Terrestrial invertebrates, however, have a bias towards economic impact. This is because terrestrial invertebrates are agricultural pests, so their economic effects are well documented. The same cannot be said for other taxa.
18
New cards
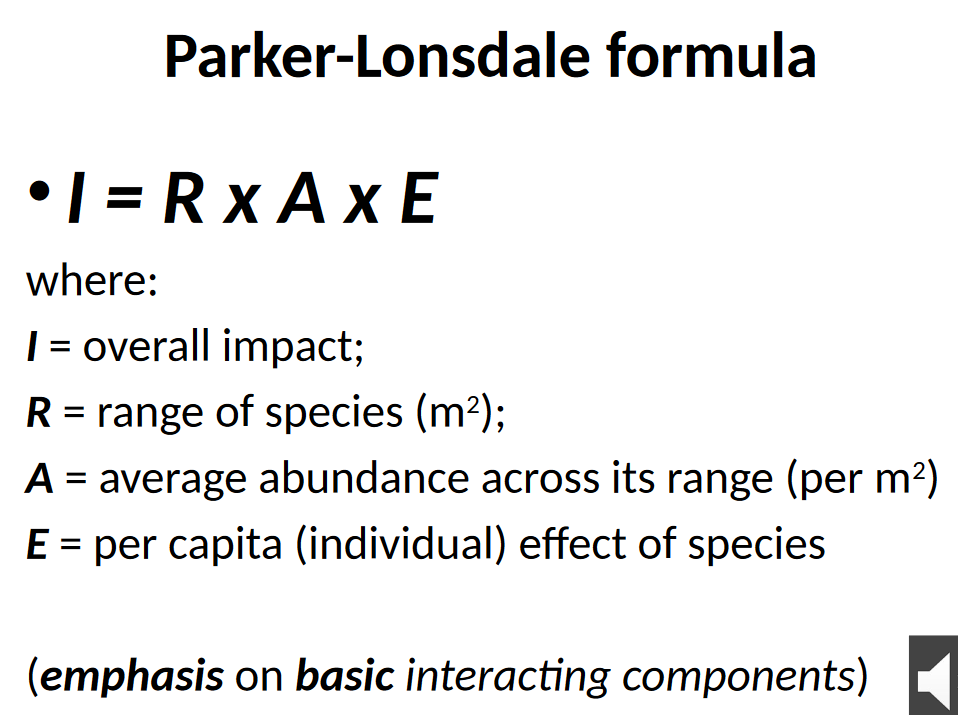
Parker-Lonsdale formula for ecological impact
I (Impact) = R (Range of species) x A (avg abundance) x E (individual damage)
Focuses on basic interacting ecological factors.
Focuses on basic interacting ecological factors.
19
New cards
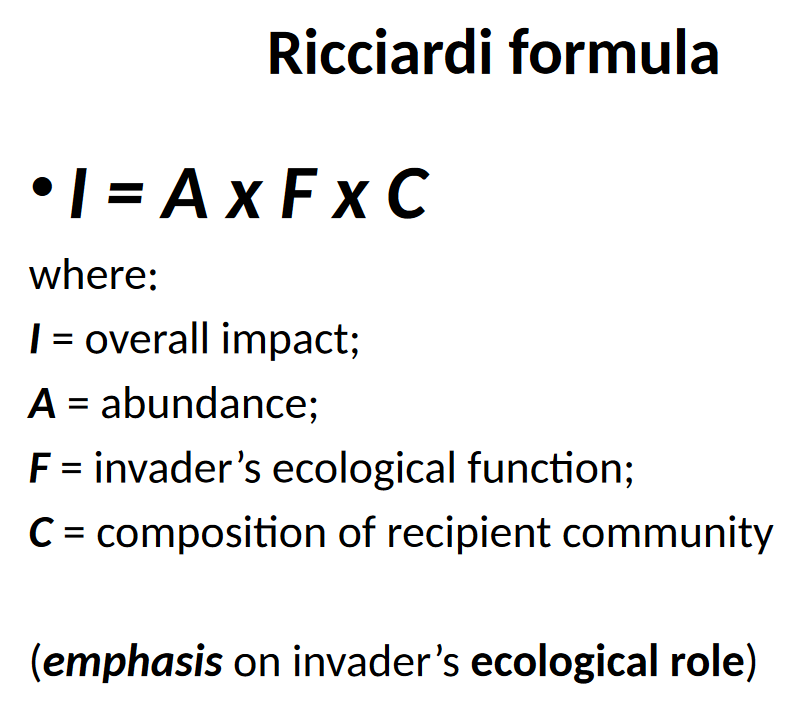
Ricciardi formula for ecological impact
I (Impact) = A (Abundance ) x F (Invader’s ecological function) x C (composition of recipient community)
Focuses on ecological role, as certain types of invaders have higher impacts (beavers are ecosystem engineers, and if the environment doesn’t have those, it makes a HUGE impact)
Focuses on ecological role, as certain types of invaders have higher impacts (beavers are ecosystem engineers, and if the environment doesn’t have those, it makes a HUGE impact)
20
New cards
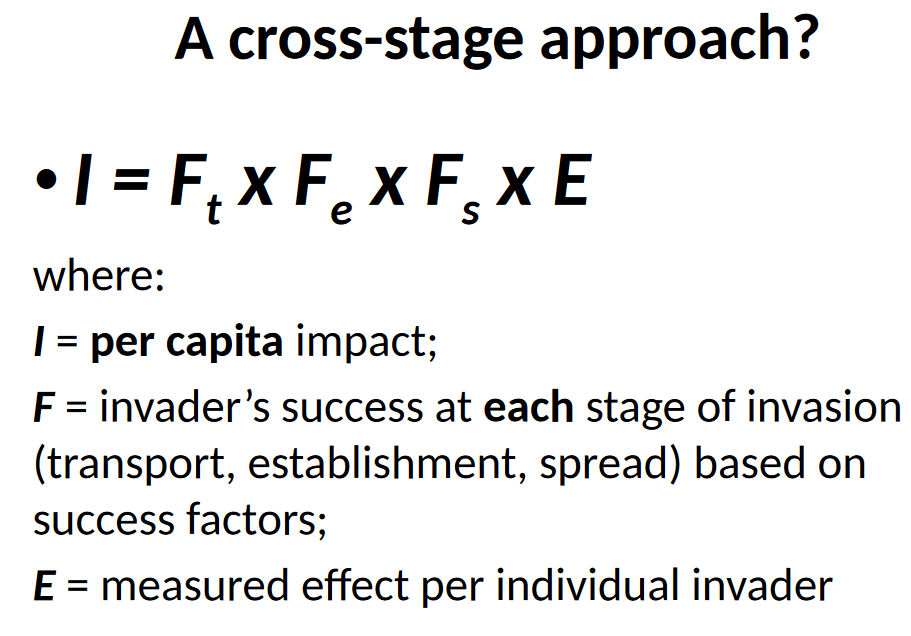
Cross-stage formula for ecological impact
I (per capita impact) = Ft x Fe x Fs (success at each invasion stage) x E (measured effect per individual)
Focuses on how the steps of invasion plays into the effect.
Focuses on how the steps of invasion plays into the effect.
21
New cards
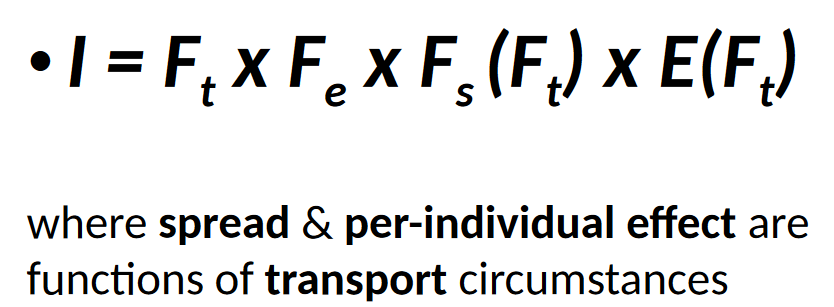
Argentine ant in measuring ecological impact
In their native range, they constantly fight other colonies, which keeps their population numbers down. When brought over to California, however, the bottle neck effect made them all genetically similar. Due to this relation, they didn’t recognize each other as enemies, they’re all part of the same super-colony, which allows them to just expand. The way they were transported effects the spread and per-individual effect, so they each must be multiplied by the transport success.
22
New cards
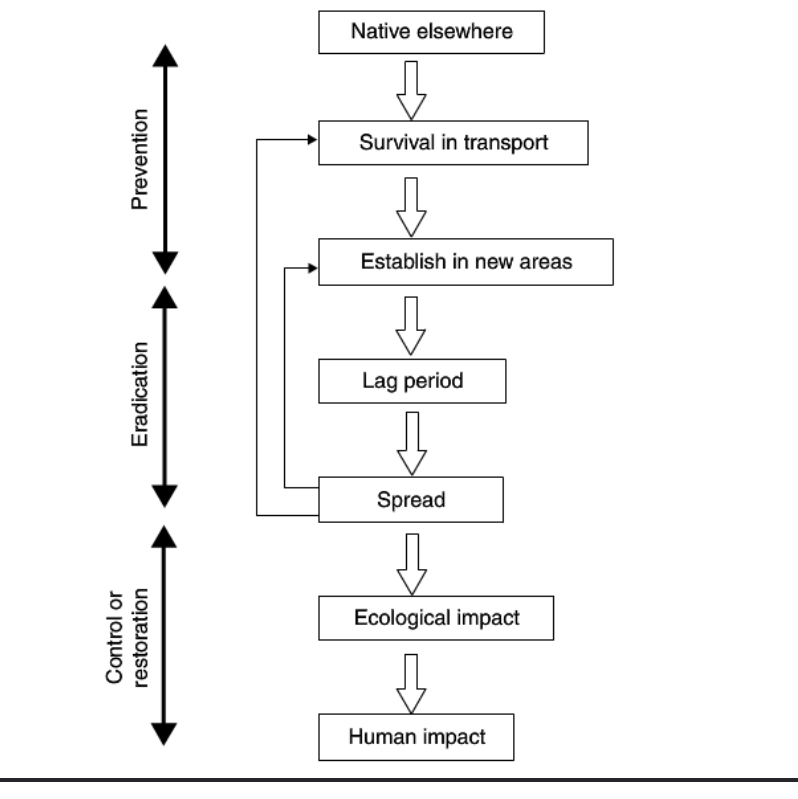
How are prevention strategies linked to different invasion stages
Before the species establishes, preventative measures are used to make sure it doesn’t get the chance to. If it establishes, you attempt to eradicate it. If it hits the point where there is ecological damage, the species is too established and must be controlled
23
New cards
How is explanation different from prediction?
Explanation is looking to the past and figuring out why something happened. Prediction is the likelihood of events occurring in the future
24
New cards
What are the key limitations of predictive models of invasion
* Statistical significance does not always mean it is a good explanation, because the variance can be very high.
* Extrapolation, its dangerous to apply models to data that was outside of the models original data range.
* Statistical shrinkage, where a model fits worse on newer data because it wasn’t designed to fit that data.
* The base rate problem, where a model predict an invasive species with a 1% failure rate, but have a lot of false alarms because most species are harmless (91% false alarms)
25
New cards
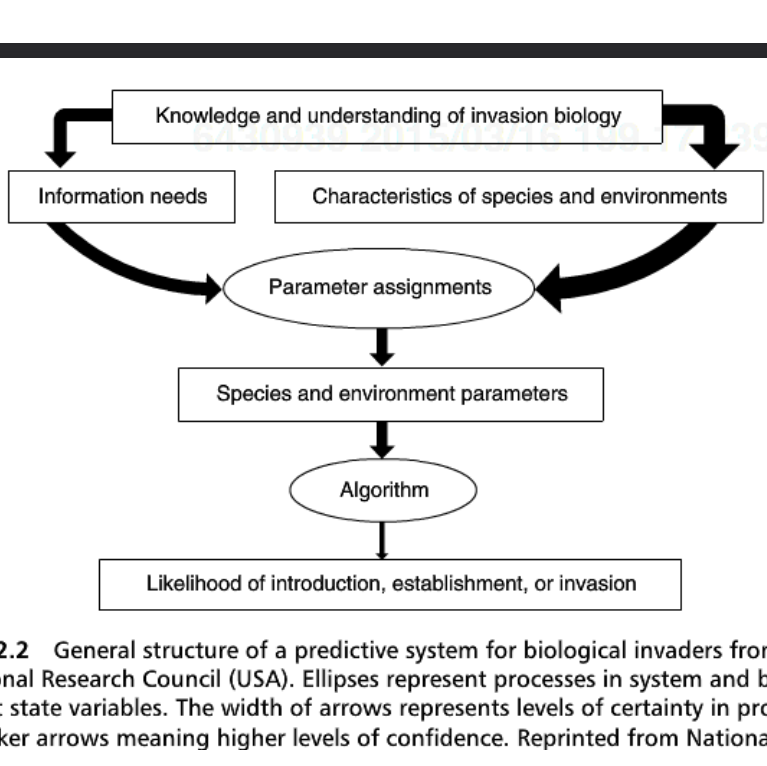
General predictive system for biological invaders
Our confidence is very high in the data that goes into making the model, but as you make the parameters, make an algorithm off of the parameters, and actually use the algorithm, the confidence plummets
26
New cards
Steps to risk analysis
Problem formation (visualized it)
Analysis (gather trait information and ecological data)
Risk characterization (find the holes in the data and build a model)
Risk management (do something about the risk)
Analysis (gather trait information and ecological data)
Risk characterization (find the holes in the data and build a model)
Risk management (do something about the risk)
27
New cards
WRA risk analysis
Questionair for exotic plants to either be accepted, rejected, or further looked at. Calibrated by using 370 established plants and ensuring they hit the correct category
Benefits - Correctly identifies a high majority of major invaders
Costs – Rejects many harmless plants, lots of incomplete data, time consuming, only 3 of the 49 questions can give you a result, identifying down to species is hard for many plants and inverts
Benefits - Correctly identifies a high majority of major invaders
Costs – Rejects many harmless plants, lots of incomplete data, time consuming, only 3 of the 49 questions can give you a result, identifying down to species is hard for many plants and inverts
28
New cards
Quantitative trait analysis
Statistically analyze common traits among invaders to determine which traits are important for invasion.
Benefits: Worked really well for pine trees and angiosperms.
Costs: Doesn’t consider confounding factors (propagule pressure, time in non-native range, traits may be important in different stages), little consistency across invasion stages w/in a taxa, across taxa, and lots of missing info.
Benefits: Worked really well for pine trees and angiosperms.
Costs: Doesn’t consider confounding factors (propagule pressure, time in non-native range, traits may be important in different stages), little consistency across invasion stages w/in a taxa, across taxa, and lots of missing info.
29
New cards
Risk map analysis
Use data from their native area to figure out their niche, then apply that niche to everywhere they aren’t to figure out the areas at rink for invasion.
Benefits - Good at giving a general risk area.
Cost – High risk areas are very dependent on which kind of data you used to make your map.
Benefits - Good at giving a general risk area.
Cost – High risk areas are very dependent on which kind of data you used to make your map.
30
New cards
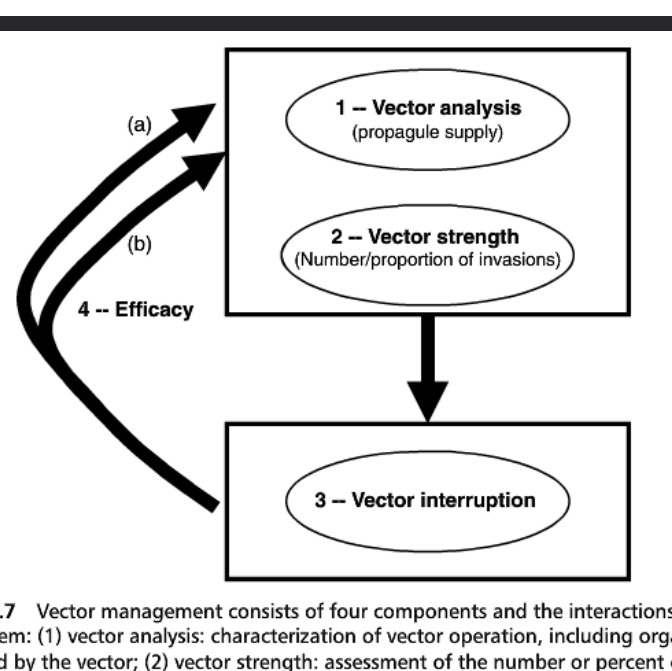
4 processes involved in vector management
Vector analysis: # of propagules vector introduced
Vector strength: # of successful invasions from vector
Vector interruption: How to stop it from being a vector
Efficiency: How well an interruption works
Vector analysis and strength are used to determine an interruption. Test this out and determine its Efficiency and repeat the cycle.
Vector strength: # of successful invasions from vector
Vector interruption: How to stop it from being a vector
Efficiency: How well an interruption works
Vector analysis and strength are used to determine an interruption. Test this out and determine its Efficiency and repeat the cycle.
31
New cards
Ballast water in vector management (vector interruption)
Ballast water takes in water when losing cargo at one port, then travels to a different port and releases the water at the new port, bringing whatever was in the water with it. To combat this, ships have started doing mid ocean replacements of 95% of their water to hopefully kill the costal organisms, and also treat their ballast water before dumping it because not all water is dumped, its time consuming and effected by bad weather, and the mid-ocean water might not be lethal for everything that you got on the coast
32
New cards
Air trade in vector managment (vector analysis)
Air trade is most popular during the months of June-August due to summer vacations. However, this time frame is also when climates are most similar across the planet, meaning environmental mismatches are at a low when travel is at a high. Makes it much more likely that invasions will occur.
33
New cards
Aquarium vectors in vector management (vector analysis)
The pet trade has been increasing worldwide, and most of these shipments are labeled very vaguely. Many different taxa are brought over to the great lakes via the pet trade, all having different important vectors. However, many have a low propagule pressure, so they are unlikely to establish. The preventative measures should focus on high propagule pressure and climactic matching.
34
New cards
Costs of self-regulation
If there is no punishment for not following regulations people wont, they might fake compliance, and most people just straight up don’t know the regulations
35
New cards
Benefits of self-regulation
Alleviates the need for top down regulation, as people will regulate themselves