Physical fieldwork
1/44
There's no tags or description
Looks like no tags are added yet.
Name | Mastery | Learn | Test | Matching | Spaced |
|---|
No study sessions yet.
45 Terms
What was our aim
To investigate downstream change on the Afon (River) Conwy (Conway)
What is discharge
the amount of water passing a given point. It is calculated by measuring the depth, width and velocity (speed) at a given point.
What is the catchment area
is the drainage basin. This is the area of land that is drained by a river and all its tributaries.
How does the long-profile of the river change with distance downstream?
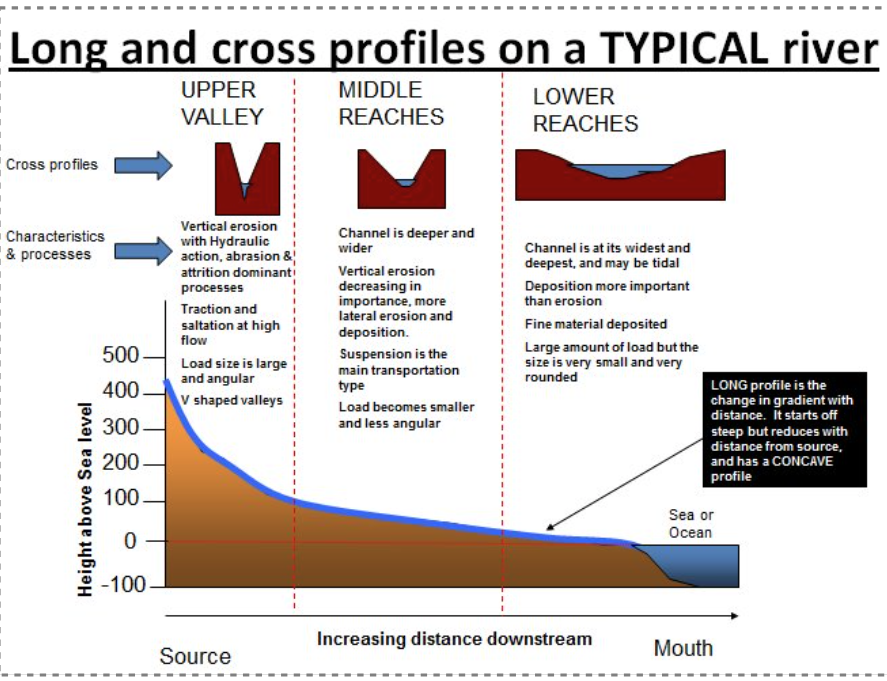
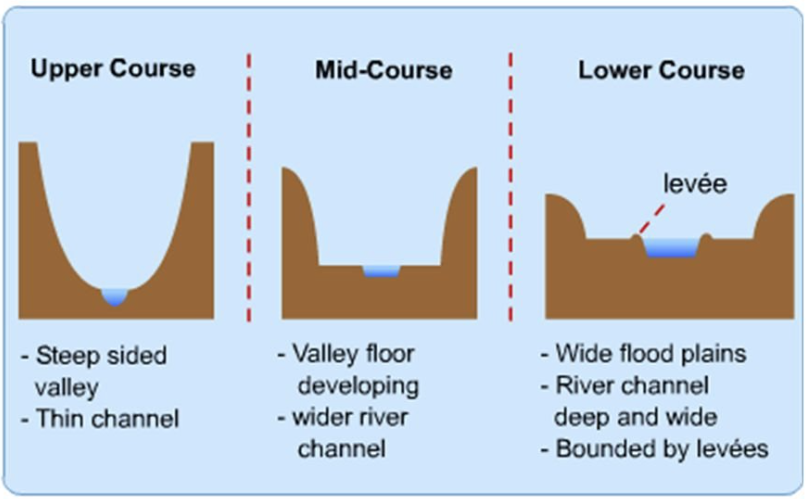
How does the cross-section of the river change with distance downstream?
What was our Hypothesis about discharge?
The discharge will increase with distance downstream on the Afon Conwy
Because mor tributaries will have joined the main channel further downstream and more land will have been drained
What was our hypothesis about velocity?
Velocity (speed) will increase with increasing cross sectional area going downstream on the Afon Conwy.
Width increases because there is more water being added by the tributaries so the channel becomes wider. Velocity increases because a smaller proportion of the river water is in contact with the bed and banks and so there is less friction
What model or theory supports the hypothesis
The Bradshaw model
What does the bradshaw model show
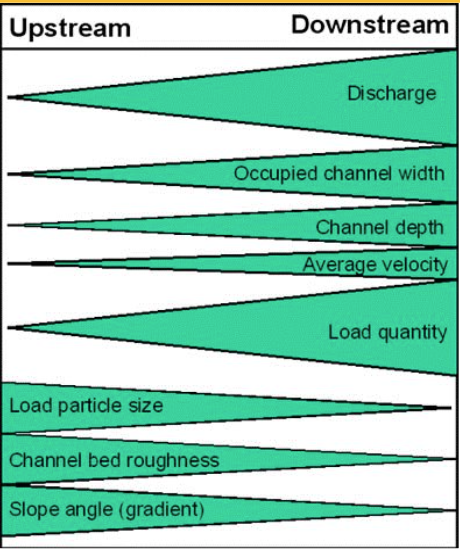
How does the Bradshaw model support our hypothesis
As the river flows downstream, tributaries feed more water into the stream system leading to a higher discharge.
This increased volume of water leads to the river having more strength and thus more power to vertically and laterally erode leading to an increase in channel depth and width.
Additionally, because the river has increased strength and thus increased erosion is occurring, load particle size is smaller downstream, as well as channel bed roughness.
Why was this a suitable place to study
→ The river was narrow as it was in the upper course which meant that we could easily cross it to measure the width
→ The river was shallow which meant that it was safe for us to stand in to measure the depth & velocity
→ Although all the 3 points were in the upper course, they clearly showed how the river changes downstream, agreeing with our hypothesis & the Bradshaw model
→ The 3 points were very accessible & close enough together that we could walk to each one
Explain 3 parts of a risk assessment
Slips and trips
Could get an injury like a broken bone, could fall into a river and get hyperthermia
Wear good footwear, don’t jump/run, watch footing
Poor weather - rain and wind
Very wet, added wind chill, hyperthermia
All have waterproof jacket + trousers, wear lots of layers of clothes and scarf and gloves
Falling in the river
drown, swept away, soaked through, cold and hyperthermia
Try not to slip, be sensible, bring a change of dry clothes
Advantages of random sampling
There is no pattern to the sample. Every point represents the whole area and has the same probability of being chosen.
How to carry out random sampling?
Measure at random locations using a random number generator.
Disadvantages of random sampling
The disadvantage of using this system does not represent the whole area and the river may not be accessible at those locations.
Advantages of systematic sampling
There is a distinct pattern to the sampling over distance or time. Measured at regular intervals over distance or time.
How to carry out systematic sampling
Measure at regular intervals over distance or time
Disadvantages of systematic sampling
Safety and accessibility are not guaranteed
Advantages of stratified sampling
There are different categories within the area that you want to sample separately. There are distinct differences across the study area. It is divided into different areas e.g. upper, middle, lower and then sample randomly or systematically within the areas. Or choose the area within the area as this would allow for safety and accessibility.
How to carry out stratified sampling
Divide into areas and take a proportional number of measurements in each area. Sample randomly or systematically within the area.
Disadvantages of stratified sampling
It would not be possible to safely measure the width and depth of the river in the lower course as it would be too deep and fast flowing. However, the advantage is that all sections of the river will have will have been sampled. We could not sample the upper, middle and lower course as it would not be safe to sample where the river is wide and deep.
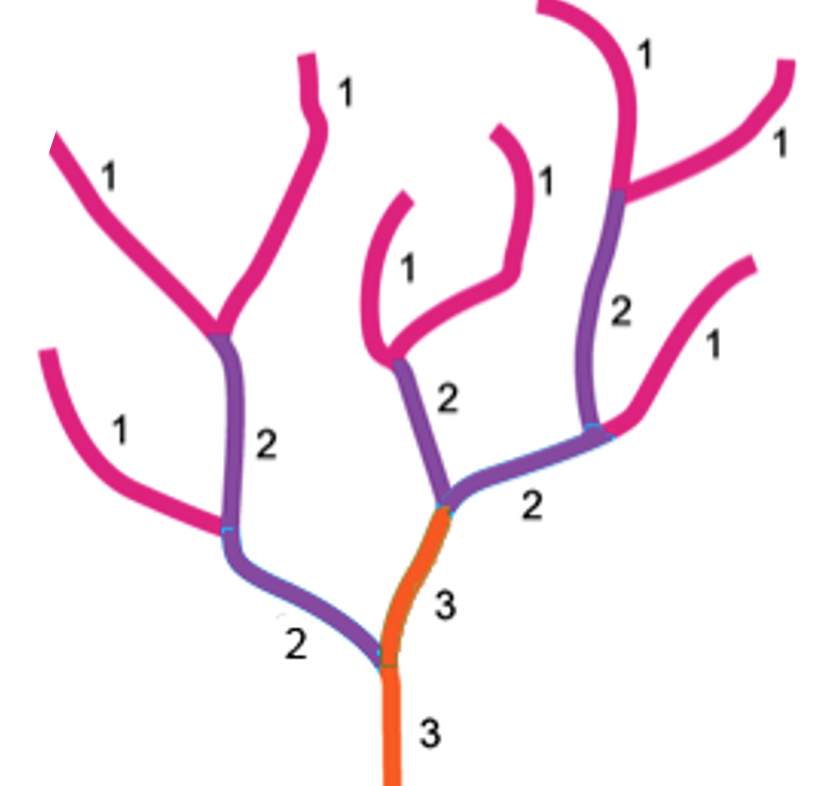
What is Strahler stream order
A types of stratified sampling
1st order streams– no tributaries have joined the stream. It is very close to the source
2nd order streams – 2 x 1st order streams have joined together
3rd order stream - 2 x 2nd order streams have joined together
Measurement of width, method, justification, limitations and improvements
The river was measured from the left bank to right bank using a tape measure along the surface of the water. Three locations were chosen using a stratified sampling strategy.
This data would show if the width of the river increased with distance downstream as this would help to answer the hypothesis and prove the Bradshaw model.
It was difficult to keep the tape measure tight and the flow of the water stretched the tape measure.
This could have been made more accurate by having more people in the river
Measurement of depth, method, justification, limitations and improvements
The depth was taken at 5 locations across the width of the river by dividing the width by 4. The meter ruler was placed upright at these locations
This data would show if the depth of the river increased with distance downstream as this would help to answer the hypothesis and prove the Bradshaw model.
The large angular boulders that are found in the upper course occasionally blocked the river and cut the channel in two.
Measurements could have been taken either of the boulders and averaged
Measurement of velocity, method, justification, limitations and improvements
A hydroprop was used to measure the flow at the same three locations as the depth. It was placed just below the surface with the propeller facing directly upstream.
This was measured as the speed of the flow should increase slightly with distance downstream (as the river becomes more efficient and this could also be used to calculate the discharge at the three locations by adding to the width and depth
Sometimes the depth of the river was not deep enough for the hydroprop to work and as we were in shallow sections of the river there was a lack of flow.
Explain the suitability of one key question or hypothesis that you chose to help answer your fieldwork question for investigation. (4 marks)
The aim was to investigate downstream changes along the Afon Conwy. To answer this we investigated how the cross-sectional area of the river changed with distance downstream. This was a suitable question as the Bradshaw model states that width and depth should increase with distance along the river. We measured these and then calculated the cross-sectional area.
How did you present your data? What are the advantages and disadvantages of your choice of data presentation method.
The width and depth can be displayed by drawing the cross-sectional area from one bank to the other. This is a suitable technique as it clearly shows what the cross section of the river channel, banks and bed looked like. It is effective as it allows for easy comparison between different sites found in the upper course of the river.
One disadvantage of this technique is that it is hard to construct accurately unless using a computer and if the scales used are not the same for each site then it is difficult to compare.
On balance this technique was an effective choice as it was very clear that the width, depth and cross-sectional area had all increased with distance downstream and this is in agreement with the Bradshaw model.
Site 1 data
| Site 1 |
Average Width (m) | 0.53 |
Average Depth (m) | 0.022 |
Average CSA (Cross-Sectional Area) m2 | 0. |
Average Velocity (m/s) | 0.17 |
Average Discharge m3/s Check students have these | 0.002 |
Site 2 data
| Site 2 |
Average Width (m) | 1.85 |
Average Depth (m) | 0.114 |
Average CSA (Cross-Sectional Area) m2 | 0.44 |
Average Velocity (m/s) | 0.532 |
Average Discharge m3/s Check students have these | 0.112 |
Site 3 data
| Site 3 |
Average Width (m) | 2.5 |
Average Depth (m) | 0.288 |
Average CSA (Cross-Sectional Area) m2 | 2.23 |
Average Velocity (m/s) | 0.414 |
Average Discharge m3/s Check students have these | 0.298 |
Analysis of river width
Width increases with distance downstream as predicted in Bradshaws model (secondary data).This is due to lateral erosion eg abrasion increasing as the river flows downstream due to the increased energy from the additional water that joins the main channel from tributaries
What is river width measured in
M
What type of graph is used to present river width data
Kite diagram
What is river depth measured in
M or cm
Analysis of river depth data
Depth also increases with distance downstream as predicted in Bradshaw’s model (secondary data).This is due to vertical erosion eg abrasion increasing as the river flows downstream due to the increased energy from the additional water that joins the main channel from tributaries
What type of graph would you use to present river depth
bar chart
what is velocity measured in
m/sec
analysis of velocity data
Velocity SHOULD increase with distance downstream as predicted in Bradshaws model (secondary data).This is due to less energy being used by friction due to the reduced sediment size (due to attrition) as a river flows downstream. The velocity also increases due to the increased volume of water due to the addition of tributaries. Our data did not show a clear pattern but this could have been due to human error
What type of graph could be used to show velocity
Bar chart
How do you calculate cross-sectional area (CSA)
river width x depth
what is CSA measured in
m²
CSA data analysis
CSA increases with distance downstream as predicted in Bradshaw’s model (secondary data).This is due to lateral and vertical erosion increasing as the river flows downstream due to the increased energy from the additional water that joins the main channel from tributaries and the reduction in friction as sediment gets smaller downstream.
How to calculate discharge
velocity x CSA
discharge data analysis
Discharge increases with distance downstream as predicted in Bradshaw’s model (secondary data).This is due the increased energy from the additional water that joins the main channel from tributaries and the reduction in friction as sediment gets smaller downstream.
Does our data fit the bradshaw model?
Width, depth and velocity should all increase with distance downstream in line with the Bradshaw model. The river Conway where we collected our data has not experienced any human interference or management and therefore the geomorphic processes on the river are able to operate in its most natural form and this is why our results are fully in line with the geographical theory