CFA Level 1: Portfolio Management
 Call Kai
 Learn
Learn Practice Test
 Spaced Repetition
 Match
Match Flashcards
 Knowt Play
1/22

There's no tags or description
Looks like no tags are added yet.
Name | Mastery | Learn | Test | Matching | Spaced | Call with Kai | Chat |
|---|
No analytics yet
Send a link to your students to track their progress
23 Terms
Defined Contribution (L3)
A pension plan in which employee bears investment risk, employer does not promise benefits
Efficient Frontier (L1)
A graph that plots the optimal portfolios offering the highest expected return for a specific level of risk, or the lowest risk for a given level of return.
Efficient Portfolio: Bottom-Left (L1)
Conservative portfolios (low risk, low return, mostly bonds, just above the GMVP).
Efficient Portfolio: Below Line (L1)
Sub-optimal and inefficient portfolio
The portfolio is taking on too much risk for too little return. This usually happens because the assets are poorly diversified.
Efficient Portfolio: Top-Right (L1)
Aggressive portfolios (high risk, high return, mostly stocks).
Efficient Portfolio: Above the Line (L1)
Impossible Portfolios & Unattainable
Given the current market assets, it is impossible to achieve this high of a return with so little risk.
Efficient Frontier: On the Line (L1)
Efficient portfolios, optimal, and perfectly diverse.
You cannot get a higher return without taking on more risk, and you cannot lower risk without dropping your return.
Defined Benefit (L3)
A pension plan in which the employer bears investment risk, and the employee is promised benefits.
Portfolio Beta (L2)
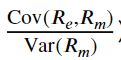
The value weighted average if the portfolio assets beta. It shows the risk level and price swings of your total investments.
Global Minimum Variance Portfolio (GMVP) (L1)
The absolute leftmost tip of the curve.
This is the single portfolio on the frontier that carries the lowest possible risk, regardless of return.
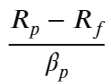
Treynor Ratio (L2)
Measures excess return per unit of systemic risk.
Rp = risk of portfolio
Rf = risk free rate
Beta(p) = Beta (market risk) of portfolio
Sharpe Ratio (L2)
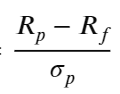
Measures excess returns per unit of total risk. It is the slope of the capital allocation line (CAL).
Rp = risk of portfolio
Rf = risk free rate
sigma(p) = standard deviation (total risk) of portfolio
Total Risk (L2)
The sum of Market Risk and Unsystematic Risk
Systematic Risk (L2)
Also known as market risk, it measures by covariance of returns on the market portfolio (beta). Risk that affects the entire market or economy and cannot be avoided by adding different types of investments.
Unsystematic Risk (L2)
Also known as firm-specific risk, or diversifiable risk, specified to a single company or industry that can be eliminated by spreading investments across different sectors.
Capital Allocation Market Line (L2)
A model that calculates the required return on an investment based on its systematic risk.
Beta(i) = beta of asset
Rf = risk free rate of market
Rm = Expected return of market

Risk Premium (L2)
The difference between the expected return of market and risk free rate of market.
Capital Allocation Line (CAL) (L2)
A graph showing all possible combinations of a risk-free asset and one specific risky portfolio.
Security Market Line (SML) (L2)
The visual representation of the CAPM formula, showing the expected return of individual assets.
Investment Constraints (L4)
Liquidity (Need money, goal, & purpose)
Time Horizon (Short term → long term)
Tax Situation (income vs capital gains)
Legal & Regulatory
Unique Circumstances (ESG)
ESG Considerations (L4)
Approach to ESG investments:
Negative Screening (Exclusions)
Positive Screening (Positive ESG practices)
Thematic Screening (Sectors & Companies)
Impact Investments (Investments used to promote positive ESG)
Engagement/Active Ownership (Share owenership to promote & improve ESG practices)
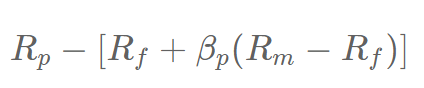
Jensen’s Alpha (L2)
A tool that tells you if a fund manager beat the market after adjusting for the risk they took.
M² Alpha (L2)
It shows what a portfolio would return if it were leveraged or deleveraged with risk-free assets to exactly match the total risk (standard deviation) of the market benchmark.
