Chapters 8-12 Ratios and Meanings

0.0(0)
studied byStudied by 0 people
0.0(0)
full-widthCall Kai
learnLearn
examPractice Test
spaced repetitionSpaced Repetition
heart puzzleMatch
flashcardsFlashcards
GameKnowt Play
Card Sorting

1/23

encourage image

There's no tags or description

Looks like no tags are added yet.

Study Analytics
Name
Mastery
Learn
Test
Matching
Spaced

No study sessions yet.

24 Terms

1
New cards

Liquidity

Having sufficient cash (or other assets convertible to cash in a relatively short time) to pay currently maturing debts 

  • Lack of liquidity can result in financial difficulties or even bankruptcy

2
New cards

Liquidity Management

  • Management can influence the ratios that measure liquidity to some extent 

  • Ex: 

    1. Delay the shipment and billing of certain inventory parts to receive them in early January rather than late December, reducing inventory and accounts payable at year-end 

    2. Make additional purchases in late December, increasing inventory and accounts payable at year-end 

3
New cards

Working Capital

The difference between current assets and current liabilities 

  • After paying our current obligations, how much in current assets will we have to work with? 

  • A large positive working capital is an indicator of liquidity (whether a company will be able to pay its current obligations on time) 

  • Not the best measure of liquidity when comparing one company with another, because it doesn’t control for the relative size of each company 

<p><span style="background-color: inherit; line-height: 20.7px; color: windowtext;"><span>The difference between current assets and current liabilities</span></span><span style="line-height: 20.7px; color: windowtext;"><span>&nbsp;</span></span></p><ul><li><p class="Paragraph SCXO267130696 BCX0" style="text-align: left;"><span style="background-color: inherit; line-height: 20.7px; color: windowtext;"><span>After paying our current obligations, how much in current assets will we have to work with?</span></span><span style="line-height: 20.7px; color: windowtext;"><span>&nbsp;</span></span></p></li><li><p class="Paragraph SCXO267130696 BCX0" style="text-align: left;"><span style="background-color: inherit; line-height: 20.7px; color: windowtext;"><span>A large positive working capital is an indicator of liquidity (whether a company will be able to pay its current obligations on time)</span></span><span style="line-height: 20.7px; color: windowtext;"><span>&nbsp;</span></span></p></li><li><p class="Paragraph SCXO267130696 BCX0" style="text-align: left;"><span style="background-color: inherit; line-height: 20.7px; color: windowtext;"><span>Not the best measure of liquidity when comparing one company with another, because it doesn’t control for the relative size of each company</span></span><span style="line-height: 20.7px; color: windowtext;"><span>&nbsp;</span></span></p></li></ul><p></p>
4
New cards

Current Ratio

Current assets divided by current liabilities; measures the availability of current assets to pay current liabilities 

  • A ratio greater than 1: indicates there are more current assets then current liabilities 

  • The higher the current ratio, the greater the company's liquidity and less risk

<p><span style="background-color: inherit; line-height: 20.7px; color: windowtext;"><span>Current assets divided by current liabilities; measures the availability of current assets to pay current liabilities</span></span><span style="line-height: 20.7px; color: windowtext;"><span>&nbsp;</span></span></p><ul><li><p class="Paragraph SCXO172903921 BCX0" style="text-align: left;"><span style="background-color: inherit; line-height: 20.7px; color: windowtext;"><span>A ratio greater than 1: indicates there are more current assets then current liabilities</span></span><span style="line-height: 20.7px; color: windowtext;"><span>&nbsp;</span></span></p></li><li><p class="Paragraph SCXO172903921 BCX0" style="text-align: left;"><span style="background-color: inherit; line-height: 20.7px; color: windowtext;"><span>The higher the current ratio, the greater the company's liquidity</span></span><span style="line-height: 20.7px; color: windowtext;"><span>&nbsp;and less risk</span></span></p></li></ul><p></p>
5
New cards

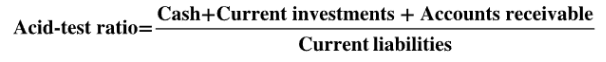
Acid-Test Ratio (Quick Ratio)

Cash, current investment, and accounts receivable divided by current liabilities; measures the availability of liquid current assets to pay current liabilities 

  • Because the numerator contains only a portion of the current assets used in the current ratio, the acid-test ratio will usually be smaller than the current ratio 

  • Provides a better indication of a company's liquidity than the current ratio 

A more conservative measure of a company's ability to pay current liabilities 

  • Its more conservative because it eliminates current assets such as inventories and prepaid expenses that are less readily convertible into cash, the acid-test ratio often provides a better indication of a company's liquidity than does the current ratio

<p><span style="background-color: inherit; line-height: 20.7px; color: windowtext;"><span>Cash, current investment, and accounts receivable divided by current liabilities; measures the availability of liquid current assets to pay current liabilities</span></span><span style="line-height: 20.7px; color: windowtext;"><span>&nbsp;</span></span></p><ul><li><p class="Paragraph SCXO92972805 BCX0" style="text-align: left;"><span style="background-color: inherit; line-height: 20.7px; color: windowtext;"><span>Because the numerator contains only a portion of the current assets used in the current ratio, the acid-test ratio will usually be smaller than the current ratio</span></span><span style="line-height: 20.7px; color: windowtext;"><span>&nbsp;</span></span></p></li><li><p class="Paragraph SCXO92972805 BCX0" style="text-align: left;"><span style="background-color: inherit; line-height: 20.7px; color: windowtext;"><em><u><span>Provides a better indication of a company's liquidity than the current ratio</span></u></em></span><span style="line-height: 20.7px; color: windowtext;"><span>&nbsp;</span></span></p></li></ul><p class="Paragraph SCXO92972805 BCX0" style="text-align: left;"></p><p><span style="background-color: inherit; line-height: 20.7px; color: windowtext;"><span>A more conservative measure of a company's ability to pay current liabilities</span></span><span style="line-height: 20.7px; color: windowtext;"><span>&nbsp;</span></span></p><ul><li><p class="Paragraph SCXO253780999 BCX0" style="text-align: left;"><span style="background-color: inherit; line-height: 20.7px; color: windowtext;"><span>Its more conservative because it eliminates current assets such as inventories and prepaid expenses that are less readily convertible into cash, the acid-test ratio often provides a better indication of a company's liquidity than does the current ratio</span></span></p></li></ul><p></p>
6
New cards

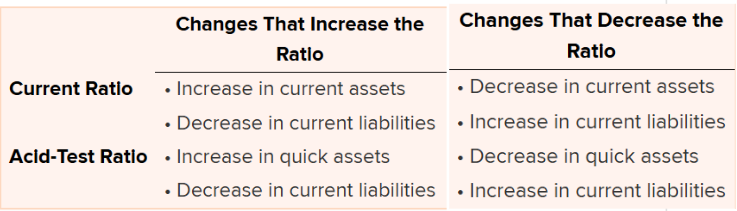
Changes that affect the current and acid-test ratios

knowt flashcard image
7
New cards

Be able to find a second or third monthly interest payment. 

first calculate the first month's interest using the original principal, then subtract that interest from your total payment (or the principal for interest-only loans) to get the new principal for the second month, and then recalculate interest on that new, slightly lower principal for the second month

8
New cards

solvency

a company’s ability to pay its current and long-term liabilities

long term

9
New cards

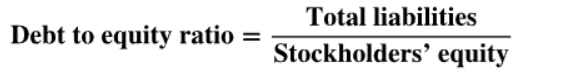
debt-to-equity-ratio

Total liabilities divided by stockholders' equity; measures a company's risk 

  • The higher the ratio the higher the risk of bankruptcy 

  • Best measures financial leverage 

Indicates the risk of bankruptcy 

  • Other things being equal, the higher the debt to equity ratio, the higher the risk of bankruptcy 

  • More debt increases the risk of bankruptcy, but it also increases the potential returns investors can enjoy 

<p><span style="background-color: inherit; line-height: 20.7px; color: windowtext;"><span>Total liabilities divided by stockholders' equity; </span><strong><span>measures a company's risk</span></strong></span><span style="line-height: 20.7px; color: windowtext;"><span>&nbsp;</span></span></p><ul><li><p class="Paragraph SCXO219087999 BCX0" style="text-align: left;"><span style="background-color: inherit; line-height: 20.7px; color: windowtext;"><span>The higher the ratio the higher the risk of bankruptcy</span></span><span style="line-height: 20.7px; color: windowtext;"><span>&nbsp;</span></span></p></li><li><p class="Paragraph SCXO219087999 BCX0" style="text-align: left;"><span style="background-color: inherit; line-height: 20.7px; color: windowtext;"><span>Best measures financial leverage</span></span><span style="line-height: 20.7px; color: windowtext;"><span>&nbsp;</span></span></p></li></ul><p class="Paragraph SCXO219087999 BCX0" style="text-align: left;"></p><p><span style="background-color: inherit; line-height: 20.7px; color: windowtext;"><span>Indicates the risk of bankruptcy</span></span><span style="line-height: 20.7px; color: windowtext;"><span>&nbsp;</span></span></p><ul><li><p class="Paragraph SCXO215074005 BCX0" style="text-align: left;"><span style="background-color: inherit; line-height: 20.7px; color: windowtext;"><span>Other things being equal, the higher the debt to equity ratio, the higher the risk of bankruptcy</span></span><span style="line-height: 20.7px; color: windowtext;"><span>&nbsp;</span></span></p></li><li><p class="Paragraph SCXO215074005 BCX0" style="text-align: left;"><span style="background-color: inherit; line-height: 20.7px; color: windowtext;"><span>More debt increases the risk of bankruptcy, but it also increases the potential returns investors can enjoy</span></span><span style="line-height: 20.7px; color: windowtext;"><span>&nbsp;</span></span></p></li></ul><p></p>
10
New cards

Return on Assets

Net income/average total assets 

  • Measures the amount of net income generated for each dollar invested in assets 

<p><span style="background-color: inherit; line-height: 20.7px; color: windowtext;"><span>Net income/average total assets</span></span><span style="line-height: 20.7px; color: windowtext;"><span>&nbsp;</span></span></p><ul><li><p class="Paragraph SCXO130471958 BCX0" style="text-align: left;"><span style="background-color: inherit; line-height: 20.7px; color: windowtext;"><strong><span>Measures the amount of net income generated for each dollar invested in assets</span></strong></span><span style="line-height: 20.7px; color: windowtext;"><span>&nbsp;</span></span></p></li></ul><p></p>
11
New cards

times interest earned ratio

Ratio that compares interest expense with income available to pay those charges 

  • Provides indication to creditors of how many "times" greater earnings are the interest expense 

  • The higher a company's earnings relative to its interest expense, the more likely it will be able to make current and future interest payments 

• The times interest earned ratio measures a company’s ability to meet interest payments as they become due. 
• A higher ratio indicates a greater ability of a company to meet its interest obligation. 

Compares interest payments with a company's income available to pay those charges 

Classified as a solvency ratio rather than a liquidity ratio 

  • A company wants a higher net income before interest expense and income tax expense in relation to the amount it needs for interest expense alone 

<p><span style="background-color: inherit; line-height: 20.7px; color: windowtext;"><strong><span>Ratio that compares interest expense with income available to pay those charges</span></strong></span><span style="line-height: 20.7px; color: windowtext;"><span>&nbsp;</span></span></p><ul><li><p class="Paragraph SCXO77785048 BCX0" style="text-align: left;"><span style="background-color: inherit; line-height: 20.7px; color: windowtext;"><strong><span>Provides indication to creditors of how many "times" greater earnings are the interest expense</span></strong></span><span style="line-height: 20.7px; color: windowtext;"><span>&nbsp;</span></span></p></li><li><p class="Paragraph SCXO77785048 BCX0" style="text-align: left;"><span style="background-color: inherit; line-height: 20.7px; color: windowtext;"><span>The higher a company's earnings relative to its interest expense, the more likely it will be able to make current and future interest payments</span></span><span style="line-height: 20.7px; color: windowtext;"><span>&nbsp;</span></span></p></li></ul><p class="Paragraph SCXO77785048 BCX0" style="text-align: left;"></p><p class="Paragraph SCXO77785048 BCX0" style="text-align: left;"><span style="background-color: inherit; line-height: 20.7px; color: windowtext;"><span>• The times interest earned ratio measures a company’s ability to meet interest payments as they become due.</span></span><span style="line-height: 20.7px; color: windowtext;"><span>&nbsp;<br></span></span><span style="background-color: inherit; line-height: 20.7px; color: windowtext;"><span>• A higher ratio indicates a greater ability of a company to meet its interest obligation.</span></span><span style="line-height: 20.7px; color: windowtext;"><span>&nbsp;</span></span></p><p class="Paragraph SCXO77785048 BCX0" style="text-align: left;"></p><p class="Paragraph SCXO77785048 BCX0" style="text-align: left;"><span style="background-color: inherit; line-height: 20.7px; color: windowtext;"><span>Compares interest payments with a company's income available to pay those charges</span></span><span style="line-height: 20.7px; color: windowtext;"><span>&nbsp;</span></span></p><p class="Paragraph SCXO165918323 BCX0" style="text-align: left;"><span style="background-color: inherit; line-height: 20.7px; color: windowtext;"><span>Classified as a solvency ratio rather than a liquidity ratio</span></span><span style="line-height: 20.7px; color: windowtext;"><span>&nbsp;</span></span></p><ul><li><p class="Paragraph SCXO165918323 BCX0" style="text-align: left;"><span style="background-color: inherit; line-height: 20.7px; color: windowtext;"><span>A company wants a higher net income before interest expense and income tax expense in relation to the amount it needs for interest expense alone</span></span><span style="line-height: 20.7px; color: windowtext;"><span>&nbsp;</span></span></p></li></ul><p></p>
12
New cards

Liquidity Ratios

Liquidity ratios focus on the company's ability to pay current liabilities

short term

  • Receivables turnover ratio

  • average collection period

  • inventory turnover ratio

  • average days in inventory

  • current ratio

  • acid test ratio

13
New cards

Solvency Ratios

solvency ratios include long-term liabilities

  • Debt to equity ratio

  • Times interest earned ratio

14
New cards

Receivables Turnover Ratio

Measures how many times receivables are collected during the year 

  • A high turnover ratio is positive 

15
New cards

Average Turnover Ratio

Measures the days it takes to convert receivables into cash 

  • The short the period the better 

16
New cards

Inventory Turnover Ratio

Measures how many times average inventory is sold during the year 

  • A high ratio indicates that inventory is selling quickly 

  • An extremely high ratio might show lost sales due to inventory shortages 

17
New cards

Average Days in Inventory

Measures the average number of days it takes to sell its entire inventory during the year 

  • Companies try to minimize the number of days they hold inventory 

18
New cards

Profitability Ratios

Profitability ratios measure the earnings or operating effectiveness of a company over a period of time, such as a year 

Investors view profitability as the number one measure of company success 

  • Gross Profit

  • Return on Assets

  • Profit Margin

  • Asset Turnover

  • Return on Equity

  • Earnings per share

  • Price-earnings ratio

19
New cards

Gross Profit Ratio

Indicates the portion of each dollar of sales above its cost of goods sold 

  • Gross profit ratios vary by industry 

20
New cards

Return on Assets

Measures the income the company earns on each dollar invested in assets 

  • A higher percentage would indicate a higher amount earned compared to the assets that it owns 

21
New cards

Profit Margin

Measures the income earned on each dollar of sales 

  • A higher profit margin indicates a higher amount actually earned (after expenses are accounted for) compared to its total revenues 

22
New cards

Asset Turnover

Measures sales volume in relation to the investment in assets 

  • A company wants higher revenues compared to each dollar invested in assets 

23
New cards

Return on Equity

Measures the income earned for each dollar in stockholders' equity 

  • A higher amount earned compared to the investment made by the owners of the company is desirable 

24
New cards

Price-Earnings Ratio

Compares a company's share price with its earnings per share 

  • A higher PE ratio shows that investors have a higher expectation of earnings growth