Stats Unit 1
1/123
There's no tags or description
Looks like no tags are added yet.
Name | Mastery | Learn | Test | Matching | Spaced | Call with Kai |
|---|
No analytics yet
Send a link to your students to track their progress
124 Terms
What is data?
set of measurements comprised of variables and cases
What are case (units)?
refer to what we obtain info about
What are variables?
characteristics of each case
What are categorical (qualitative) variables?
variables that divide cases into categories/groups
What are quantitative (numerical) variables?
variables that measure a numerical (unit) value for each case
What are exploratory variables?
variables that impact/explain another variable
What are response variables?
variables that change in response to the explanatory variable
What are descriptive statistics?
statistics used to make sense of data to visualize and summarize it
What can we use to visualize categorical data?
frequency and relative frequency tables, proportions
What are frequency tables?
method that displays categorical data by showing the number of cases that fall into each group
What are proportions?
measurement that describes the amount or percentage of data in a group
How is a proportion calculated?
# in category/sample size
What are relative frequency tables?
similar to frequency tables, but display the proportion rather than a number
What can we use to visualize quantitative data?
dot plots and histograms
What are dot plots?
graph in which the number of dots above each measurement represents the quantity of cases for that value
What is important about dot plots?
they’re more useful for smaller sets of data
What are histograms?
graph in which the height of each bar represent the number of cases within a range of values
What is important about histograms?
NOT the same as bar graphs, and better for large data sets
What does the shape of a graph give info about?
center, spread, and type of data
What does the term skewed refer to?
shorter end of a graph
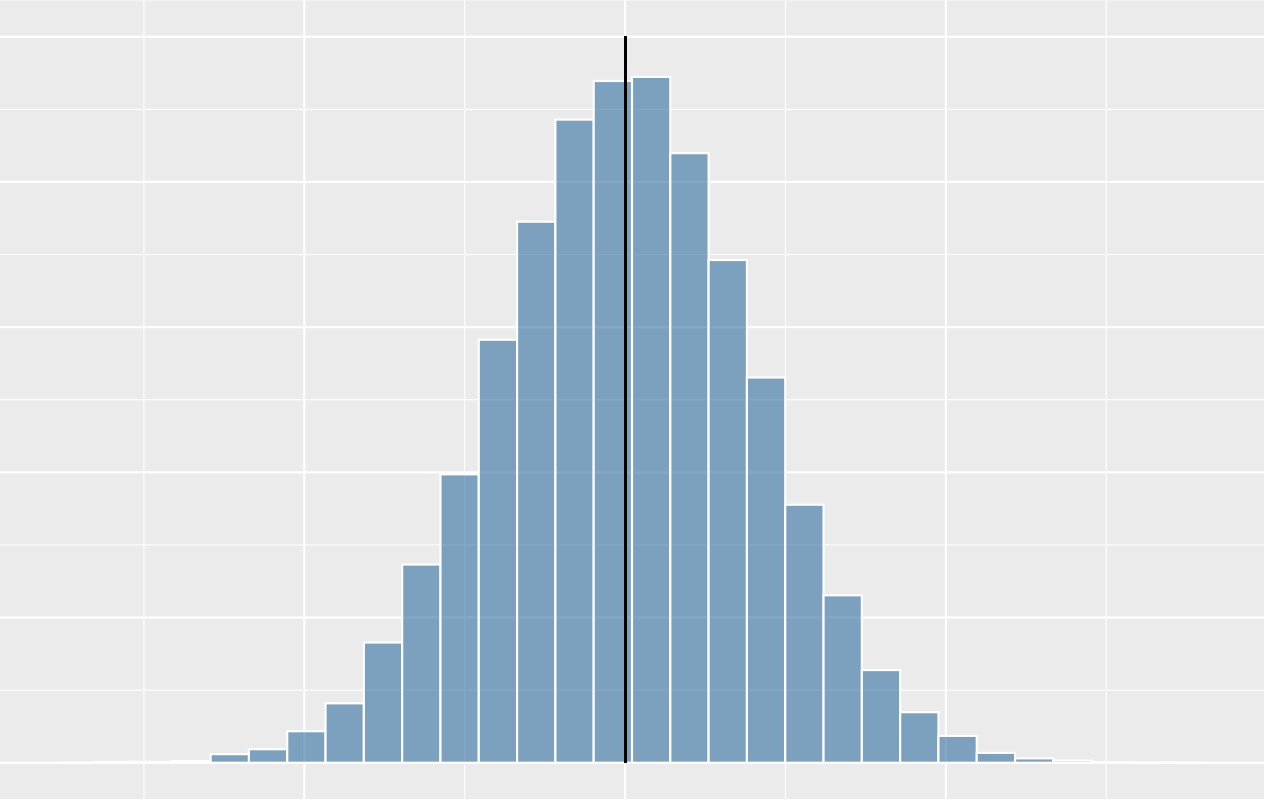
What shape of distribution is this?
bell curved, symmetric, unimodal
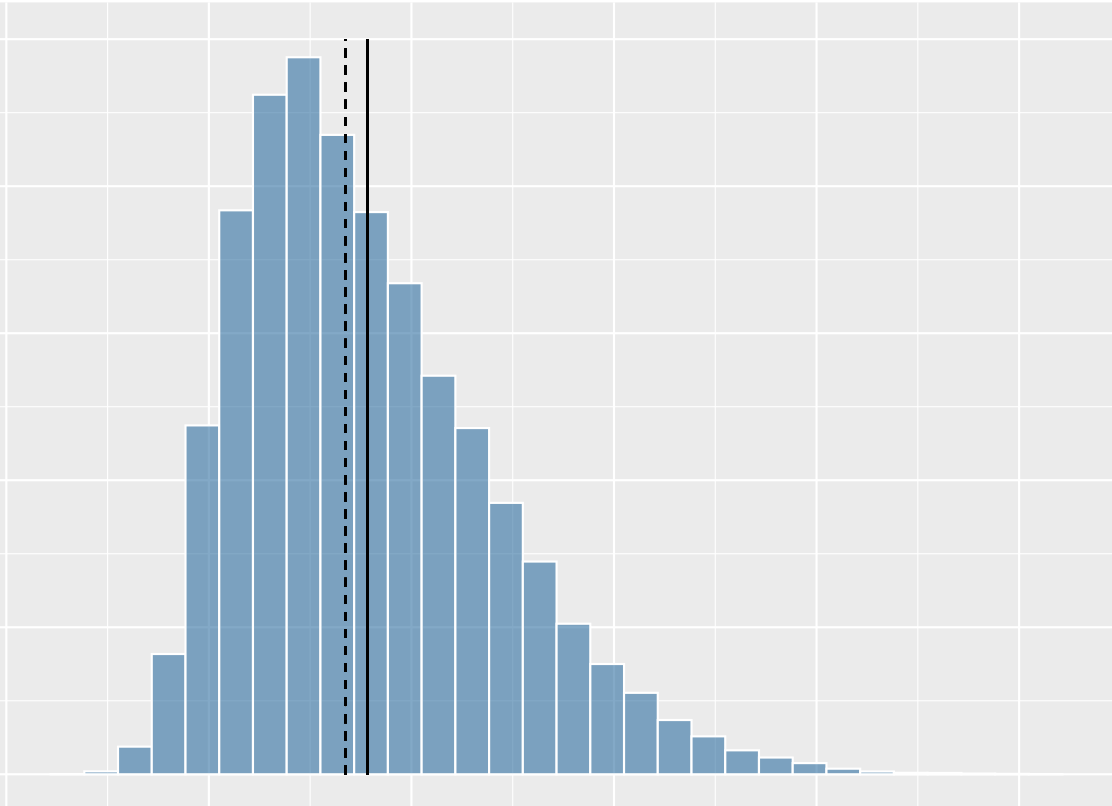
What shape of distribution is this?
skewed right
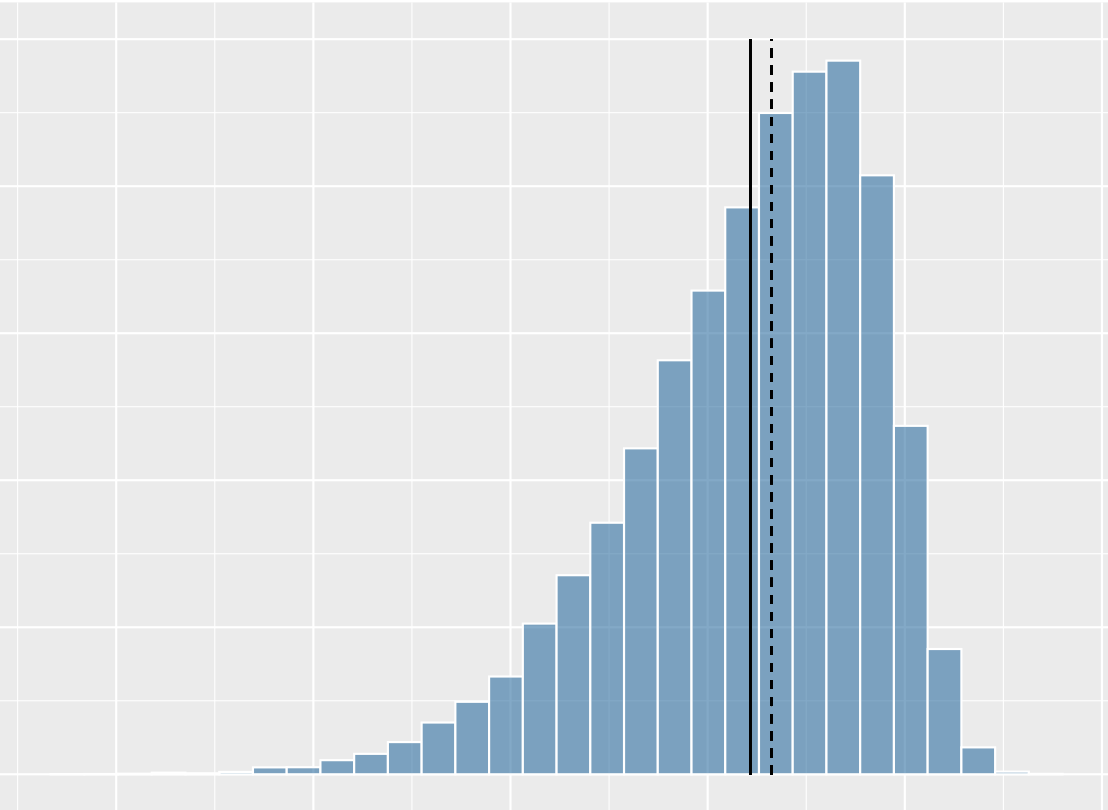
What shape of distribution is this?
skewed left
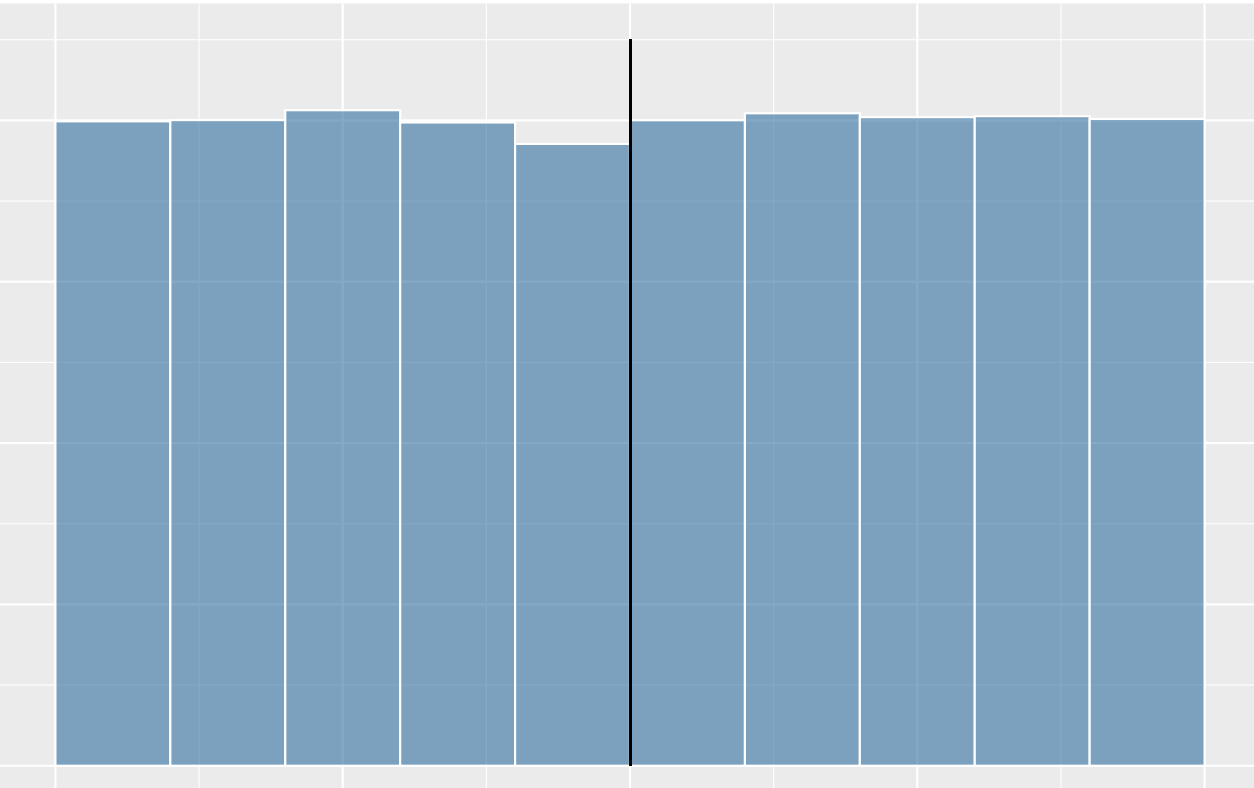
What shape of distribution is this?
uniform
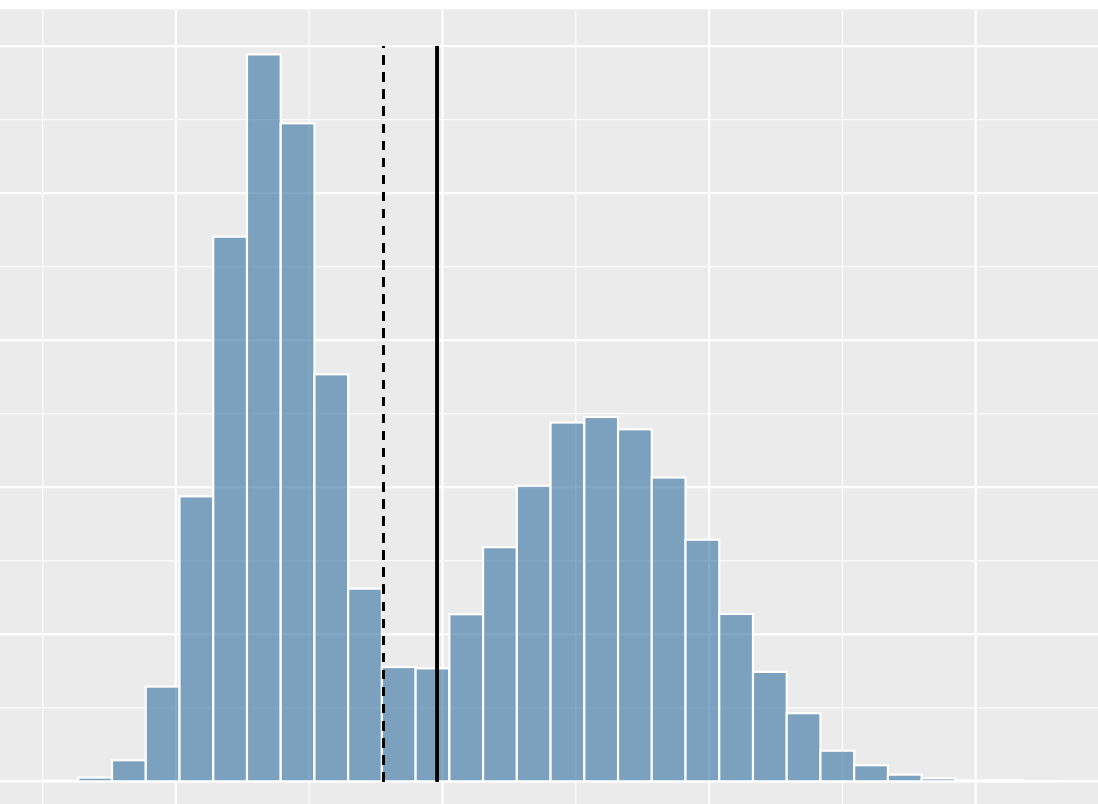
What shape of distribution is this?
non symmetric, bimodal
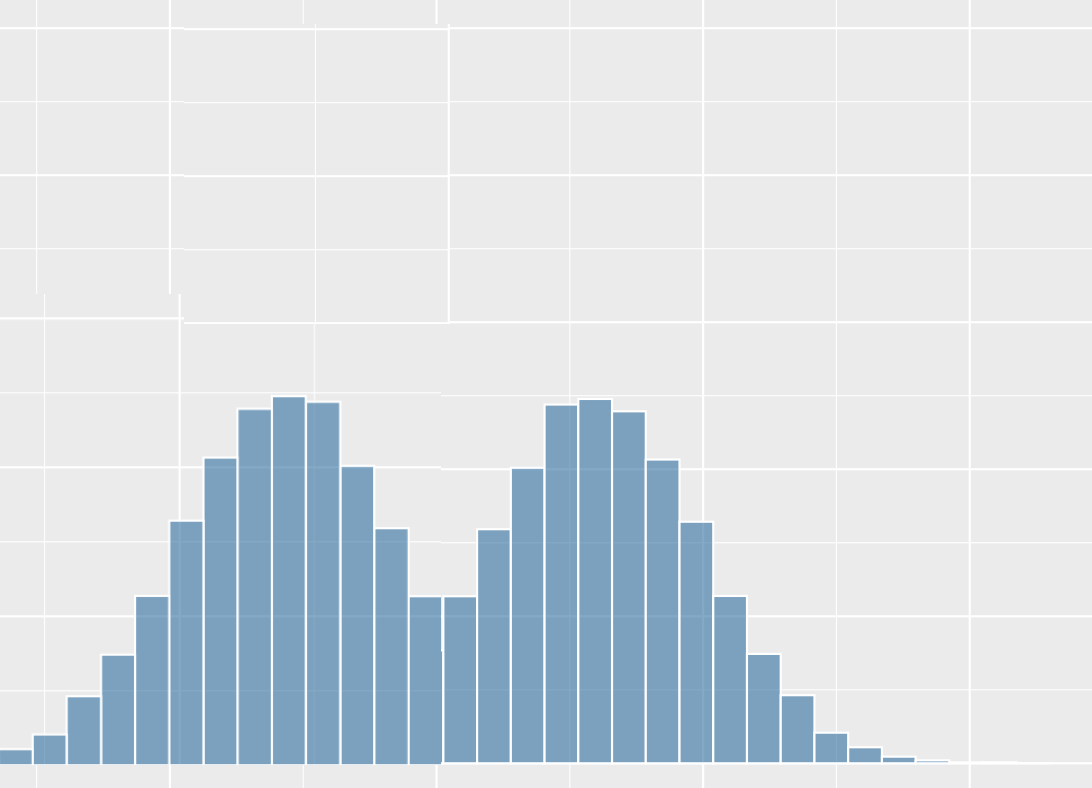
What shape of distribution is this?
symmetric, bimodal
What are the three measures of center?
mean, median, and mode
What is a mean?
average of a data set
How do you calculate a mean?
add up all values and divide by number of responses/data
What is a median?
middle of a data set
How do you calculate a median?
order data from smallest to largest, median is the center value or between the two middle ones if data is even
What is a mode?
data value that occurs most often, can be multiple or none
How are mean and median related when shape of distribution is symmetric?
mean = median
How are mean and median related when shape of distribution is skewed left?
mean < median
How are mean and median related when shape of distribution is skewed right?
mean > median
How is the mean affected when shape of distribution is skewed?
mean is pulled toward the skewed side
What is an outlier?
observed value that is notably distinct from other values in a dataset
What is a resistant statistic?
statistic that is relatively unaffected by extreme values
What are some examples of resistant statistics?
median, interquartile range
What is a 5-number summary?
method of summarizing datasets into quantiles to quickly find the 25th, 50th, and 75th percentiles of a distribution
What does a 5-number summary consist of?
minimum - smallest number, 0%
first quartile (Q1) - median of the first half of the data, 25%
median (Q2) - middle number, 50%
third quartile (Q3) - median of the 2nd half of the data, 75%
maximum - largest number, 100%
How is range of a data set calculated?
from 5-number summary: max-min
How is interquartile range (IQR) of a dataset calculated?
from 5-number summary: Q3-Q1
How are the bounds for outliers calculated?
lower bound: Q1 - 1.5(IQR)
upper bound: Q3 - 1.5(IQR)
What is a population?
includes all individuals/objects of interest
What is a sample?
refers to all cases we get data from, subset of the population
What is a statistical inference?
inference made using data from a sample to get info/make predictions about a population
What is sampling variability?
idea that if you take a sample of five people, another sample of five people will probably not get the same results
all samples result in this
What is sampling bias?
bias that occurs when the method of selecting a sample causes the sample to differ from the population in some relevant way
if this occurs we can’t trust the generalizations from the sample to the population
What is a census?
way to collect data in which data is collected from every subject in the population
ideal way to collect data but often hard to access
What are simple random samples (SRS)?
way to collect data in which each unit has the same probability of being chosen
What are systematic samples?
way to collect data in which you choose every nth person
What is stratified sampling?
way to collect data in which you break the population into groups that might matter and then pull an SRS of each group
What are the three ways of random sampling?
simple random sampling, systematic samples, and stratified sampling
What is important about random sampling?
occurs in data sets that don’t have bias, if we don’t randomly sample then bias will occur
What are the types of bias?
dependent sampling, voluntary response, response bias, and non-response bias
What is dependent sampling?
sampling scheme that gets observations related to each other
What is voluntary response?
only getting volunteers for a survey
What is response bias?
occurs when the wording of a question impacts the respondents’ answer
What is non-response bias?
when participants selected for the survey don’t complete it
more about fear of what responses may affect the person being surveyed rather than not having time to complete something or forgetting about it
What are box plots?
visualization of a 5 number summary and each section represents 25% of the data
What are the three measures of spread?
range, variance, standard deviation
What is range?
biggest value - smallest value
What is variance (s2)?
expected square deviation from mean
What is standard deviation (s)?
average deviation from the mean
What is the 95% rule/empirical rule?
used for data that is symmetric/bell-curved, 68% of dataset are within one s from the mean, 95% of dataset are within two s from the mean, 99.7% of dataset are within three s of the mean
How do we describe quantitive data?
CUSS statements: center, unusual points, shape, spread
How do we describe categorical data?
talk about proportions, counts, and percents
What are z-scores?
tells you how many standard deviations away from the mean a data point is
When a z-score is further from zero, what does that mean?
the value is more extreme
What is the equation for a z-score?
z = (x-mean)/s
What is an experiment?
study in which research actively controls one or more of the explanatory variables
What is an observational study?
study in which research doesn’t actively control value of any variables but simply observes values as they naturally exist
How are two variables determined to be associated?
values of one variable tend to be related to the values of the other variable
How are two variables determined to be casually associated?
changing the value of one variable influences the value of the other variable
What is a randomized experiment?
value of explanatory variable for each unit is determined randomly, before response variable is measured
What are the two types of randomized experiments?
comparative and matched pairs
What is a randomized comparative experiment?
randomly assign cases to different treatment groups, then compare results on the response variable
What is a matched pairs experiment?
each case gets both treatments in random order and we examine individual differences in response variable between two treatments
What is a confounding variable?
third variable related to both explanatory and response variables, can offer a plausible explanation for an association between two variables of interest, reason why we utilize random assignment, difficult to avoid in observational studies
What is a two-way table?
shows relationship between 2 categorical varibales
How do we determine categorical variables are associated?
one variable changes the likelihood of certain values for another variable
How do we determine association between numerical and categorical variables?
look at the center of the data, if the mean and standard deviation fall out of the mean of the other category then there’s an association
What is a correlation?
measurement used to describe how strong a linear relationship exists between numerical variables
What is important about correlations?
ONLY occur between numerical variables
What is a positive correlation?
as on variable increases, so does the other
What is a negative correlation?
as one variable increases, the other decreases
What is no correlation?
no distinct pattern/relationship
What are scatterplots?
visualization plot that allows us to see sty[e of correlation between two quantitative variables
What are the axes of scatterplots?
x: explanatory variable, y: response variable
How do we describe scatterplots?
DOFS statements: direction, outliers, form (linear or not), strength
What is a linear association?
when an explanatory variable increases, the response changes at a constant rate
How do we interpret correlation?
values close to -1 and 1 indicate a strong relationship, sign of correlation indicates the direction (positive or negative), closer to 0 indicates no linear relationship
What is a coefficient of determination (r2)?
how much of a response variable is caused or explained by an explanatory variable
What is a least squares regression line?
line that best represents the relationship between two quantitative variables in a scatterplot
How do we calculate a least squares line?
slope b: r(sy/sx)
y-intecept a: y bar - b(x bar)
How do we interpret a least squares regression line?
slope represents predicted change in response variable given a one unit increase in the explanatory variable, intercept represents predicted value for the response variable when the explanatory variable equals zero
What is a residual?
difference between observed and predicted values of a response variable
How do we determine a residual?
observed-predicted
What does a positive residual indicate?
above least squares regression line, under predicted value