3.1.1.2 Runoff variation and the flood hydrograph
1/5
There's no tags or description
Looks like no tags are added yet.
Name | Mastery | Learn | Test | Matching | Spaced | Call with Kai |
|---|
No analytics yet
Send a link to your students to track their progress
6 Terms
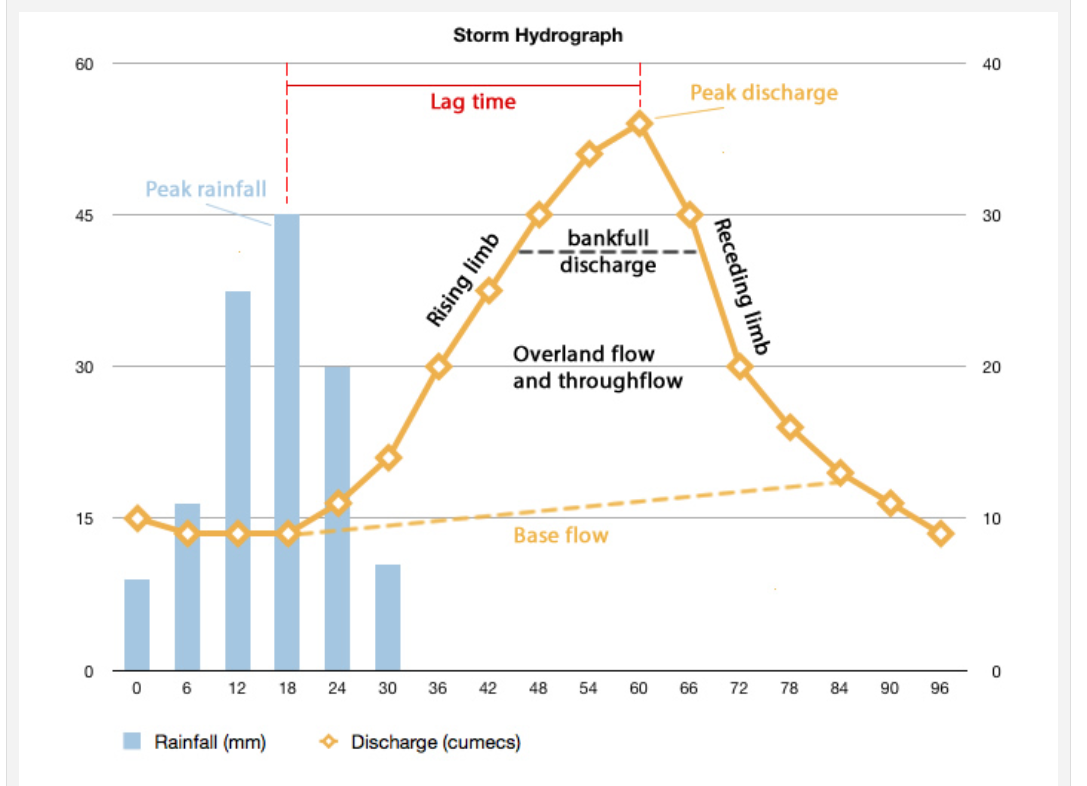
What is a flood hydropgraph include features
A flood hydrograph shows the amount of rainfall and river discharge in an area.
A flood hydrograph is a graph that shows a rivers discharge plotted over time in response to a rainfall event. Discharge is measured in Cubic metres per second (cumecs) Made up of baseflow and stormflow
● Rising Limb: The line on the graph that represents the discharge increasing.
● Falling Limb: The line on the graph that represents the discharge decreasing.
● Lag Time: The time between peak rainfall and peak discharge.
● Baseflow: The level of groundwater flow.
● Stormflow: Comprised of overland flow and throughflow.
● Bankfull Discharge: The maximum capacity of the river. If peak discharge exceeds this then the river will burst its banks and be in flood.
● Peak Discharge:Peak discharge is the maximum amount of water in a river after a rainfall event, if this level surpasses the bankfull discharge then a flood will occur where the river overtops its banks.
What are the two types of Hydrographs
Which is most likely to occur during a storm event?
Flashy hydrograph (most likely to occur during a storm event)
Subdued hydrograph
Draw a flashy hydrograph and outline common features
bonus: What is an anthropogenic reason for ‘Flashy hydrographs’
Short lag time
Steep rising and falling limb
Higher flood risk
High peak discharge
Urbanisation - Impermeable surfaces such as concrete roads and laying drains reduces lag time. Less vegetation means less infilitration
Urbanisation is the main human impact on a storm hydrograph. Surface runoff increases when areas are urbanised due to the removal of top soil and vegetation. As roads, pavements and buildings are constructed the surface becomes impermeable. Laying drains leads to the rapid transportation of water to river channels which reduces the lag time.
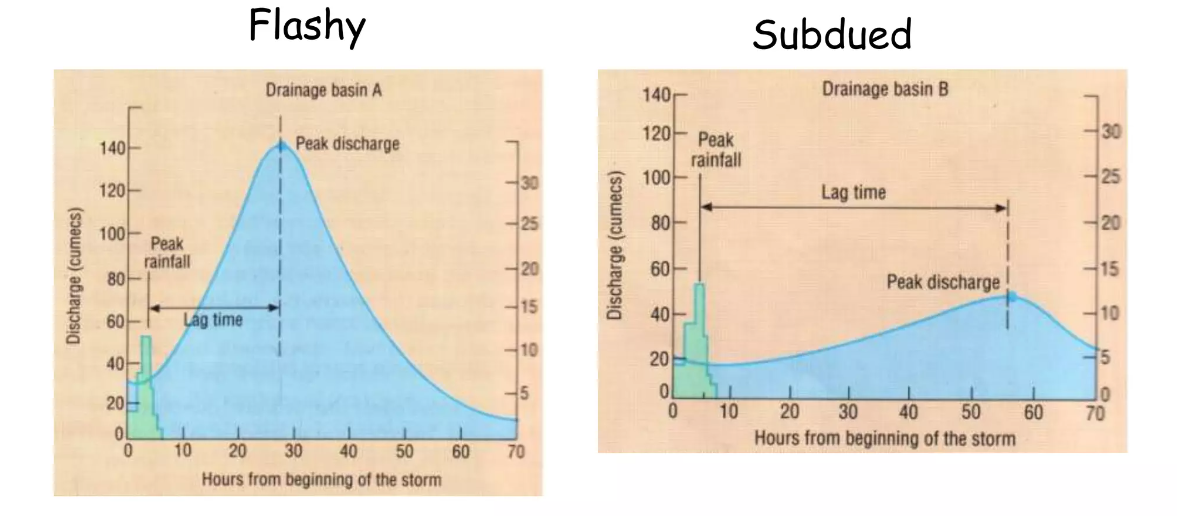
Draw a subdued hydrograph and outline common features
bonus: Outline a reason for more subdued hydrographs in rural areas?
Long lag time
Gradually rising and falling limb
Lower flood risk
Low peak discharge
Rural areas with predominantly permeable rock increases infiltration and decreases surface runoff. This increases lag time. The peak discharge is also lower as it takes water longer to reach the river channel.

What are the purposes of flood hydrographs [4 marks]
A flood hydrograph shows the amount of rainfall and river discharge in an area. Discharge is measured in Cubic metres per second (cumecs) Made up of baseflow and stormflow
Flood hydrographs provide a clear visual representation including: lag time, bankfull discharge and peak discharg
Flood hydrographs help assess flood risk and predict potential flood impacts
Can help to design flood control measures
What human and physical factors affect runoff variation
A variety of physical & human factors affect runoff (the flow of water over the Earth’s surface). Including:
Physical
Time of year
In summer, runoff levels are often low due to reduced rainfall. However, intense sunlight can bake the soil, making it hard for rain to soak in. In contrast, seasons like winter with high levels of precipitation (rainfall and snow) can lead to increased surface runoff.
Topography & relief
In “v” shaped valleys on steep slopes, runoff will increase due to gravity.
On flatter surfaces runoff is less likely to happen as water will be able to infiltrate into the soil more easily.
Storm conditions
Intense storms with heavy rainfall can lead to soils quickly becoming saturated. This can happen because of prolonged rainfall or intense rainfall.
HUMAN
Agricultural land use
Crops can intercept precipitation and reduce runoff.
Urban land use
Changing greenfield surfaces to impermeable concrete and tarmac as construction takes place can increase the level of runoff in an area